Work and Jobs in Lincoln City, Oregon (OR) Detailed Stats
Occupations, Industries, Unemployment, Workers, Commute
Settings
X


Recent posts about work in Lincoln City, Oregon on our local forum with over 2,400,000 registered users:
 | Brookings - considering for retirement but health care issue? (31 replies) |
| Oregon ends its 72-year ban on pumping your own gasoline (219 replies) |
| Lincoln City NOT Retiree Friendly (59 replies) |
| Coastal Oregon without Concentration of Homeless? (64 replies) |
| Best place to retire on the coast (117 replies) |
| Retirees have changed Florence (32 replies) |
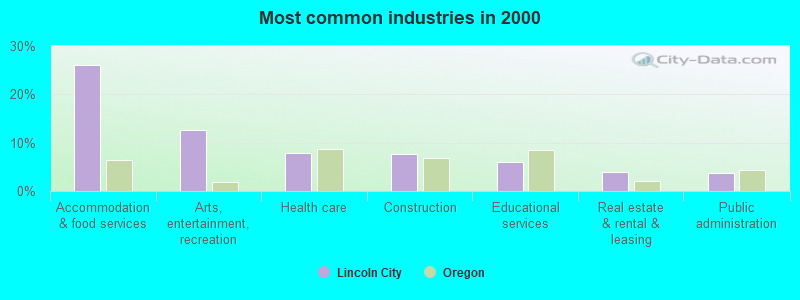
The most common industries in Lincoln City are: Accommodation & food services (26.2% of civilian employees), Arts, entertainment, recreation (12.7% of civilian employees), Health care (7.9% of civilian employees). 94.2% of workers work in Lincoln County and 13.4% of all workers work at home. 71.7% of workers are employees of private companies, which is 9.4% greater than the rate of 64.9% across the entire state of Oregon.
Whole page based on the data from 2000 / 2022 when the population of Lincoln City, Oregon was 7,437 / 9,815
Whole page based on the data from 2000 / 2022 when the population of Lincoln City, Oregon was 7,437 / 9,815
Most common industries
Most common industries | |||
|---|---|---|---|
Industry | All | Males | Females |
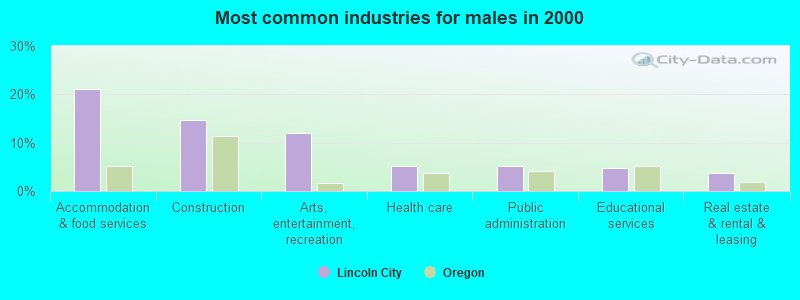
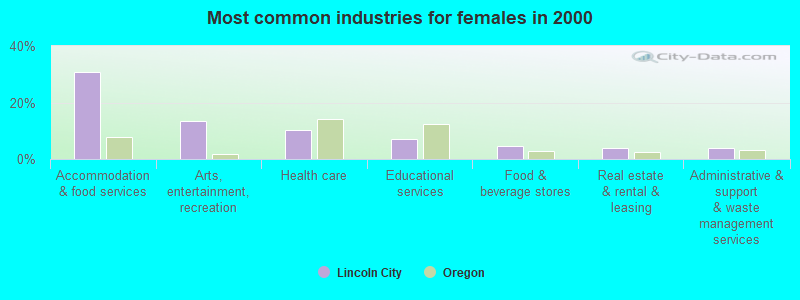
| Accommodation and food services | 26.2% (805) | 21.1% (315) | 31.0% (490) |
| Arts, entertainment, and recreation | 12.7% (390) | 11.9% (178) | 13.4% (212) |
| Health care | 7.9% (243) | 5.2% (78) | 10.4% (165) |
| Construction | 7.6% (235) | 14.8% (221) | 0.9% (14) |
| Educational services | 6.0% (186) | 4.8% (72) | 7.2% (114) |
| Real estate and rental and leasing | 3.9% (119) | 3.7% (55) | 4.0% (64) |
| Public administration | 3.7% (115) | 5.1% (76) | 2.5% (39) |
| Food and beverage stores | 3.4% (106) | 2.2% (33) | 4.6% (73) |
| Administrative and support and waste management services | 2.7% (84) | 1.6% (24) | 3.8% (60) |
| Used merchandise, gift, novelty, and souvenir, and other miscellaneous stores | 2.6% (80) | 2.3% (34) | 2.9% (46) |
| Professional, scientific, and technical services | 2.4% (74) | 2.8% (42) | 2.0% (32) |
| Building material and garden equipment and supplies dealers | 1.5% (46) | 2.1% (32) | 0.9% (14) |
| Finance and insurance | 1.4% (43) | 0.8% (12) | 2.0% (31) |
| Furniture and home furnishings, and household appliance stores | 1.2% (37) | 0.4% (6) | 2.0% (31) |
| Publishing, and motion picture and sound recording industries | 1.2% (37) | 2.1% (32) | 0.3% (5) |
| Clothing and accessories, including shoe, stores | 1.1% (35) | 0.3% (4) | 2.0% (31) |
| Repair and maintenance | 1.1% (34) | 1.9% (28) | 0.4% (6) |
| Personal and laundry services | 1.0% (30) | 0.0% (0) | 1.9% (30) |
| Broadcasting and telecommunications | 1.0% (30) | 2.0% (30) | 0.0% (0) |
| Wood products | 0.8% (24) | 1.6% (24) | 0.0% (0) |
| Other transportation, and support activities, and couriers | 0.8% (24) | 1.6% (24) | 0.0% (0) |
| Motor vehicle and parts dealers | 0.7% (22) | 1.5% (22) | 0.0% (0) |
| Private households | 0.7% (21) | 0.6% (9) | 0.8% (12) |
| Religious, grantmaking, civic, professional, and similar organizations | 0.6% (20) | 1.3% (20) | 0.0% (0) |
| Utilities | 0.6% (18) | 0.8% (12) | 0.4% (6) |
| Social assistance | 0.6% (17) | 0.5% (7) | 0.6% (10) |
| Food | 0.6% (17) | 0.3% (5) | 0.8% (12) |
| Other direct selling establishments | 0.5% (16) | 0.0% (0) | 1.0% (16) |
| Department and other general merchandise stores | 0.5% (15) | 0.5% (8) | 0.4% (7) |
| Agriculture, forestry, fishing and hunting | 0.4% (13) | 0.0% (0) | 0.8% (13) |
| Computer and electronic products | 0.4% (13) | 0.9% (13) | 0.0% (0) |
| Paper | 0.4% (13) | 0.9% (13) | 0.0% (0) |
| Metal and metal products | 0.4% (11) | 0.7% (11) | 0.0% (0) |
| Printing and related support activities | 0.4% (11) | 0.0% (0) | 0.7% (11) |
| Petroleum and petroleum products merchant wholesalers | 0.3% (10) | 0.3% (5) | 0.3% (5) |
| Gasoline stations | 0.3% (9) | 0.6% (9) | 0.0% (0) |
| Miscellaneous manufacturing | 0.3% (9) | 0.3% (4) | 0.3% (5) |
| Alcoholic beverages merchant wholesalers | 0.3% (9) | 0.6% (9) | 0.0% (0) |
| Transportation equipment | 0.3% (8) | 0.3% (4) | 0.3% (4) |
| Sporting goods, camera, and hobby and toy stores | 0.3% (8) | 0.5% (8) | 0.0% (0) |
| Miscellaneous nondurable goods merchant wholesalers | 0.3% (8) | 0.3% (4) | 0.3% (4) |
| Data processing, libraries, and other information services | 0.3% (8) | 0.3% (4) | 0.3% (4) |
| Mining, quarrying, and oil and gas extraction | 0.2% (7) | 0.5% (7) | 0.0% (0) |
| Electronic shopping and mail-order houses | 0.2% (7) | 0.0% (0) | 0.4% (7) |
| Apparel, fabrics, and notions merchant wholesalers | 0.2% (5) | 0.0% (0) | 0.3% (5) |
| Miscellaneous durable goods merchant wholesalers | 0.2% (5) | 0.0% (0) | 0.3% (5) |
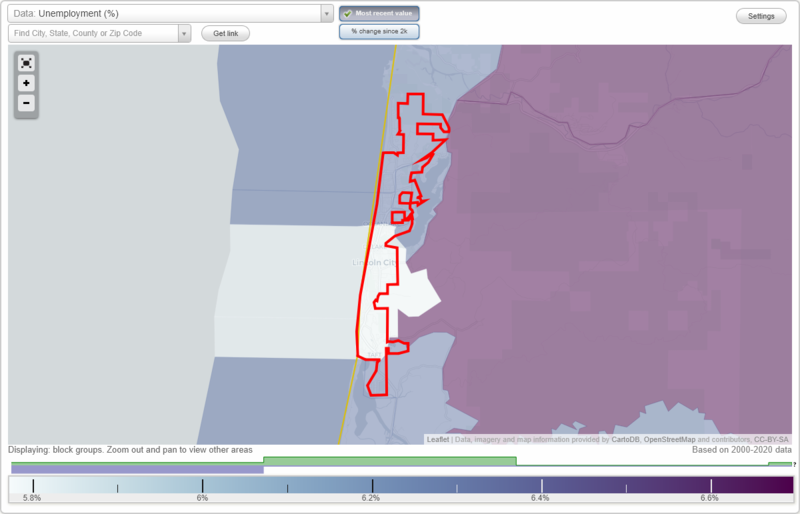
Unemployment in Lincoln City
- Unemployment by race in 2022
- Unemployment rate for White non-Hispanic residents
- 1.9%Males
- 2.1%Females
- Unemployment rate for American Indian and Alaska Native residents
- 29.8%Males
- 2.0%Females
- Unemployment rate for Asian residents
- 8.8%Males
- Unemployment rate for other race residents
- 0.5%Males
- Unemployment rate for two or more race residents
- 0.5%Males
- 16.5%Females
- Unemployment rate for Hispanic or Latino residents
- 0.2%Males
- 12.9%Females
- Unemployment by race in 2000
- Unemployment rate for White non-Hispanic residents
- 14.4%Males
- 7.7%Females
- Unemployment rate for American Indian and Alaska Native residents
- 8.6%Males
- 14.3%Females
- Unemployment rate for Asian residents
- 28.6%Males
- Unemployment rate for other race residents
- 22.0%Females
- Unemployment rate for two or more race residents
- 41.6%Males
- Unemployment rate for Hispanic or Latino residents
- 22.2%Males
- 10.2%Females
Time leaving home to go to work
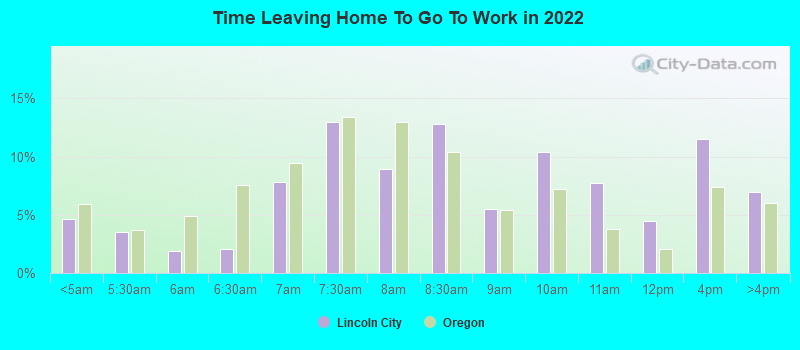
12:00 a.m. to 4:59 a.m.:
| Lincoln City: | 4.7% (163) |
| Oregon: | 5.9% (98,245) |
5:00 a.m. to 5:29 a.m.:
| Lincoln City: | 3.5% (123) |
| Oregon: | 3.7% (61,686) |
5:30 a.m. to 5:59 a.m.:
| Lincoln City: | 1.9% (65) |
| Oregon: | 4.9% (81,016) |
6:00 a.m. to 6:29 a.m.:
| Lincoln City: | 2.0% (70) |
| Oregon: | 7.6% (125,831) |
6:30 a.m. to 6:59 a.m.:
| Lincoln City: | 7.8% (272) |
| Oregon: | 9.4% (157,114) |
7:00 a.m. to 7:29 a.m.:
| Lincoln City: | 13.0% (453) |
| Oregon: | 13.4% (222,929) |
7:30 a.m. to 7:59 a.m.:
| Lincoln City: | 8.9% (311) |
| Oregon: | 12.9% (215,364) |
8:00 a.m. to 8:29 a.m.:
| Lincoln City: | 12.8% (446) |
| Oregon: | 10.4% (172,765) |
8:30 a.m. to 8:59 a.m.:
| Lincoln City: | 5.5% (192) |
| Oregon: | 5.4% (89,869) |
9:00 a.m. to 9:59 a.m.:
| Lincoln City: | 10.4% (362) |
| Oregon: | 7.2% (120,009) |
10:00 a.m. to 10:59 a.m.:
| Lincoln City: | 7.8% (270) |
| Oregon: | 3.8% (63,360) |
11:00 a.m. to 11:59 a.m.:
| Lincoln City: | 4.5% (155) |
| Oregon: | 2.1% (34,334) |
12:00 p.m. to 3:59 p.m.:
| Lincoln City: | 11.5% (402) |
| Oregon: | 7.4% (123,119) |
4:00 p.m. to 11:59 p.m.:
| Lincoln City: | 6.9% (242) |
| Oregon: | 6.0% (99,745) |
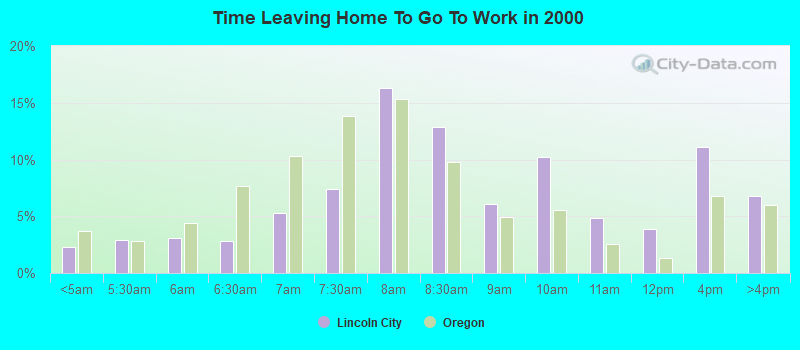
<5am:
| Lincoln City: | 2.3% (69) |
| Oregon: | 3.7% (58,821) |
5:30am:
| Lincoln City: | 3.0% (89) |
| Oregon: | 2.8% (44,872) |
6am:
| Lincoln City: | 3.1% (92) |
| Oregon: | 4.4% (71,163) |
6:30am:
| Lincoln City: | 2.9% (86) |
| Oregon: | 7.7% (122,707) |
7am:
| Lincoln City: | 5.3% (160) |
| Oregon: | 10.3% (165,185) |
7:30am:
| Lincoln City: | 7.4% (224) |
| Oregon: | 13.9% (222,209) |
8am:
| Lincoln City: | 16.3% (491) |
| Oregon: | 15.3% (245,415) |
8:30am:
| Lincoln City: | 12.9% (389) |
| Oregon: | 9.8% (156,781) |
9am:
| Lincoln City: | 6.1% (184) |
| Oregon: | 4.9% (78,436) |
10am:
| Lincoln City: | 10.2% (309) |
| Oregon: | 5.5% (88,783) |
11am:
| Lincoln City: | 4.8% (146) |
| Oregon: | 2.6% (41,539) |
12pm:
| Lincoln City: | 3.9% (117) |
| Oregon: | 1.3% (20,765) |
4pm:
| Lincoln City: | 11.1% (335) |
| Oregon: | 6.8% (108,927) |
>4pm:
| Lincoln City: | 6.8% (204) |
| Oregon: | 6.0% (95,989) |
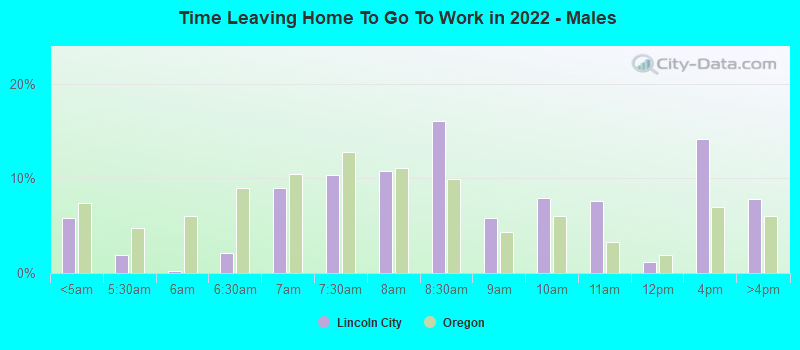
12:00 a.m. to 4:59 a.m. - Males:
| Lincoln City: | 5.8% (97) |
| Oregon: | 7.4% (66,534) |
5:00 a.m. to 5:29 a.m. - Males:
| Lincoln City: | 1.9% (31) |
| Oregon: | 4.8% (42,985) |
5:30 a.m. to 5:59 a.m. - Males:
| Lincoln City: | 0.2% (4) |
| Oregon: | 6.1% (54,375) |
6:00 a.m. to 6:29 a.m. - Males:
| Lincoln City: | 2.1% (35) |
| Oregon: | 9.0% (80,638) |
6:30 a.m. to 6:59 a.m. - Males:
| Lincoln City: | 9.0% (151) |
| Oregon: | 10.4% (93,611) |
7:00 a.m. to 7:29 a.m. - Males:
| Lincoln City: | 10.4% (173) |
| Oregon: | 12.8% (114,794) |
7:30 a.m. to 7:59 a.m. - Males:
| Lincoln City: | 10.8% (181) |
| Oregon: | 11.1% (99,832) |
8:00 a.m. to 8:29 a.m. - Males:
| Lincoln City: | 16.1% (269) |
| Oregon: | 10.0% (89,351) |
8:30 a.m. to 8:59 a.m. - Males:
| Lincoln City: | 5.9% (98) |
| Oregon: | 4.3% (38,595) |
9:00 a.m. to 9:59 a.m. - Males:
| Lincoln City: | 8.0% (133) |
| Oregon: | 6.0% (53,791) |
10:00 a.m. to 10:59 a.m. - Males:
| Lincoln City: | 7.6% (128) |
| Oregon: | 3.3% (29,707) |
11:00 a.m. to 11:59 a.m. - Males:
| Lincoln City: | 1.2% (20) |
| Oregon: | 1.9% (16,784) |
12:00 p.m. to 3:59 p.m. - Males:
| Lincoln City: | 14.2% (237) |
| Oregon: | 7.0% (62,443) |
4:00 p.m. to 11:59 p.m. - Males:
| Lincoln City: | 7.8% (131) |
| Oregon: | 6.0% (54,001) |
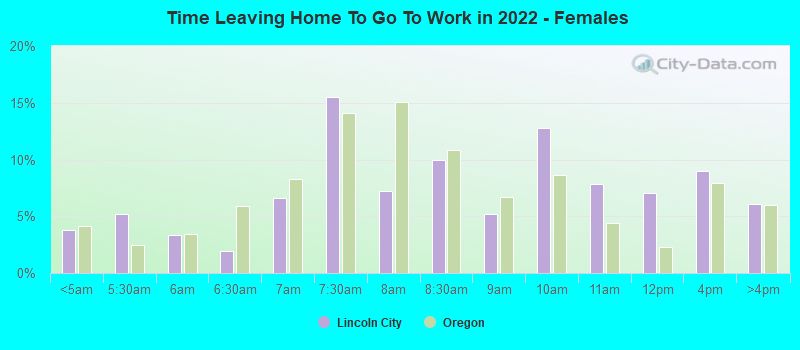
12:00 a.m. to 4:59 a.m. - Females:
| Lincoln City: | 3.8% (68) |
| Oregon: | 4.1% (31,711) |
5:00 a.m. to 5:29 a.m. - Females:
| Lincoln City: | 5.2% (95) |
| Oregon: | 2.4% (18,701) |
5:30 a.m. to 5:59 a.m. - Females:
| Lincoln City: | 3.3% (60) |
| Oregon: | 3.5% (26,641) |
6:00 a.m. to 6:29 a.m. - Females:
| Lincoln City: | 1.9% (35) |
| Oregon: | 5.9% (45,193) |
6:30 a.m. to 6:59 a.m. - Females:
| Lincoln City: | 6.6% (120) |
| Oregon: | 8.3% (63,503) |
7:00 a.m. to 7:29 a.m. - Females:
| Lincoln City: | 15.5% (281) |
| Oregon: | 14.1% (108,135) |
7:30 a.m. to 7:59 a.m. - Females:
| Lincoln City: | 7.2% (130) |
| Oregon: | 15.0% (115,532) |
8:00 a.m. to 8:29 a.m. - Females:
| Lincoln City: | 10.0% (180) |
| Oregon: | 10.9% (83,414) |
8:30 a.m. to 8:59 a.m. - Females:
| Lincoln City: | 5.2% (94) |
| Oregon: | 6.7% (51,274) |
9:00 a.m. to 9:59 a.m. - Females:
| Lincoln City: | 12.8% (231) |
| Oregon: | 8.6% (66,218) |
10:00 a.m. to 10:59 a.m. - Females:
| Lincoln City: | 7.9% (142) |
| Oregon: | 4.4% (33,653) |
11:00 a.m. to 11:59 a.m. - Females:
| Lincoln City: | 7.1% (128) |
| Oregon: | 2.3% (17,550) |
12:00 p.m. to 3:59 p.m. - Females:
| Lincoln City: | 9.0% (162) |
| Oregon: | 7.9% (60,676) |
4:00 p.m. to 11:59 p.m. - Females:
| Lincoln City: | 6.1% (111) |
| Oregon: | 6.0% (45,744) |
Travel time to work
Percentage of workers working in this county: 94.2%
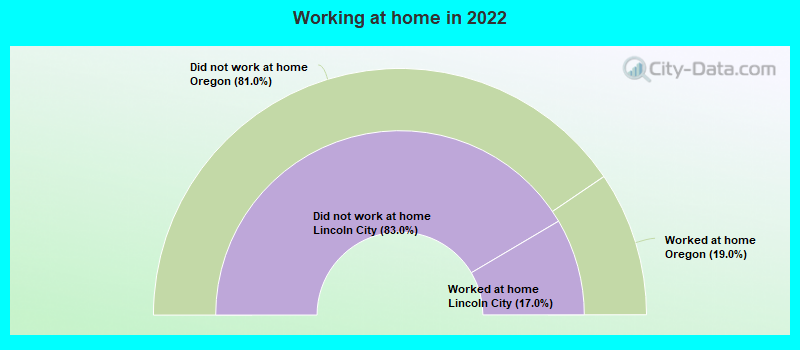
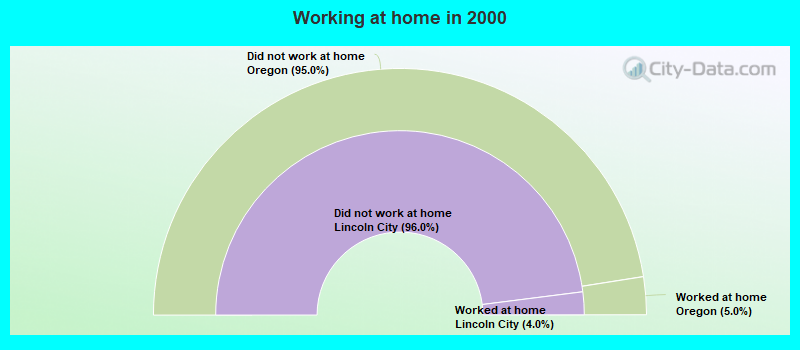
Number of people working at home: 565 (13.4% of all workers)
Daytime population change due to commuting: +1,739 (+23.4%)
Workers who live and work in this city: 2,246 (74.5%)
Number of people working at home: 565 (13.4% of all workers)
Daytime population change due to commuting: +1,739 (+23.4%)
Workers who live and work in this city: 2,246 (74.5%)
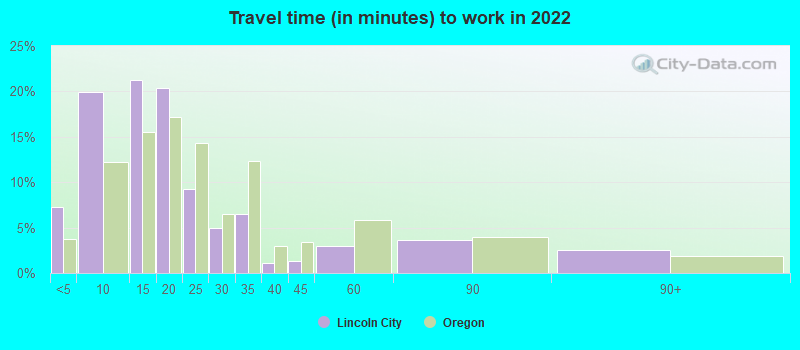
Less than 5 minutes:
| Lincoln City: | 7.3% (341) |
| Oregon: | 3.8% (64,562) |
5 to 9 minutes:
| Lincoln City: | 19.9% (932) |
| Oregon: | 12.2% (208,044) |
10 to 14 minutes:
| Lincoln City: | 21.2% (993) |
| Oregon: | 15.6% (265,246) |
15 to 19 minutes:
| Lincoln City: | 20.4% (954) |
| Oregon: | 17.1% (292,377) |
20 to 24 minutes:
| Lincoln City: | 9.2% (432) |
| Oregon: | 14.3% (244,310) |
25 to 29 minutes:
| Lincoln City: | 5.0% (232) |
| Oregon: | 6.6% (111,737) |
30 to 34 minutes:
| Lincoln City: | 6.5% (303) |
| Oregon: | 12.4% (211,004) |
35 to 39 minutes:
| Lincoln City: | 1.0% (49) |
| Oregon: | 2.9% (49,792) |
40 to 44 minutes:
| Lincoln City: | 1.3% (60) |
| Oregon: | 3.4% (57,989) |
45 to 59 minutes:
| Lincoln City: | 2.9% (137) |
| Oregon: | 5.9% (99,833) |
60 to 89 minutes:
| Lincoln City: | 3.6% (170) |
| Oregon: | 4.0% (68,132) |
90 or more minutes:
| Lincoln City: | 2.5% (119) |
| Oregon: | 1.9% (32,714) |
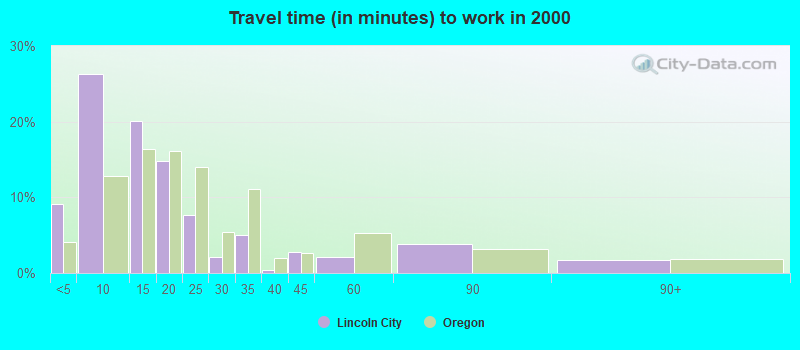
Less than 5 minutes:
| Lincoln City: | 9.2% (277) |
| Oregon: | 4.1% (66,369) |
5 to 9 minutes:
| Lincoln City: | 26.3% (794) |
| Oregon: | 12.9% (206,168) |
10 to 14 minutes:
| Lincoln City: | 20.1% (607) |
| Oregon: | 16.5% (263,466) |
15 to 19 minutes:
| Lincoln City: | 14.8% (446) |
| Oregon: | 16.1% (258,476) |
20 to 24 minutes:
| Lincoln City: | 7.7% (231) |
| Oregon: | 13.9% (223,370) |
25 to 29 minutes:
| Lincoln City: | 2.2% (65) |
| Oregon: | 5.4% (87,147) |
30 to 34 minutes:
| Lincoln City: | 5.0% (151) |
| Oregon: | 11.0% (176,763) |
35 to 39 minutes:
| Lincoln City: | 0.4% (12) |
| Oregon: | 2.0% (32,680) |
40 to 44 minutes:
| Lincoln City: | 2.8% (84) |
| Oregon: | 2.7% (43,262) |
45 to 59 minutes:
| Lincoln City: | 2.1% (62) |
| Oregon: | 5.2% (83,858) |
60 to 89 minutes:
| Lincoln City: | 3.8% (115) |
| Oregon: | 3.2% (51,318) |
90 or more minutes:
| Lincoln City: | 1.7% (51) |
| Oregon: | 1.8% (28,715) |
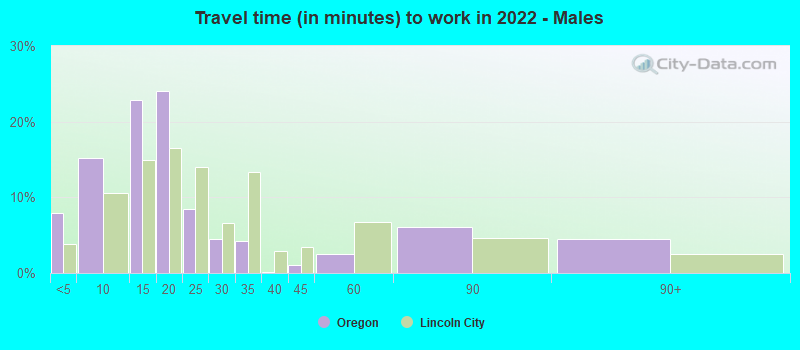
Less than 5 minutes - Males:
| Lincoln City: | 7.9% (171) |
| Oregon: | 3.9% (35,873) |
5 to 9 minutes - Males:
| Lincoln City: | 15.2% (328) |
| Oregon: | 10.5% (97,375) |
10 to 14 minutes - Males:
| Lincoln City: | 22.8% (490) |
| Oregon: | 14.9% (137,954) |
15 to 19 minutes - Males:
| Lincoln City: | 24.1% (518) |
| Oregon: | 16.6% (153,409) |
20 to 24 minutes - Males:
| Lincoln City: | 8.5% (182) |
| Oregon: | 13.9% (129,001) |
25 to 29 minutes - Males:
| Lincoln City: | 4.5% (97) |
| Oregon: | 6.6% (61,456) |
30 to 34 minutes - Males:
| Lincoln City: | 4.2% (91) |
| Oregon: | 13.3% (123,036) |
35 to 39 minutes - Males:
| Lincoln City: | 0.1% (2) |
| Oregon: | 2.9% (26,871) |
40 to 44 minutes - Males:
| Lincoln City: | 1.0% (22) |
| Oregon: | 3.5% (32,191) |
45 to 59 minutes - Males:
| Lincoln City: | 2.6% (55) |
| Oregon: | 6.7% (62,211) |
60 to 89 minutes - Males:
| Lincoln City: | 6.1% (131) |
| Oregon: | 4.6% (42,672) |
90 or more minutes - Males:
| Lincoln City: | 4.5% (97) |
| Oregon: | 2.5% (23,008) |
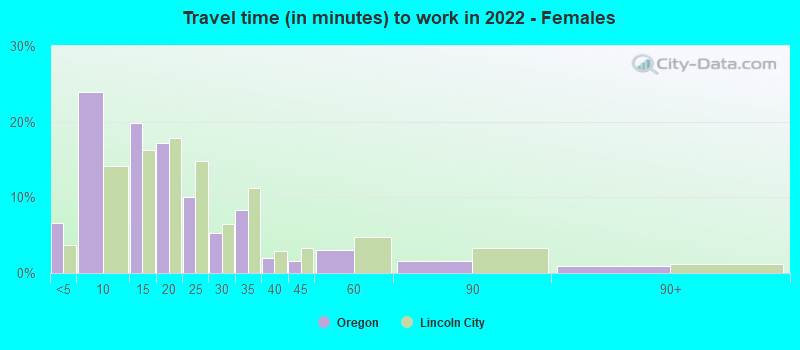
Less than 5 minutes - Females:
| Lincoln City: | 6.6% (168) |
| Oregon: | 3.7% (28,689) |
5 to 9 minutes - Females:
| Lincoln City: | 23.9% (605) |
| Oregon: | 14.2% (110,669) |
10 to 14 minutes - Females:
| Lincoln City: | 19.8% (502) |
| Oregon: | 16.3% (127,292) |
15 to 19 minutes - Females:
| Lincoln City: | 17.2% (435) |
| Oregon: | 17.8% (138,968) |
20 to 24 minutes - Females:
| Lincoln City: | 10.0% (253) |
| Oregon: | 14.8% (115,309) |
25 to 29 minutes - Females:
| Lincoln City: | 5.3% (133) |
| Oregon: | 6.4% (50,281) |
30 to 34 minutes - Females:
| Lincoln City: | 8.3% (211) |
| Oregon: | 11.3% (87,968) |
35 to 39 minutes - Females:
| Lincoln City: | 2.0% (51) |
| Oregon: | 2.9% (22,921) |
40 to 44 minutes - Females:
| Lincoln City: | 1.6% (40) |
| Oregon: | 3.3% (25,798) |
45 to 59 minutes - Females:
| Lincoln City: | 3.1% (78) |
| Oregon: | 4.8% (37,622) |
60 to 89 minutes - Females:
| Lincoln City: | 1.5% (38) |
| Oregon: | 3.3% (25,460) |
90 or more minutes - Females:
| Lincoln City: | 0.9% (23) |
| Oregon: | 1.2% (9,706) |
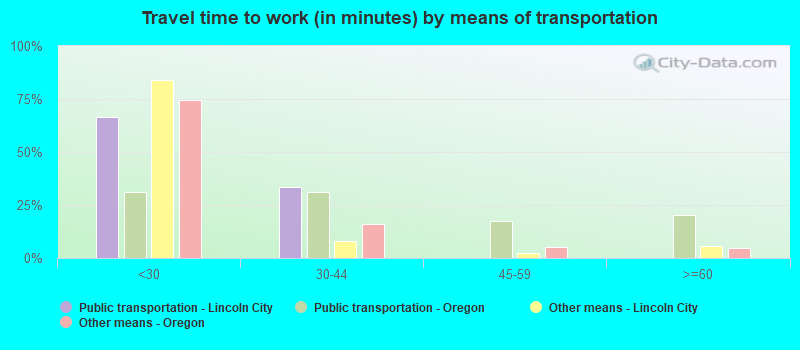
Means of transportation to work
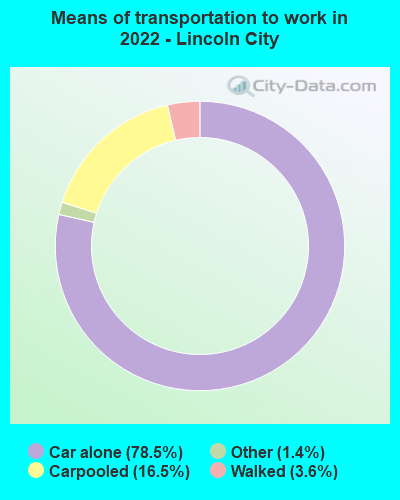
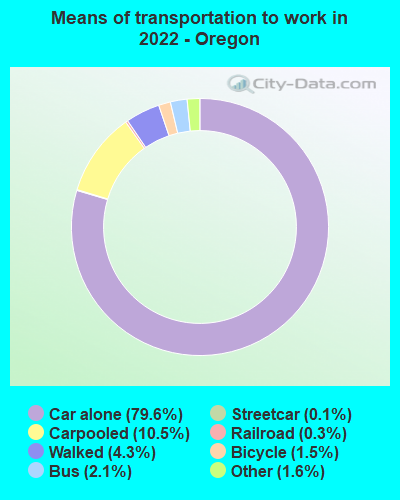
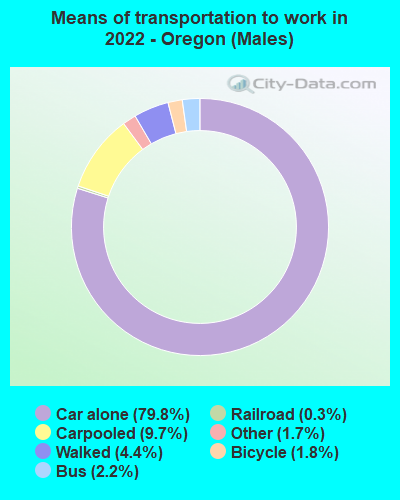
Drove car alone:
| Lincoln City: | 78.5% (3,854) |
| Oregon: | 79.6% (619,058) |
Carpooled:
| Lincoln City: | 16.5% (808) |
| Oregon: | 10.5% (88,500) |
Bus:
| Lincoln City: | 0.0% (2) |
| Oregon: | 2.1% (15,175) |
Walked:
| Lincoln City: | 3.6% (175) |
| Oregon: | 4.3% (33,279) |
Other means:
| Lincoln City: | 1.4% (68) |
| Oregon: | 1.6% (11,115) |
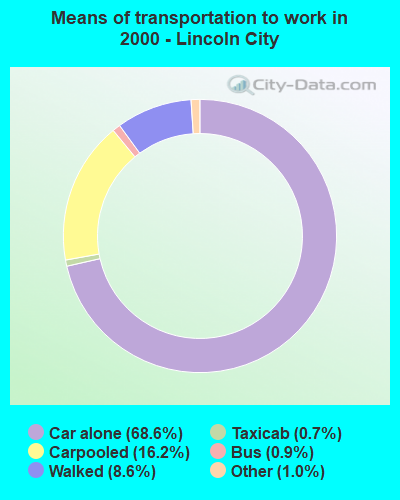

Drove car alone:
| Lincoln City: | 68.6% (2,070) |
| Oregon: | 73.2% (1,171,641) |
Carpooled:
| Lincoln City: | 16.2% (490) |
| Oregon: | 12.2% (195,950) |
Bus or trolley bus:
| Lincoln City: | 0.9% (28) |
| Oregon: | 3.5% (56,795) |
Taxicab:
| Lincoln City: | 0.7% (20) |
| Oregon: | 0.0% (747) |
Walked:
| Lincoln City: | 8.6% (258) |
| Oregon: | 3.6% (57,217) |
Other means:
| Lincoln City: | 1.0% (29) |
| Oregon: | 0.7% (10,882) |
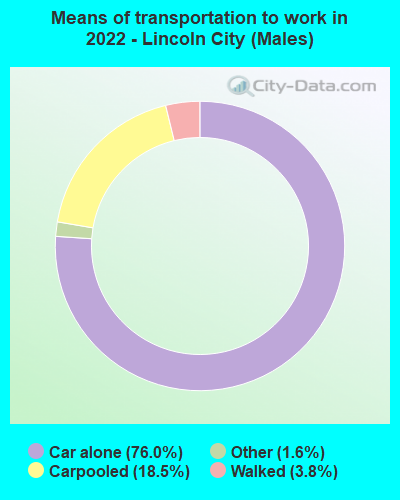
Drove car alone - Males:
| Lincoln City: | 76.0% (1,704) |
| Oregon: | 79.8% (619,058) |
Carpooled - Males:
| Lincoln City: | 18.5% (414) |
| Oregon: | 9.7% (88,500) |
Bus - Males:
| Lincoln City: | 0.1% (2) |
| Oregon: | 2.2% (15,175) |
Walked - Males:
| Lincoln City: | 3.8% (86) |
| Oregon: | 4.4% (33,279) |
Other means - Males:
| Lincoln City: | 1.6% (35) |
| Oregon: | 1.7% (11,115) |
Drove car alone - Females:
| Lincoln City: | 80.7% (2,156) |
| Oregon: | 79.3% (619,058) |
Carpooled - Females:
| Lincoln City: | 14.7% (394) |
| Oregon: | 11.3% (88,500) |
Walked - Females:
| Lincoln City: | 3.3% (89) |
| Oregon: | 4.3% (33,279) |
Other means - Females:
| Lincoln City: | 1.2% (33) |
| Oregon: | 1.4% (11,115) |
Private vehicle occupancy
Drove alone:
| Lincoln City: | 86.9% (2,797) |
| Oregon: | 88.2% (1,317,823) |
In 2 person carpool:
| Lincoln City: | 11.8% (381) |
| Oregon: | 9.0% (134,621) |
In 3 person carpool:
| Lincoln City: | 1.0% (31) |
| Oregon: | 1.8% (26,995) |
In 7+ person carpool:
| Lincoln City: | 0.2% (5) |
| Oregon: | 0.2% (3,122) |
Drove alone:
| Lincoln City: | 80.9% (2,070) |
| Oregon: | 85.7% (1,171,641) |
In 2 person carpool:
| Lincoln City: | 15.8% (404) |
| Oregon: | 11.5% (156,754) |
In 3 person carpool:
| Lincoln City: | 2.4% (62) |
| Oregon: | 1.9% (25,457) |
In 5-6 person carpool:
| Lincoln City: | 0.9% (24) |
| Oregon: | 0.3% (3,715) |
Class of workers
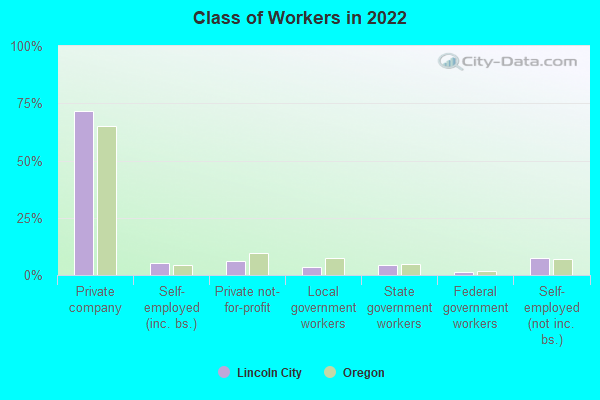
Employee of private company:
| Lincoln City: | 71.7% (3,078) |
| Oregon: | 64.9% (1,360,643) |
Self-employed in own incorporated business:
| Lincoln City: | 5.2% (223) |
| Oregon: | 4.4% (91,430) |
Private not-for-profit wage and salary workers:
| Lincoln City: | 6.1% (260) |
| Oregon: | 9.6% (201,342) |
Local government workers:
| Lincoln City: | 3.7% (159) |
| Oregon: | 7.2% (151,100) |
State government workers:
| Lincoln City: | 4.5% (192) |
| Oregon: | 5.0% (103,943) |
Federal government workers:
| Lincoln City: | 1.5% (64) |
| Oregon: | 1.7% (35,607) |
Self-employed workers in own not incorporated business:
| Lincoln City: | 7.2% (310) |
| Oregon: | 6.9% (145,422) |
Unpaid family workers:
| Lincoln City: | 0.2% (8) |
| Oregon: | 0.3% (5,876) |
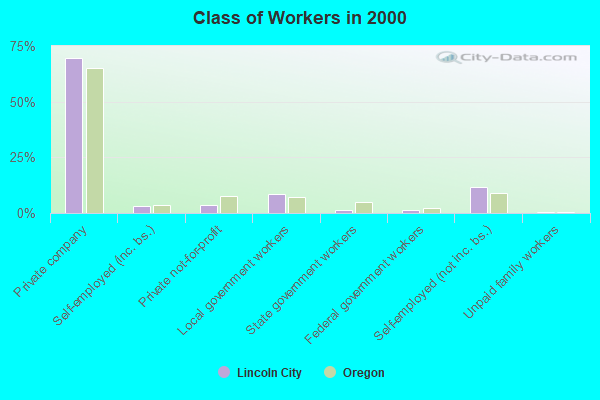
Employee of private company:
| Lincoln City: | 69.7% (2,144) |
| Oregon: | 65.1% (1,059,139) |
Self-employed in own incorporated business:
| Lincoln City: | 3.0% (91) |
| Oregon: | 3.8% (61,386) |
Private not-for-profit wage and salary workers:
| Lincoln City: | 3.8% (117) |
| Oregon: | 7.4% (120,839) |
Local government workers:
| Lincoln City: | 8.4% (259) |
| Oregon: | 7.2% (116,733) |
State government workers:
| Lincoln City: | 1.3% (40) |
| Oregon: | 5.0% (81,804) |
Federal government workers:
| Lincoln City: | 1.3% (40) |
| Oregon: | 2.2% (36,076) |
Self-employed workers in own not incorporated business:
| Lincoln City: | 11.9% (366) |
| Oregon: | 8.9% (145,020) |
Unpaid family workers:
| Lincoln City: | 0.6% (20) |
| Oregon: | 0.4% (6,772) |
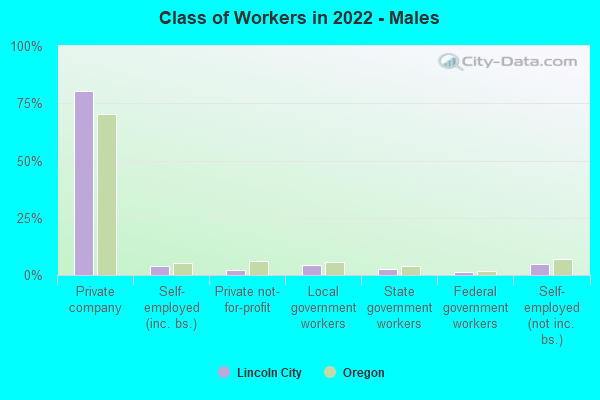
Employee of private company - Males:
| Lincoln City: | 80.5% (1,690) |
| Oregon: | 70.1% (771,769) |
Self-employed in own incorporated business - Males:
| Lincoln City: | 4.0% (84) |
| Oregon: | 5.2% (57,168) |
Private not-for-profit wage and salary workers - Males:
| Lincoln City: | 2.0% (42) |
| Oregon: | 6.2% (68,159) |
Local government workers - Males:
| Lincoln City: | 4.4% (92) |
| Oregon: | 5.5% (60,350) |
State government workers - Males:
| Lincoln City: | 2.5% (53) |
| Oregon: | 3.9% (42,724) |
Federal government workers - Males:
| Lincoln City: | 1.2% (26) |
| Oregon: | 1.9% (21,082) |
Self-employed workers in own not incorporated business - Males:
| Lincoln City: | 5.0% (104) |
| Oregon: | 6.9% (76,355) |
Unpaid family workers - Males:
| Lincoln City: | 0.4% (8) |
| Oregon: | 0.2% (2,641) |
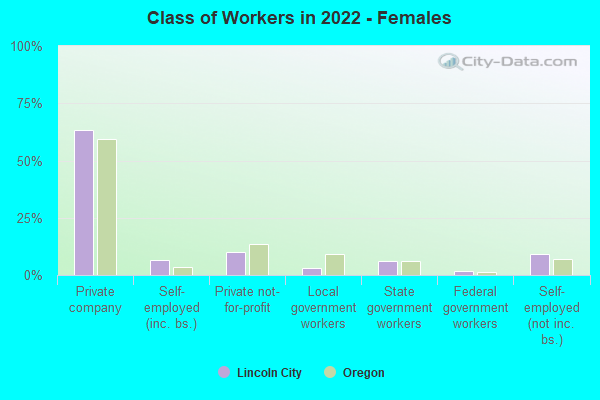
Employee of private company - Females:
| Lincoln City: | 63.3% (1,388) |
| Oregon: | 59.2% (588,874) |
Self-employed in own incorporated business - Females:
| Lincoln City: | 6.3% (139) |
| Oregon: | 3.4% (34,262) |
Private not-for-profit wage and salary workers - Females:
| Lincoln City: | 9.9% (218) |
| Oregon: | 13.4% (133,183) |
Local government workers - Females:
| Lincoln City: | 3.0% (67) |
| Oregon: | 9.1% (90,750) |
State government workers - Females:
| Lincoln City: | 6.3% (138) |
| Oregon: | 6.2% (61,219) |
Federal government workers - Females:
| Lincoln City: | 1.7% (38) |
| Oregon: | 1.5% (14,525) |
Self-employed workers in own not incorporated business - Females:
| Lincoln City: | 9.4% (206) |
| Oregon: | 6.9% (69,067) |