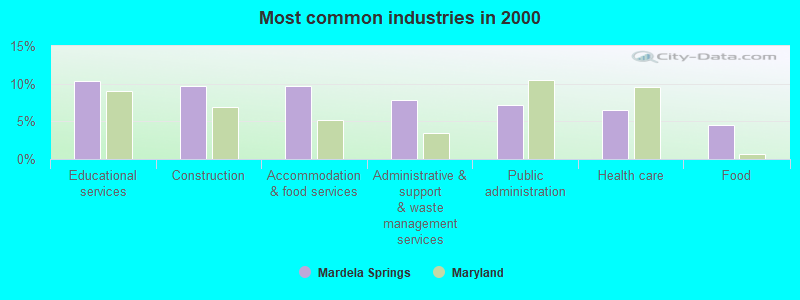
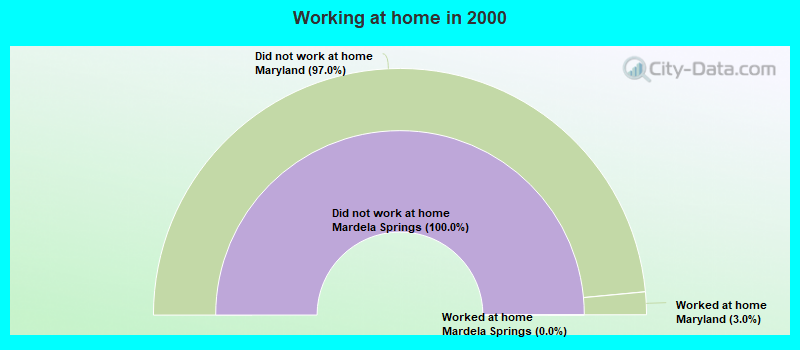
The most common industries in Mardela Springs are: Educational services (10.4% of civilian employees), Construction (9.7% of civilian employees), Accommodation & food services (9.7% of civilian employees). 69.1% of workers work in Wicomico County and 5.2% of all workers work at home. 68.2% of workers are employees of private companies, which is 15.1% greater than the rate of 57.9% across the entire state of Maryland.
Whole page based on the data from 2000 / 2022 when the population of Mardela Springs, Maryland was 364 / 533
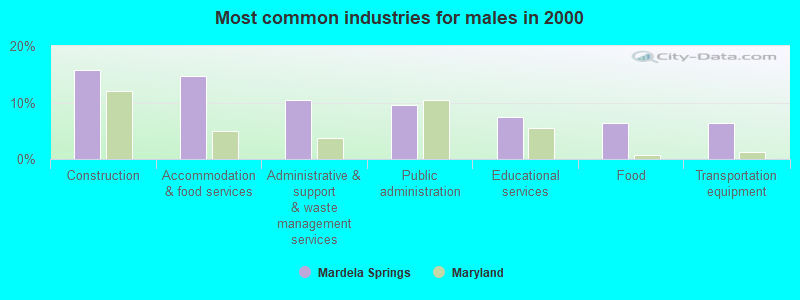
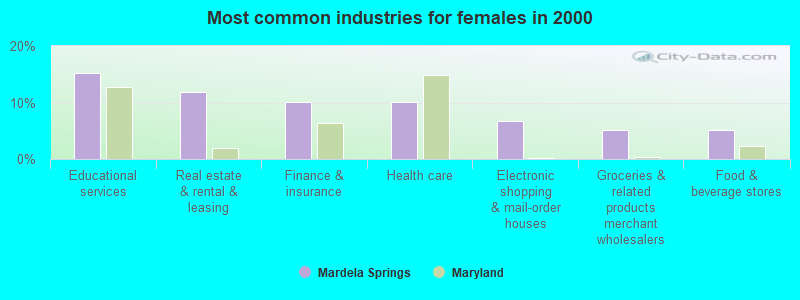
Most common industries
Most common industries
Industry
All
Males
Females
Educational services
10.4% (16)
7.4% (7)
15.3% (9)
Construction
9.7% (15)
15.8% (15)
0.0% (0)
Accommodation and food services
9.7% (15)
14.7% (14)
1.7% (1)
Administrative and support and waste management services
7.8% (12)
10.5% (10)
3.4% (2)
Public administration
7.1% (11)
9.5% (9)
3.4% (2)
Health care
6.5% (10)
4.2% (4)
10.2% (6)
Food
4.5% (7)
6.3% (6)
1.7% (1)
Real estate and rental and leasing
4.5% (7)
0.0% (0)
11.9% (7)
Transportation equipment
3.9% (6)
6.3% (6)
0.0% (0)
Finance and insurance
3.9% (6)
0.0% (0)
10.2% (6)
Motor vehicle and parts dealers
3.2% (5)
3.2% (3)
3.4% (2)
Groceries and related products merchant wholesalers
3.2% (5)
2.1% (2)
5.1% (3)
Repair and maintenance
3.2% (5)
5.3% (5)
0.0% (0)
Machinery
2.6% (4)
2.1% (2)
3.4% (2)
Electronic shopping and mail-order houses
2.6% (4)
0.0% (0)
6.8% (4)
Utilities
2.6% (4)
2.1% (2)
3.4% (2)
Truck transportation
1.9% (3)
2.1% (2)
1.7% (1)
Food and beverage stores
1.9% (3)
0.0% (0)
5.1% (3)
Clothing and accessories, including shoe, stores
1.9% (3)
0.0% (0)
5.1% (3)
Miscellaneous manufacturing
1.3% (2)
2.1% (2)
0.0% (0)
Furniture and home furnishing merchant wholesalers
1.3% (2)
2.1% (2)
0.0% (0)
Pharmacies and drug stores
1.3% (2)
0.0% (0)
3.4% (2)
Other direct selling establishments
1.3% (2)
2.1% (2)
0.0% (0)
U. S. Postal service
1.3% (2)
2.1% (2)
0.0% (0)
Private households
1.3% (2)
0.0% (0)
3.4% (2)
Building material and garden equipment and supplies dealers
0.6% (1)
0.0% (0)
1.7% (1)
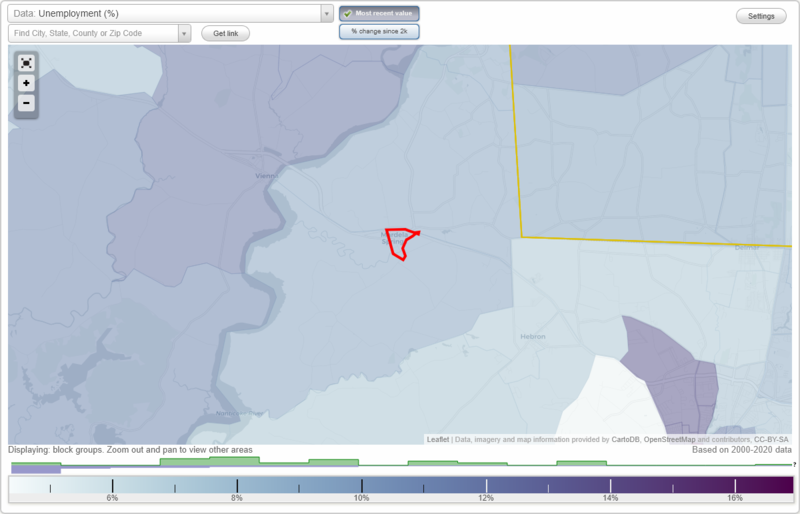
Unemployment in Mardela Springs
Unemployment by race in 2022
Unemployment rate for White non-Hispanic residents
3.8%Females
Unemployment rate for Black residents
19.7%Females
Unemployment by race in 2000
Unemployment rate for White non-Hispanic residents
2.4%Males
8.5%Females
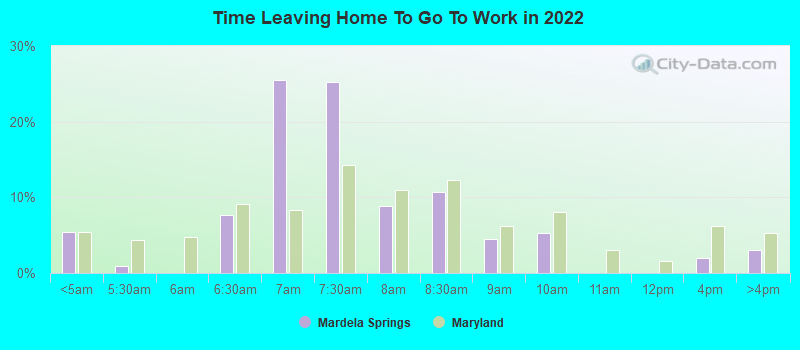
Time leaving home to go to work
12:00 a.m. to 4:59 a.m.:
Mardela Springs:
5.4% (12)
Maryland:
5.4% (137,252)
5:00 a.m. to 5:29 a.m.:
Mardela Springs:
0.9% (2)
Maryland:
4.4% (112,169)
6:00 a.m. to 6:29 a.m.:
Mardela Springs:
7.7% (17)
Maryland:
9.1% (231,673)
6:30 a.m. to 6:59 a.m.:
Mardela Springs:
25.5% (58)
Maryland:
8.3% (211,777)
7:00 a.m. to 7:29 a.m.:
Mardela Springs:
25.2% (57)
Maryland:
14.3% (362,787)
7:30 a.m. to 7:59 a.m.:
Mardela Springs:
8.9% (20)
Maryland:
10.9% (277,831)
8:00 a.m. to 8:29 a.m.:
Mardela Springs:
10.7% (24)
Maryland:
12.2% (310,633)
8:30 a.m. to 8:59 a.m.:
Mardela Springs:
4.5% (10)
Maryland:
6.2% (157,490)
9:00 a.m. to 9:59 a.m.:
Mardela Springs:
5.3% (12)
Maryland:
8.0% (204,415)
12:00 p.m. to 3:59 p.m.:
Mardela Springs:
2.0% (5)
Maryland:
6.3% (159,318)
4:00 p.m. to 11:59 p.m.:
Mardela Springs:
3.0% (7)
Maryland:
5.3% (135,542)
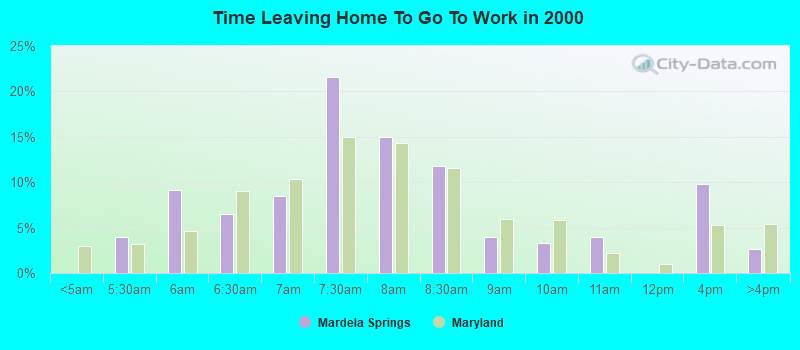
5:30am:
Mardela Springs:
3.9% (6)
Maryland:
3.2% (81,972)
6am:
Mardela Springs:
9.2% (14)
Maryland:
4.7% (120,768)
6:30am:
Mardela Springs:
6.5% (10)
Maryland:
9.1% (235,203)
7am:
Mardela Springs:
8.5% (13)
Maryland:
10.3% (267,702)
7:30am:
Mardela Springs:
21.6% (33)
Maryland:
14.9% (386,941)
8am:
Mardela Springs:
15.0% (23)
Maryland:
14.3% (370,838)
8:30am:
Mardela Springs:
11.8% (18)
Maryland:
11.6% (300,061)
9am:
Mardela Springs:
3.9% (6)
Maryland:
6.0% (154,337)
10am:
Mardela Springs:
3.3% (5)
Maryland:
5.9% (151,747)
11am:
Mardela Springs:
3.9% (6)
Maryland:
2.2% (56,218)
4pm:
Mardela Springs:
9.8% (15)
Maryland:
5.3% (136,187)
>4pm:
Mardela Springs:
2.6% (4)
Maryland:
5.4% (139,172)
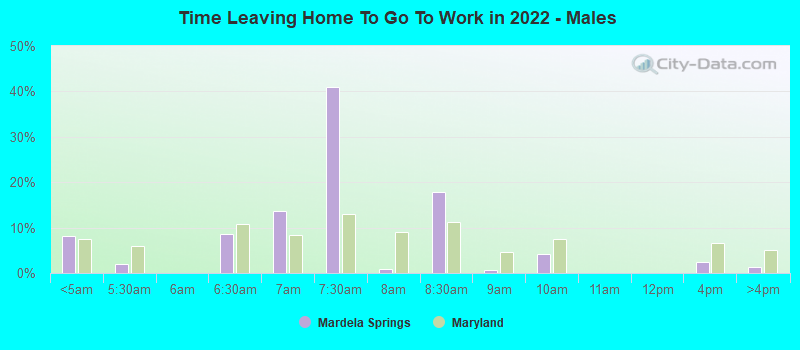
12:00 a.m. to 4:59 a.m. - Males:
Mardela Springs:
8.1% (10)
Maryland:
7.5% (99,701)
5:00 a.m. to 5:29 a.m. - Males:
Mardela Springs:
2.0% (3)
Maryland:
5.9% (79,059)
6:00 a.m. to 6:29 a.m. - Males:
Mardela Springs:
8.6% (11)
Maryland:
10.9% (145,135)
6:30 a.m. to 6:59 a.m. - Males:
Mardela Springs:
13.7% (18)
Maryland:
8.3% (110,674)
7:00 a.m. to 7:29 a.m. - Males:
Mardela Springs:
40.9% (53)
Maryland:
13.0% (173,935)
7:30 a.m. to 7:59 a.m. - Males:
Mardela Springs:
0.9% (1)
Maryland:
9.1% (121,963)
8:00 a.m. to 8:29 a.m. - Males:
Mardela Springs:
17.7% (23)
Maryland:
11.3% (150,709)
8:30 a.m. to 8:59 a.m. - Males:
Mardela Springs:
0.8% (1)
Maryland:
4.7% (62,260)
9:00 a.m. to 9:59 a.m. - Males:
Mardela Springs:
4.2% (5)
Maryland:
7.6% (101,199)
12:00 p.m. to 3:59 p.m. - Males:
Mardela Springs:
2.4% (3)
Maryland:
6.5% (86,966)
4:00 p.m. to 11:59 p.m. - Males:
Mardela Springs:
1.3% (2)
Maryland:
5.1% (68,188)
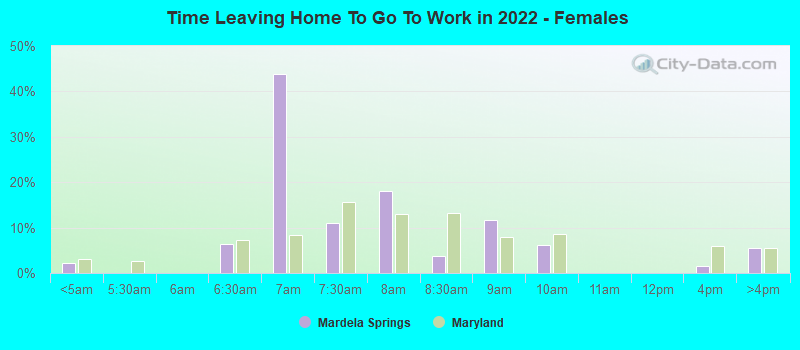
12:00 a.m. to 4:59 a.m. - Females:
Mardela Springs:
2.2% (2)
Maryland:
3.1% (37,551)
6:00 a.m. to 6:29 a.m. - Females:
Mardela Springs:
6.5% (6)
Maryland:
7.2% (86,538)
6:30 a.m. to 6:59 a.m. - Females:
Mardela Springs:
43.8% (43)
Maryland:
8.4% (101,103)
7:00 a.m. to 7:29 a.m. - Females:
Mardela Springs:
11.0% (11)
Maryland:
15.7% (188,852)
7:30 a.m. to 7:59 a.m. - Females:
Mardela Springs:
18.0% (18)
Maryland:
12.9% (155,868)
8:00 a.m. to 8:29 a.m. - Females:
Mardela Springs:
3.7% (4)
Maryland:
13.3% (159,924)
8:30 a.m. to 8:59 a.m. - Females:
Mardela Springs:
11.8% (12)
Maryland:
7.9% (95,230)
9:00 a.m. to 9:59 a.m. - Females:
Mardela Springs:
6.1% (6)
Maryland:
8.6% (103,216)
12:00 p.m. to 3:59 p.m. - Females:
Mardela Springs:
1.6% (2)
Maryland:
6.0% (72,352)
4:00 p.m. to 11:59 p.m. - Females:
Mardela Springs:
5.5% (5)
Maryland:
5.6% (67,354)
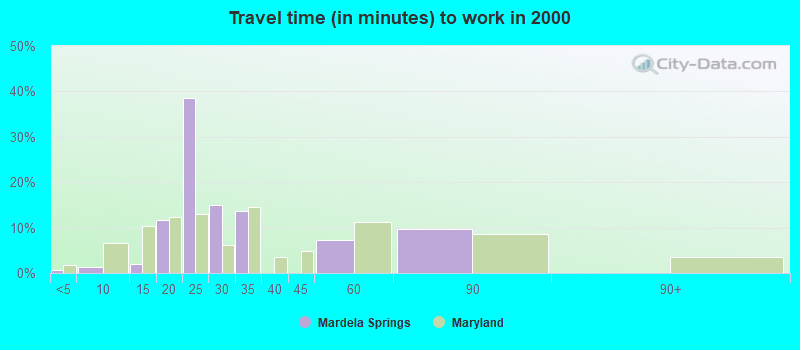
Travel time to work
Percentage of workers working in this county: 69.1% Number of people working at home: 12 (5.2% of all workers)
Less than 5 minutes:
Mardela Springs:
0.7% (1)
Maryland:
1.8% (47,843)
5 to 9 minutes:
Mardela Springs:
1.3% (2)
Maryland:
6.6% (169,884)
10 to 14 minutes:
Mardela Springs:
2.0% (3)
Maryland:
10.5% (271,204)
15 to 19 minutes:
Mardela Springs:
11.8% (18)
Maryland:
12.4% (320,679)
20 to 24 minutes:
Mardela Springs:
38.6% (59)
Maryland:
13.0% (337,452)
25 to 29 minutes:
Mardela Springs:
15.0% (23)
Maryland:
6.1% (158,702)
30 to 34 minutes:
Mardela Springs:
13.7% (21)
Maryland:
14.5% (375,140)
45 to 59 minutes:
Mardela Springs:
7.2% (11)
Maryland:
11.3% (291,586)
60 to 89 minutes:
Mardela Springs:
9.8% (15)
Maryland:
8.6% (223,613)
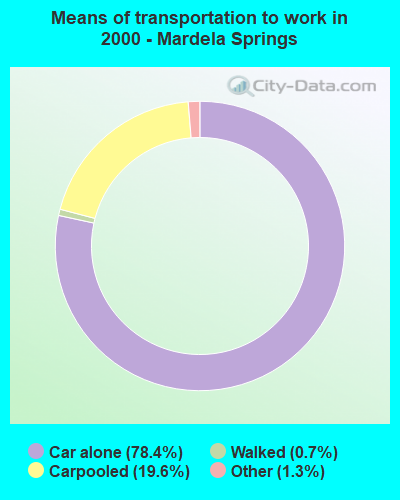
Means of transportation to work
Drove car alone:
Mardela Springs:
78.4% (120)
Maryland:
73.7% (1,910,917)
Carpooled:
Mardela Springs:
19.6% (30)
Maryland:
12.4% (320,992)
Walked:
Mardela Springs:
0.7% (1)
Maryland:
2.5% (64,852)
Other means:
Mardela Springs:
1.3% (2)
Maryland:
0.6% (14,621)
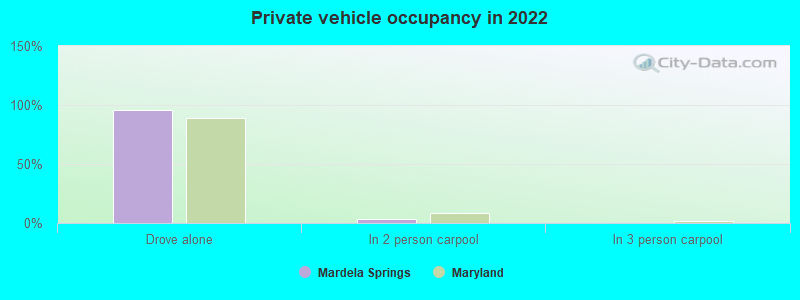
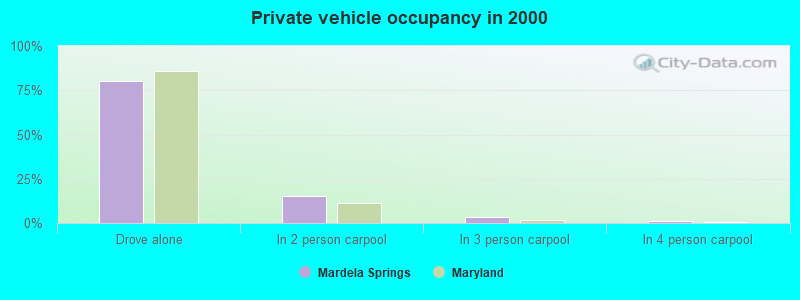
Private vehicle occupancy
Drove alone:
Mardela Springs:
96.2% (200)
Maryland:
89.2% (2,046,832)
In 2 person carpool:
Mardela Springs:
3.4% (7)
Maryland:
8.2% (188,419)
Drove alone:
Mardela Springs:
80.0% (120)
Maryland:
85.6% (1,910,917)
In 2 person carpool:
Mardela Springs:
15.3% (23)
Maryland:
11.2% (249,591)
In 3 person carpool:
Mardela Springs:
3.3% (5)
Maryland:
1.9% (43,068)
In 4 person carpool:
Mardela Springs:
1.3% (2)
Maryland:
0.7% (15,540)
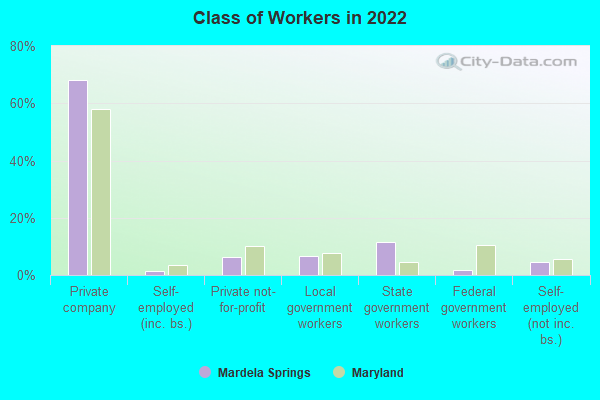
Class of workers
Employee of private company:
Mardela Springs:
68.2% (176)
Maryland:
57.9% (1,834,766)
Self-employed in own incorporated business:
Mardela Springs:
1.2% (3)
Maryland:
3.6% (114,186)
Private not-for-profit wage and salary workers:
Mardela Springs:
6.2% (16)
Maryland:
10.1% (321,165)
Local government workers:
Mardela Springs:
6.6% (17)
Maryland:
7.7% (243,652)
State government workers:
Mardela Springs:
11.6% (30)
Maryland:
4.5% (142,830)
Federal government workers:
Mardela Springs:
1.7% (4)
Maryland:
10.5% (333,930)
Self-employed workers in own not incorporated business:
Mardela Springs:
4.5% (12)
Maryland:
5.4% (171,588)
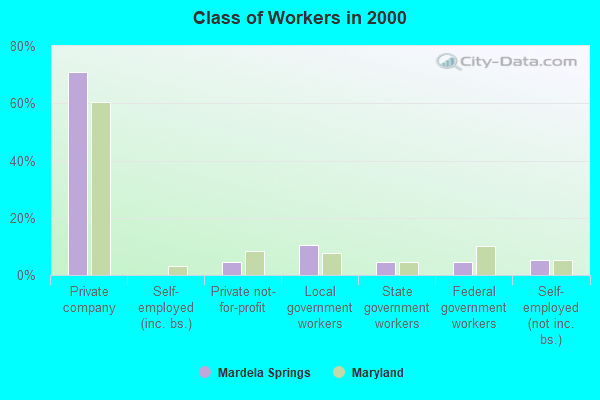
Employee of private company:
Mardela Springs:
70.8% (109)
Maryland:
60.5% (1,579,238)
Private not-for-profit wage and salary workers:
Mardela Springs:
4.5% (7)
Maryland:
8.4% (219,162)
Local government workers:
Mardela Springs:
10.4% (16)
Maryland:
7.9% (204,895)
State government workers:
Mardela Springs:
4.5% (7)
Maryland:
4.4% (114,670)
Federal government workers:
Mardela Springs:
4.5% (7)
Maryland:
10.0% (262,046)
Self-employed workers in own not incorporated business:
Mardela Springs:
5.2% (8)
Maryland:
5.4% (140,769)
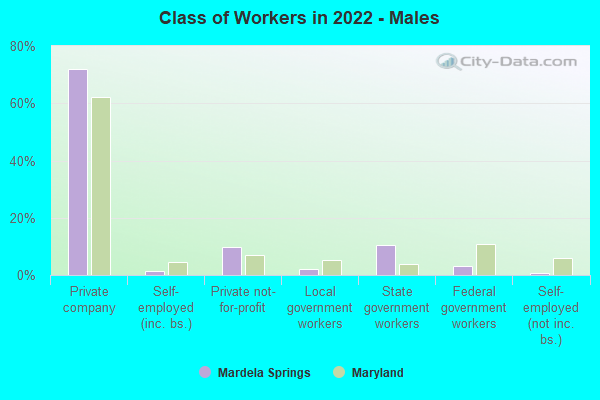
Employee of private company - Males:
Mardela Springs:
72.0% (102)
Maryland:
62.1% (1,004,780)
Self-employed in own incorporated business - Males:
Mardela Springs:
1.5% (2)
Maryland:
4.6% (73,780)
Private not-for-profit wage and salary workers - Males:
Mardela Springs:
9.8% (14)
Maryland:
7.2% (115,680)
Local government workers - Males:
Mardela Springs:
2.3% (3)
Maryland:
5.3% (85,832)
State government workers - Males:
Mardela Springs:
10.6% (15)
Maryland:
3.8% (61,646)
Federal government workers - Males:
Mardela Springs:
3.0% (4)
Maryland:
10.8% (174,115)
Self-employed workers in own not incorporated business - Males:
Mardela Springs:
0.8% (1)
Maryland:
6.0% (97,677)
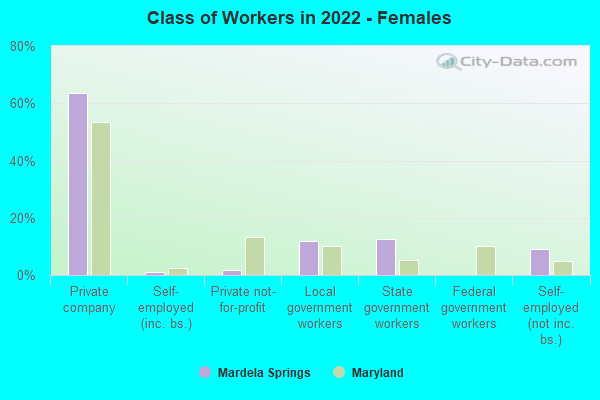
Employee of private company - Females:
Mardela Springs:
63.6% (75)
Maryland:
53.5% (829,986)
Self-employed in own incorporated business - Females:
Mardela Springs:
0.9% (1)
Maryland:
2.6% (40,406)
Private not-for-profit wage and salary workers - Females:
Mardela Springs:
1.8% (2)
Maryland:
13.2% (205,485)
Local government workers - Females:
Mardela Springs:
11.8% (14)
Maryland:
10.2% (157,820)
State government workers - Females:
Mardela Springs:
12.7% (15)
Maryland:
5.2% (81,184)
Self-employed workers in own not incorporated business - Females:
Mardela Springs:
9.1% (11)
Maryland:
4.8% (73,911)
Discuss Mardela Springs, Maryland (MD) on our hugely popular Maryland forum.