Latest news about work in Moore, TX collected exclusively by city-data.com from local newspapers, TV, and radio stations
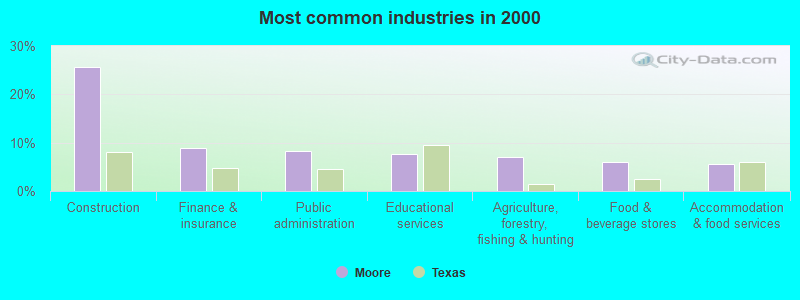
The most common industries in Moore are: Construction (25.7% of civilian employees), Finance & insurance (9.0% of civilian employees), Public administration (8.3% of civilian employees). 100.0% of workers work in Frio County. 71.0% of workers are employees of private companies, which is 2.0% greater than the rate of 69.6% across the entire state of Texas.
Whole page based on the data from 2000 / 2022 when the population of Moore, Texas was 644 / 96
Most common industries
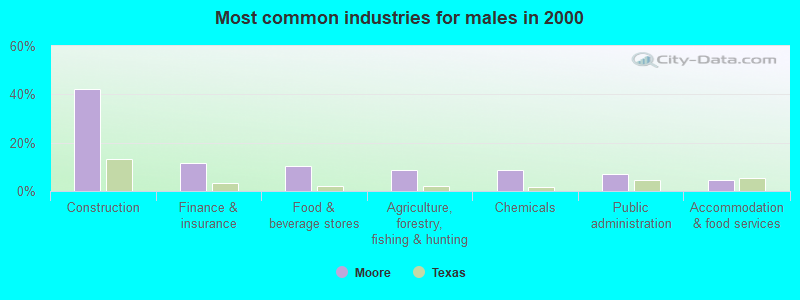
Most common industries
Industry
All
Males
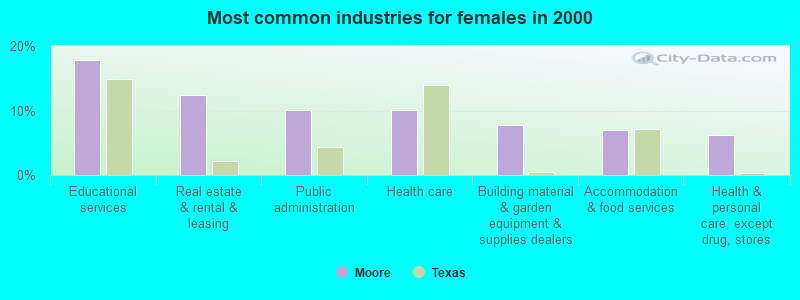
Females
Construction
25.7% (77)
42.1% (72)
3.9% (5)
Finance and insurance
9.0% (27)
11.7% (20)
5.4% (7)
Public administration
8.3% (25)
7.0% (12)
10.1% (13)
Educational services
7.7% (23)
0.0% (0)
17.8% (23)
Agriculture, forestry, fishing and hunting
7.0% (21)
8.8% (15)
4.7% (6)
Food and beverage stores
6.0% (18)
10.5% (18)
0.0% (0)
Accommodation and food services
5.7% (17)
4.7% (8)
7.0% (9)
Real estate and rental and leasing
5.3% (16)
0.0% (0)
12.4% (16)
Chemicals
5.0% (15)
8.8% (15)
0.0% (0)
Health care
4.3% (13)
0.0% (0)
10.1% (13)
Building material and garden equipment and supplies dealers
3.3% (10)
0.0% (0)
7.8% (10)
Health and personal care, except drug, stores
2.7% (8)
0.0% (0)
6.2% (8)
Farm supplies merchant wholesalers
2.0% (6)
0.0% (0)
4.7% (6)
Utilities
2.0% (6)
3.5% (6)
0.0% (0)
Social assistance
2.0% (6)
0.0% (0)
4.7% (6)
Motor vehicles, parts and supplies merchant wholesalers
1.7% (5)
2.9% (5)
0.0% (0)
Professional and commercial equipment and supplies merchant wholesalers
1.3% (4)
0.0% (0)
3.1% (4)
Transportation equipment
1.0% (3)
0.0% (0)
2.3% (3)
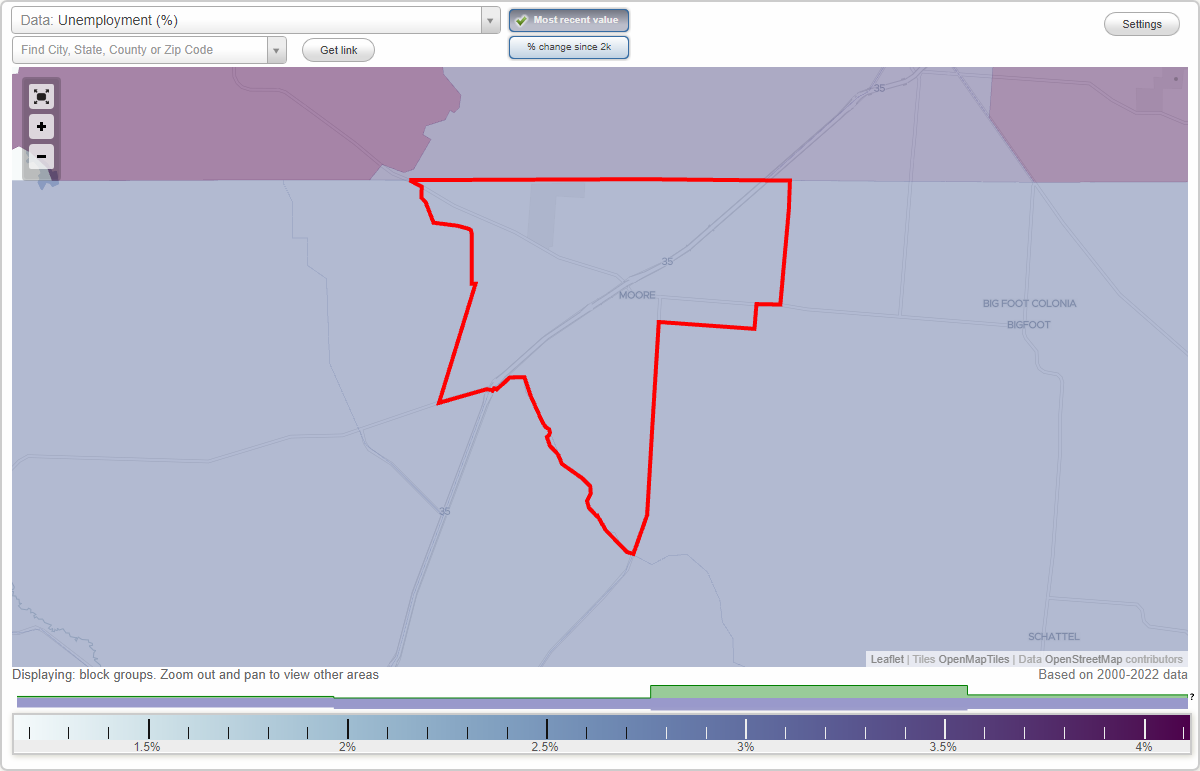
Unemployment in Moore
Unemployment by race in 2022
Unemployment rate for Black residents
100.0%Females
Unemployment by race in 2000
Unemployment rate for White non-Hispanic residents
23.0%Females
Unemployment rate for other race residents
33.3%Males
Unemployment rate for Hispanic or Latino residents
3.7%Males
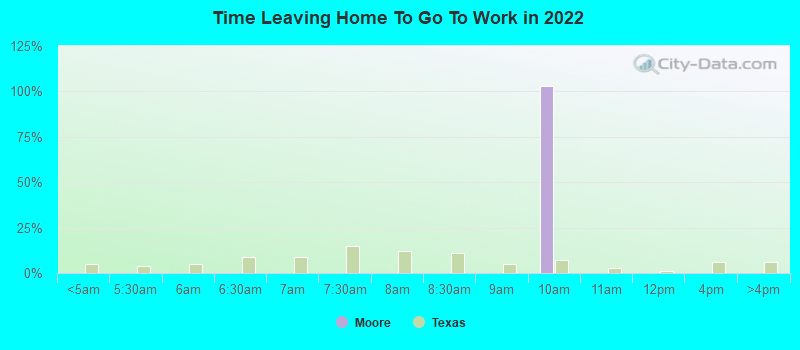
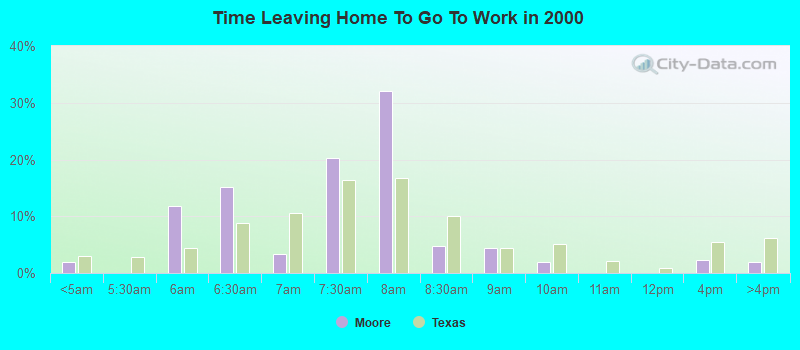
Time leaving home to go to work
9:00 a.m. to 9:59 a.m.:
Moore:
102.7% (5)
Texas:
6.7% (829,367)
<5am:
Moore:
2.0% (6)
Texas:
3.1% (281,361)
6am:
Moore:
11.8% (35)
Texas:
4.4% (403,423)
6:30am:
Moore:
15.2% (45)
Texas:
8.8% (808,876)
7am:
Moore:
3.4% (10)
Texas:
10.7% (976,557)
7:30am:
Moore:
20.2% (60)
Texas:
16.4% (1,500,904)
8am:
Moore:
32.0% (95)
Texas:
16.8% (1,536,308)
8:30am:
Moore:
4.7% (14)
Texas:
10.0% (913,601)
9am:
Moore:
4.4% (13)
Texas:
4.4% (398,656)
10am:
Moore:
2.0% (6)
Texas:
5.2% (472,592)
4pm:
Moore:
2.4% (7)
Texas:
5.5% (503,565)
>4pm:
Moore:
2.0% (6)
Texas:
6.1% (563,107)
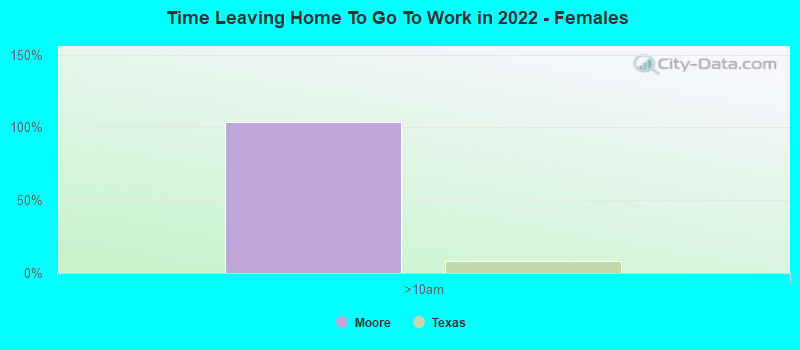
9:00 a.m. to 9:59 a.m. - Females:
Moore:
104.1% (5)
Texas:
7.8% (428,296)
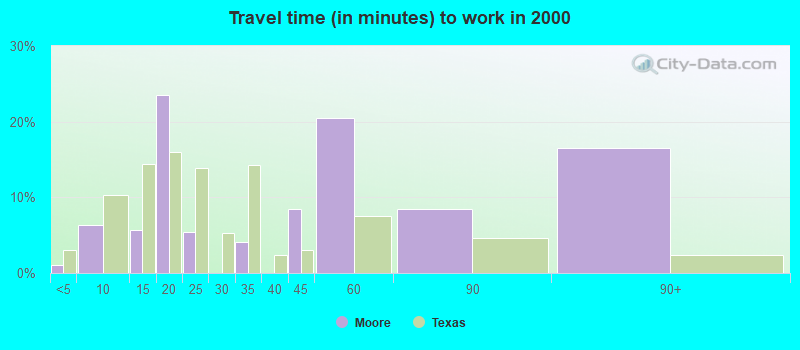
Travel time to work
Percentage of workers working in this county: 100.0%
Less than 5 minutes:
Moore:
1.0% (3)
Texas:
3.0% (277,642)
5 to 9 minutes:
Moore:
6.4% (19)
Texas:
10.3% (942,891)
10 to 14 minutes:
Moore:
5.7% (17)
Texas:
14.4% (1,317,555)
15 to 19 minutes:
Moore:
23.6% (70)
Texas:
16.0% (1,467,945)
20 to 24 minutes:
Moore:
5.4% (16)
Texas:
13.9% (1,276,781)
30 to 34 minutes:
Moore:
4.0% (12)
Texas:
14.3% (1,309,699)
40 to 44 minutes:
Moore:
8.4% (25)
Texas:
3.1% (280,916)
45 to 59 minutes:
Moore:
20.5% (61)
Texas:
7.6% (692,006)
60 to 89 minutes:
Moore:
8.4% (25)
Texas:
4.6% (418,905)
90 or more minutes:
Moore:
16.5% (49)
Texas:
2.4% (218,800)
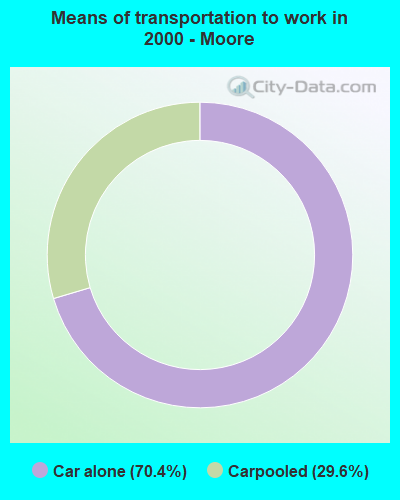
Means of transportation to work
Drove car alone:
Moore:
70.4% (209)
Texas:
77.7% (7,115,590)
Carpooled:
Moore:
29.6% (88)
Texas:
14.5% (1,326,012)
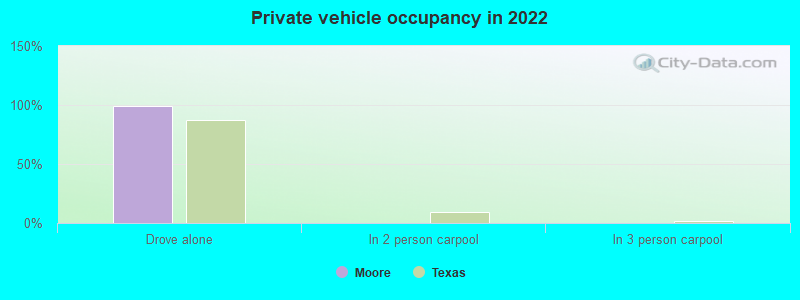
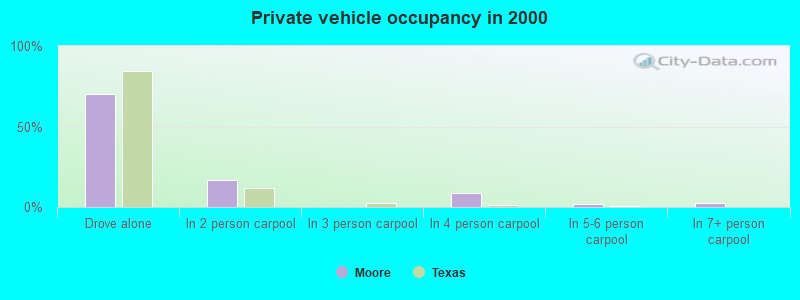
Private vehicle occupancy
Drove alone:
Moore:
99.0% (5)
Texas:
87.6% (10,283,021)
Drove alone:
Moore:
70.4% (209)
Texas:
84.3% (7,115,590)
In 2 person carpool:
Moore:
16.8% (50)
Texas:
11.6% (982,994)
In 4 person carpool:
Moore:
8.4% (25)
Texas:
1.0% (83,518)
In 5-6 person carpool:
Moore:
2.0% (6)
Texas:
0.5% (40,662)
In 7+ person carpool:
Moore:
2.4% (7)
Texas:
0.2% (17,236)
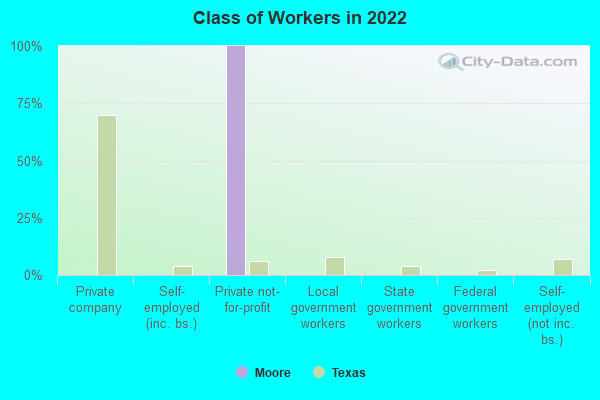
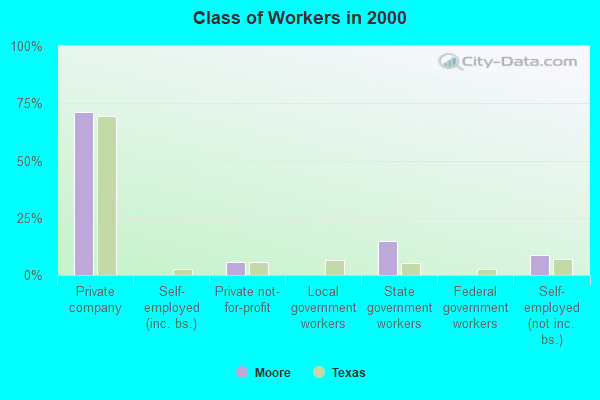
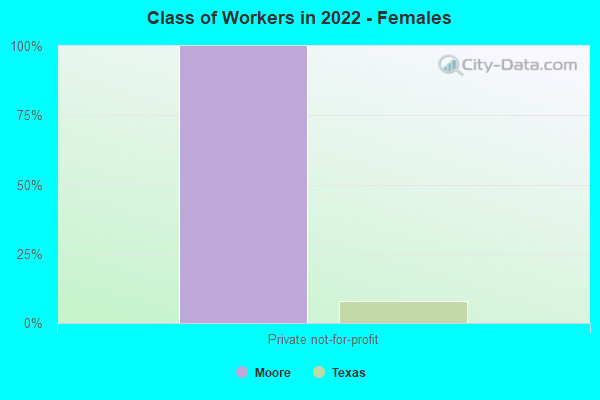
Class of workers
Private not-for-profit wage and salary workers:
Moore:
100.0% (5)
Texas:
6.0% (870,454)
Employee of private company:
Moore:
71.0% (213)
Texas:
69.6% (6,425,274)
Private not-for-profit wage and salary workers:
Moore:
5.7% (17)
Texas:
5.7% (526,631)
State government workers:
Moore:
14.7% (44)
Texas:
5.4% (501,082)
Self-employed workers in own not incorporated business:
Moore:
8.7% (26)
Texas:
7.1% (653,527)
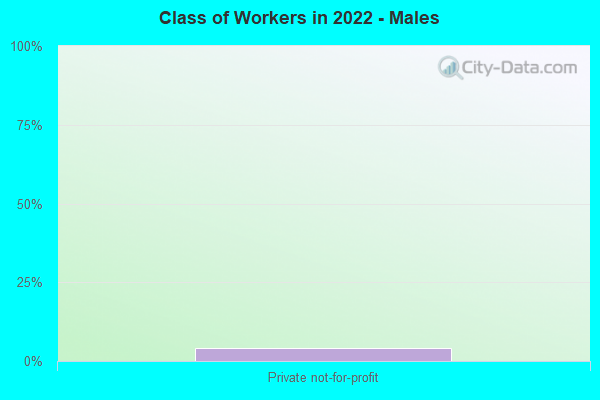
Private not-for-profit wage and salary workers - Females:
Moore:
100.0% (5)
Texas:
8.2% (546,978)
Discuss Moore, Texas (TX) on our hugely popular Texas forum.