Work and Jobs in Nevada, Texas (TX) Detailed Stats
Occupations, Industries, Unemployment, Workers, Commute
Settings
X


Recent posts about work in Nevada, Texas on our local forum with over 2,400,000 registered users:
 | Dallas is losing Tech Jobs (103 replies) |
| Is it me or is finding a job here really hard? (202 replies) |
| Low wages in El Paso or just a bad time to look for work? (9 replies) |
| Houston's economic diversity Thread .. (1244 replies) |
| How are jobs in corpus area (8 replies) |
| Considering Denton, TX for graduate school (47 replies) |
Latest news about work in Nevada, TX collected exclusively by city-data.com from local newspapers, TV, and radio stations
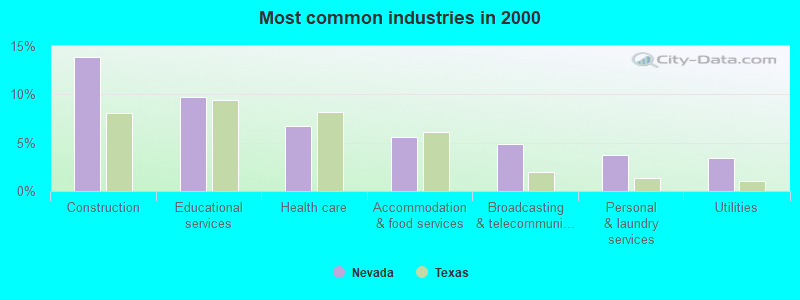
The most common industries in Nevada are: Construction (13.9% of civilian employees), Educational services (9.7% of civilian employees), Health care (6.7% of civilian employees). 61.3% of workers work in Collin County and 20.5% of all workers work at home. 68.9% of workers are employees of private companies, which is about the same as the rate of 69.6% across the entire state of Texas.
Whole page based on the data from 2000 / 2022 when the population of Nevada, Texas was 563 / 1,486
Whole page based on the data from 2000 / 2022 when the population of Nevada, Texas was 563 / 1,486
Most common industries
Most common industries | |||
|---|---|---|---|
Industry | All | Males | Females |
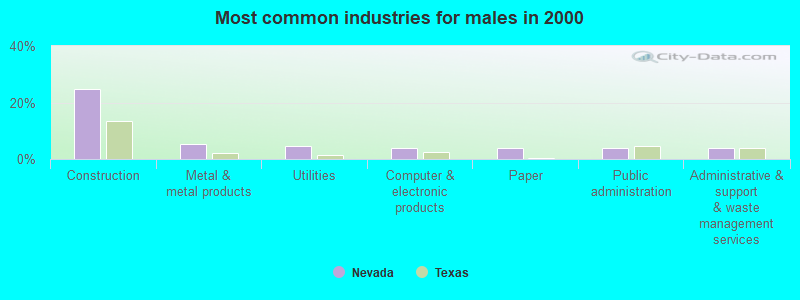
| Construction | 13.9% (37) | 24.8% (37) | 0.0% (0) |
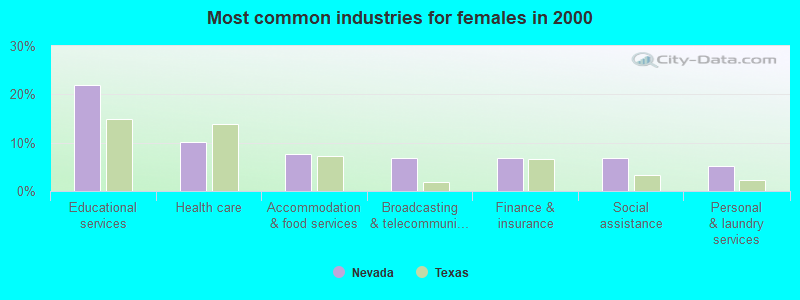
| Educational services | 9.7% (26) | 0.0% (0) | 22.0% (26) |
| Health care | 6.7% (18) | 4.0% (6) | 10.2% (12) |
| Accommodation and food services | 5.6% (15) | 4.0% (6) | 7.6% (9) |
| Broadcasting and telecommunications | 4.9% (13) | 3.4% (5) | 6.8% (8) |
| Personal and laundry services | 3.7% (10) | 2.7% (4) | 5.1% (6) |
| Utilities | 3.4% (9) | 4.7% (7) | 1.7% (2) |
| Finance and insurance | 3.0% (8) | 0.0% (0) | 6.8% (8) |
| Computer and electronic products | 3.0% (8) | 4.0% (6) | 1.7% (2) |
| Public administration | 3.0% (8) | 4.0% (6) | 1.7% (2) |
| Metal and metal products | 3.0% (8) | 5.4% (8) | 0.0% (0) |
| Social assistance | 3.0% (8) | 0.0% (0) | 6.8% (8) |
| Building material and garden equipment and supplies dealers | 2.6% (7) | 2.7% (4) | 2.5% (3) |
| Transportation equipment | 2.6% (7) | 2.7% (4) | 2.5% (3) |
| Administrative and support and waste management services | 2.6% (7) | 4.0% (6) | 0.8% (1) |
| Repair and maintenance | 2.6% (7) | 3.4% (5) | 1.7% (2) |
| Paper | 2.2% (6) | 4.0% (6) | 0.0% (0) |
| Other transportation, and support activities, and couriers | 2.2% (6) | 2.7% (4) | 1.7% (2) |
| Agriculture, forestry, fishing and hunting | 1.9% (5) | 3.4% (5) | 0.0% (0) |
| Radio, TV, and computer stores | 1.9% (5) | 1.3% (2) | 2.5% (3) |
| Recyclable material merchant wholesalers | 1.9% (5) | 3.4% (5) | 0.0% (0) |
| Sporting goods, camera, and hobby and toy stores | 1.9% (5) | 2.0% (3) | 1.7% (2) |
| Professional, scientific, and technical services | 1.9% (5) | 1.3% (2) | 2.5% (3) |
| Printing and related support activities | 1.5% (4) | 2.7% (4) | 0.0% (0) |
| Department and other general merchandise stores | 1.5% (4) | 2.0% (3) | 0.8% (1) |
| Electronic shopping and mail-order houses | 1.1% (3) | 0.0% (0) | 2.5% (3) |
| Food and beverage stores | 1.1% (3) | 0.0% (0) | 2.5% (3) |
| Clothing and accessories, including shoe, stores | 1.1% (3) | 0.0% (0) | 2.5% (3) |
| Private households | 1.1% (3) | 0.0% (0) | 2.5% (3) |
| Other direct selling establishments | 0.7% (2) | 1.3% (2) | 0.0% (0) |
| Nonmetallic mineral products | 0.7% (2) | 1.3% (2) | 0.0% (0) |
| Miscellaneous nondurable goods merchant wholesalers | 0.7% (2) | 1.3% (2) | 0.0% (0) |
| Motor vehicle and parts dealers | 0.7% (2) | 1.3% (2) | 0.0% (0) |
| Electrical and electronic goods merchant wholesalers | 0.7% (2) | 0.0% (0) | 1.7% (2) |
| Office supplies and stationery stores | 0.7% (2) | 1.3% (2) | 0.0% (0) |
| Health and personal care, except drug, stores | 0.4% (1) | 0.7% (1) | 0.0% (0) |
| Petroleum and petroleum products merchant wholesalers | 0.4% (1) | 0.0% (0) | 0.8% (1) |
Unemployment in Nevada
- Unemployment by race in 2022
- Unemployment rate for White non-Hispanic residents
- 0.4%Males
- 1.8%Females
- Unemployment rate for Black residents
- 39.3%Females
- Unemployment rate for Asian residents
- 73.9%Females
- Unemployment by race in 2000
- Unemployment rate for White non-Hispanic residents
- 2.4%Males
- 2.9%Females
- Unemployment rate for Hispanic or Latino residents
- 50.0%Females
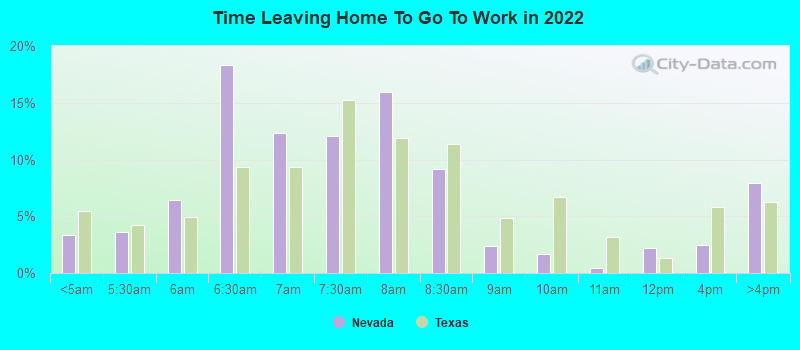
Time leaving home to go to work
12:00 a.m. to 4:59 a.m.:
| Nevada: | 3.3% (17) |
| Texas: | 5.5% (678,264) |
5:00 a.m. to 5:29 a.m.:
| Nevada: | 3.6% (18) |
| Texas: | 4.3% (525,841) |
5:30 a.m. to 5:59 a.m.:
| Nevada: | 6.4% (33) |
| Texas: | 4.9% (603,953) |
6:00 a.m. to 6:29 a.m.:
| Nevada: | 18.3% (94) |
| Texas: | 9.4% (1,155,020) |
6:30 a.m. to 6:59 a.m.:
| Nevada: | 12.4% (63) |
| Texas: | 9.3% (1,152,822) |
7:00 a.m. to 7:29 a.m.:
| Nevada: | 12.0% (62) |
| Texas: | 15.3% (1,885,477) |
7:30 a.m. to 7:59 a.m.:
| Nevada: | 15.9% (82) |
| Texas: | 11.9% (1,469,628) |
8:00 a.m. to 8:29 a.m.:
| Nevada: | 9.2% (47) |
| Texas: | 11.3% (1,400,175) |
8:30 a.m. to 8:59 a.m.:
| Nevada: | 2.4% (12) |
| Texas: | 4.9% (599,574) |
9:00 a.m. to 9:59 a.m.:
| Nevada: | 1.7% (9) |
| Texas: | 6.7% (829,367) |
10:00 a.m. to 10:59 a.m.:
| Nevada: | 0.4% (2) |
| Texas: | 3.2% (390,354) |
11:00 a.m. to 11:59 a.m.:
| Nevada: | 2.2% (11) |
| Texas: | 1.3% (162,330) |
12:00 p.m. to 3:59 p.m.:
| Nevada: | 2.5% (13) |
| Texas: | 5.8% (720,594) |
4:00 p.m. to 11:59 p.m.:
| Nevada: | 7.9% (41) |
| Texas: | 6.3% (777,072) |
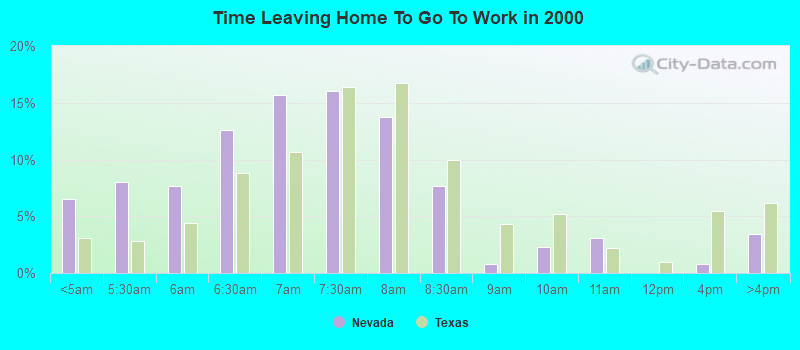
<5am:
| Nevada: | 6.5% (17) |
| Texas: | 3.1% (281,361) |
5:30am:
| Nevada: | 8.0% (21) |
| Texas: | 2.9% (262,060) |
6am:
| Nevada: | 7.6% (20) |
| Texas: | 4.4% (403,423) |
6:30am:
| Nevada: | 12.6% (33) |
| Texas: | 8.8% (808,876) |
7am:
| Nevada: | 15.6% (41) |
| Texas: | 10.7% (976,557) |
7:30am:
| Nevada: | 16.0% (42) |
| Texas: | 16.4% (1,500,904) |
8am:
| Nevada: | 13.7% (36) |
| Texas: | 16.8% (1,536,308) |
8:30am:
| Nevada: | 7.6% (20) |
| Texas: | 10.0% (913,601) |
9am:
| Nevada: | 0.8% (2) |
| Texas: | 4.4% (398,656) |
10am:
| Nevada: | 2.3% (6) |
| Texas: | 5.2% (472,592) |
11am:
| Nevada: | 3.1% (8) |
| Texas: | 2.2% (197,844) |
4pm:
| Nevada: | 0.8% (2) |
| Texas: | 5.5% (503,565) |
>4pm:
| Nevada: | 3.4% (9) |
| Texas: | 6.1% (563,107) |
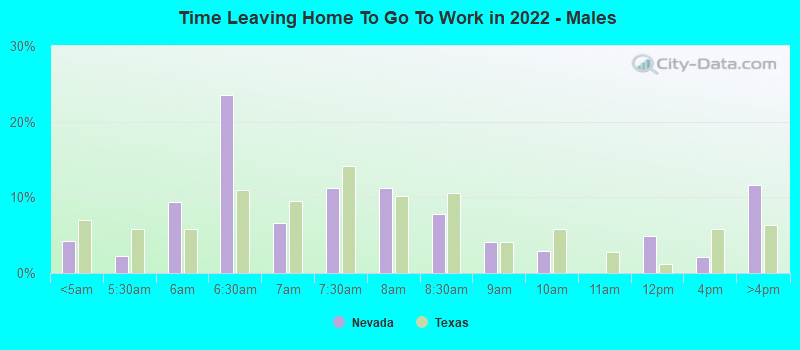
12:00 a.m. to 4:59 a.m. - Males:
| Nevada: | 4.3% (13) |
| Texas: | 7.0% (477,284) |
5:00 a.m. to 5:29 a.m. - Males:
| Nevada: | 2.2% (7) |
| Texas: | 5.8% (394,876) |
5:30 a.m. to 5:59 a.m. - Males:
| Nevada: | 9.4% (29) |
| Texas: | 5.9% (402,788) |
6:00 a.m. to 6:29 a.m. - Males:
| Nevada: | 23.5% (71) |
| Texas: | 10.9% (751,118) |
6:30 a.m. to 6:59 a.m. - Males:
| Nevada: | 6.7% (20) |
| Texas: | 9.5% (652,306) |
7:00 a.m. to 7:29 a.m. - Males:
| Nevada: | 11.3% (34) |
| Texas: | 14.1% (970,598) |
7:30 a.m. to 7:59 a.m. - Males:
| Nevada: | 11.2% (34) |
| Texas: | 10.2% (696,429) |
8:00 a.m. to 8:29 a.m. - Males:
| Nevada: | 7.8% (24) |
| Texas: | 10.6% (729,041) |
8:30 a.m. to 8:59 a.m. - Males:
| Nevada: | 4.1% (12) |
| Texas: | 4.1% (281,762) |
9:00 a.m. to 9:59 a.m. - Males:
| Nevada: | 3.0% (9) |
| Texas: | 5.8% (401,071) |
11:00 a.m. to 11:59 a.m. - Males:
| Nevada: | 4.9% (15) |
| Texas: | 1.2% (82,242) |
12:00 p.m. to 3:59 p.m. - Males:
| Nevada: | 2.1% (6) |
| Texas: | 5.8% (397,795) |
4:00 p.m. to 11:59 p.m. - Males:
| Nevada: | 11.6% (35) |
| Texas: | 6.4% (435,950) |
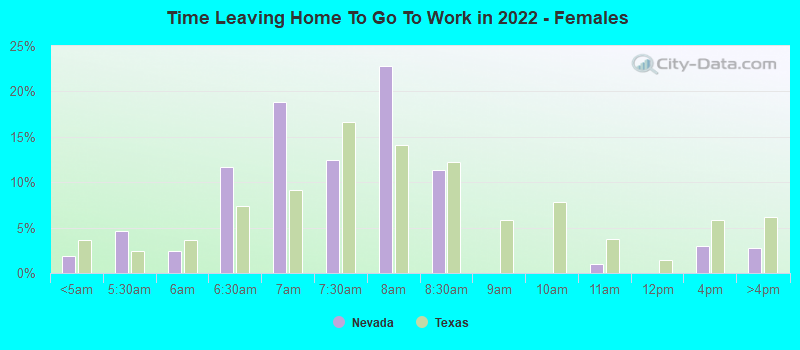
12:00 a.m. to 4:59 a.m. - Females:
| Nevada: | 1.9% (4) |
| Texas: | 3.7% (200,980) |
5:00 a.m. to 5:29 a.m. - Females:
| Nevada: | 4.6% (10) |
| Texas: | 2.4% (130,965) |
5:30 a.m. to 5:59 a.m. - Females:
| Nevada: | 2.4% (5) |
| Texas: | 3.7% (201,165) |
6:00 a.m. to 6:29 a.m. - Females:
| Nevada: | 11.7% (24) |
| Texas: | 7.4% (403,902) |
6:30 a.m. to 6:59 a.m. - Females:
| Nevada: | 18.8% (39) |
| Texas: | 9.1% (500,516) |
7:00 a.m. to 7:29 a.m. - Females:
| Nevada: | 12.5% (26) |
| Texas: | 16.7% (914,879) |
7:30 a.m. to 7:59 a.m. - Females:
| Nevada: | 22.8% (47) |
| Texas: | 14.1% (773,199) |
8:00 a.m. to 8:29 a.m. - Females:
| Nevada: | 11.4% (24) |
| Texas: | 12.2% (671,134) |
10:00 a.m. to 10:59 a.m. - Females:
| Nevada: | 1.0% (2) |
| Texas: | 3.7% (203,885) |
12:00 p.m. to 3:59 p.m. - Females:
| Nevada: | 3.0% (6) |
| Texas: | 5.9% (322,799) |
4:00 p.m. to 11:59 p.m. - Females:
| Nevada: | 2.7% (6) |
| Texas: | 6.2% (341,122) |
Travel time to work
Percentage of workers working in this county: 61.3%
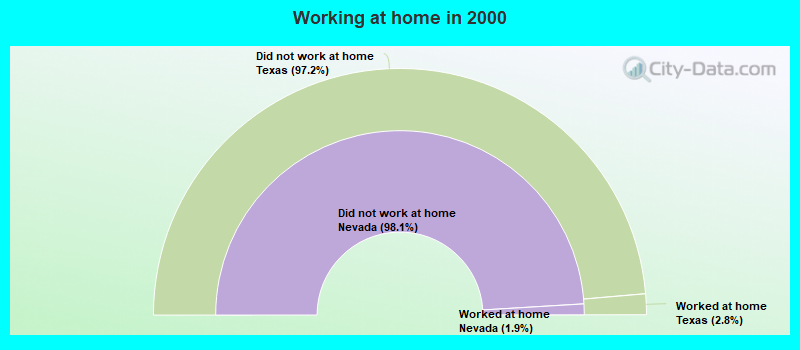
Number of people working at home: 144 (20.5% of all workers)
Number of people working at home: 144 (20.5% of all workers)
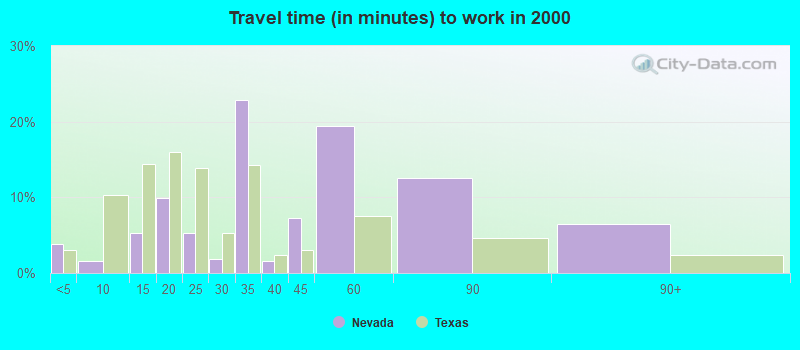
Less than 5 minutes:
| Nevada: | 3.8% (10) |
| Texas: | 3.0% (277,642) |
5 to 9 minutes:
| Nevada: | 1.5% (4) |
| Texas: | 10.3% (942,891) |
10 to 14 minutes:
| Nevada: | 5.3% (14) |
| Texas: | 14.4% (1,317,555) |
15 to 19 minutes:
| Nevada: | 9.9% (26) |
| Texas: | 16.0% (1,467,945) |
20 to 24 minutes:
| Nevada: | 5.3% (14) |
| Texas: | 13.9% (1,276,781) |
25 to 29 minutes:
| Nevada: | 1.9% (5) |
| Texas: | 5.3% (482,838) |
30 to 34 minutes:
| Nevada: | 22.9% (60) |
| Texas: | 14.3% (1,309,699) |
35 to 39 minutes:
| Nevada: | 1.5% (4) |
| Texas: | 2.4% (219,873) |
40 to 44 minutes:
| Nevada: | 7.3% (19) |
| Texas: | 3.1% (280,916) |
45 to 59 minutes:
| Nevada: | 19.5% (51) |
| Texas: | 7.6% (692,006) |
60 to 89 minutes:
| Nevada: | 12.6% (33) |
| Texas: | 4.6% (418,905) |
90 or more minutes:
| Nevada: | 6.5% (17) |
| Texas: | 2.4% (218,800) |
Means of transportation to work
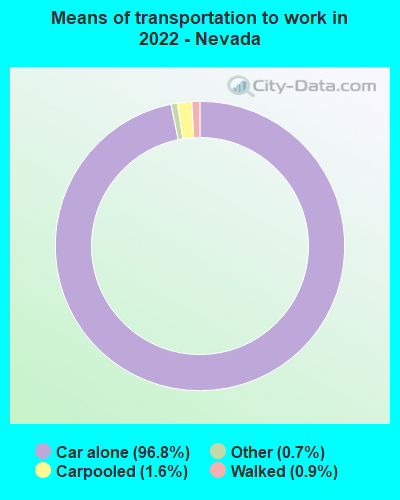

Drove car alone:
| Nevada: | 96.8% (460) |
| Texas: | 83.3% (4,557,023) |
Carpooled:
| Nevada: | 1.6% (8) |
| Texas: | 11.7% (674,818) |
Walked:
| Nevada: | 0.9% (4) |
| Texas: | 1.7% (99,911) |
Other means:
| Nevada: | 0.7% (3) |
| Texas: | 2.0% (95,481) |
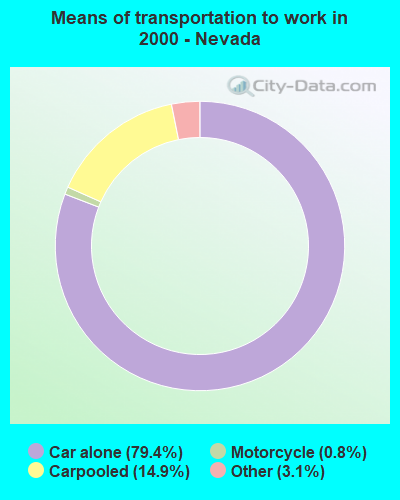

Drove car alone:
| Nevada: | 79.4% (208) |
| Texas: | 77.7% (7,115,590) |
Carpooled:
| Nevada: | 14.9% (39) |
| Texas: | 14.5% (1,326,012) |
Motorcycle:
| Nevada: | 0.8% (2) |
| Texas: | 0.1% (12,068) |
Other means:
| Nevada: | 3.1% (8) |
| Texas: | 0.9% (86,692) |
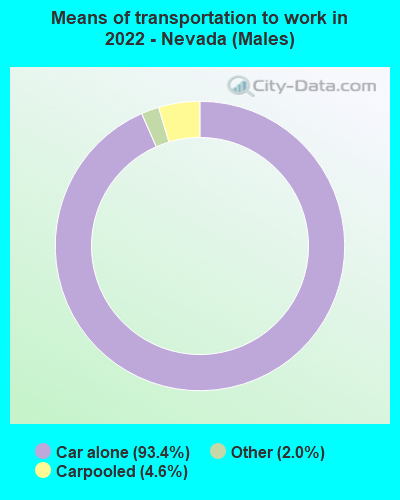

Drove car alone - Males:
| Nevada: | 93.4% (153) |
| Texas: | 83.6% (4,557,023) |
Carpooled - Males:
| Nevada: | 4.6% (8) |
| Texas: | 11.2% (674,818) |
Other means - Males:
| Nevada: | 2.0% (3) |
| Texas: | 2.2% (95,481) |
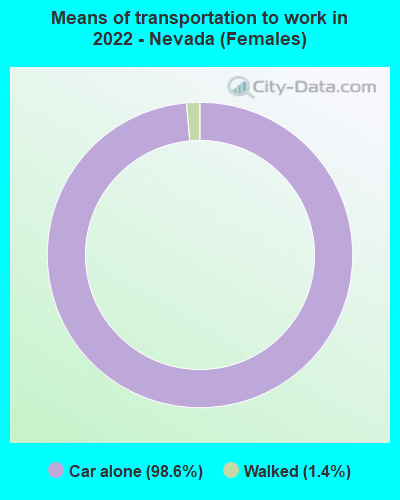

Drove car alone - Females:
| Nevada: | 98.6% (305) |
| Texas: | 83.0% (4,557,023) |
Walked - Females:
| Nevada: | 1.4% (4) |
| Texas: | 1.8% (99,911) |
Private vehicle occupancy
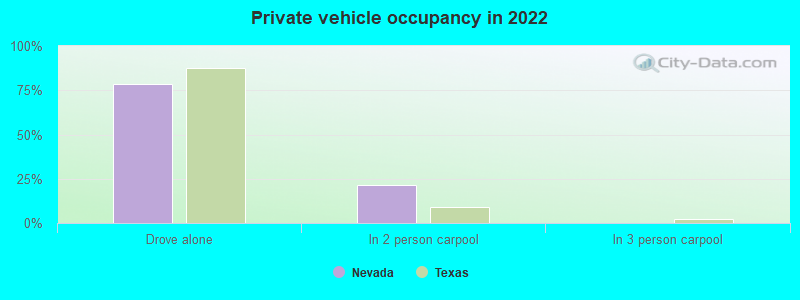
Drove alone:
| Nevada: | 78.3% (391) |
| Texas: | 87.6% (10,283,021) |
In 2 person carpool:
| Nevada: | 21.7% (108) |
| Texas: | 9.0% (1,052,595) |
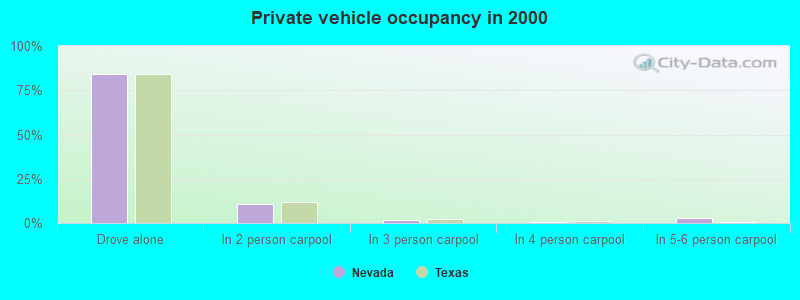
Drove alone:
| Nevada: | 84.2% (208) |
| Texas: | 84.3% (7,115,590) |
In 2 person carpool:
| Nevada: | 10.5% (26) |
| Texas: | 11.6% (982,994) |
In 3 person carpool:
| Nevada: | 1.6% (4) |
| Texas: | 2.4% (201,602) |
In 4 person carpool:
| Nevada: | 0.8% (2) |
| Texas: | 1.0% (83,518) |
In 5-6 person carpool:
| Nevada: | 2.8% (7) |
| Texas: | 0.5% (40,662) |
Class of workers
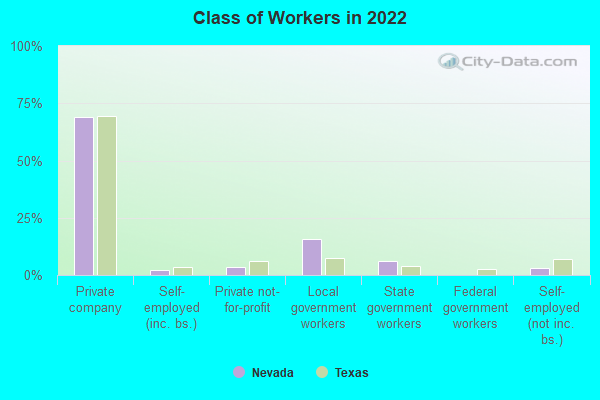
Employee of private company:
| Nevada: | 68.9% (513) |
| Texas: | 69.6% (10,139,666) |
Self-employed in own incorporated business:
| Nevada: | 2.4% (18) |
| Texas: | 3.5% (516,446) |
Private not-for-profit wage and salary workers:
| Nevada: | 3.6% (27) |
| Texas: | 6.0% (870,454) |
Local government workers:
| Nevada: | 15.8% (117) |
| Texas: | 7.6% (1,109,799) |
State government workers:
| Nevada: | 6.2% (47) |
| Texas: | 3.8% (558,618) |
Federal government workers:
| Nevada: | 0.1% (1) |
| Texas: | 2.5% (357,298) |
Self-employed workers in own not incorporated business:
| Nevada: | 3.0% (22) |
| Texas: | 6.8% (998,270) |
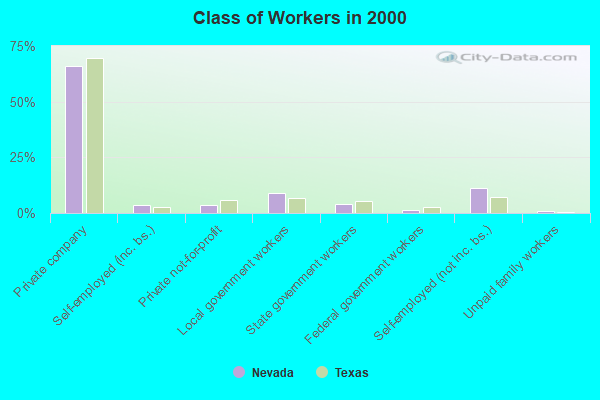
Employee of private company:
| Nevada: | 65.9% (176) |
| Texas: | 69.6% (6,425,274) |
Self-employed in own incorporated business:
| Nevada: | 3.7% (10) |
| Texas: | 2.7% (250,864) |
Private not-for-profit wage and salary workers:
| Nevada: | 3.7% (10) |
| Texas: | 5.7% (526,631) |
Local government workers:
| Nevada: | 9.0% (24) |
| Texas: | 6.6% (608,479) |
State government workers:
| Nevada: | 4.1% (11) |
| Texas: | 5.4% (501,082) |
Federal government workers:
| Nevada: | 1.5% (4) |
| Texas: | 2.6% (237,177) |
Self-employed workers in own not incorporated business:
| Nevada: | 11.2% (30) |
| Texas: | 7.1% (653,527) |
Unpaid family workers:
| Nevada: | 0.7% (2) |
| Texas: | 0.3% (31,338) |
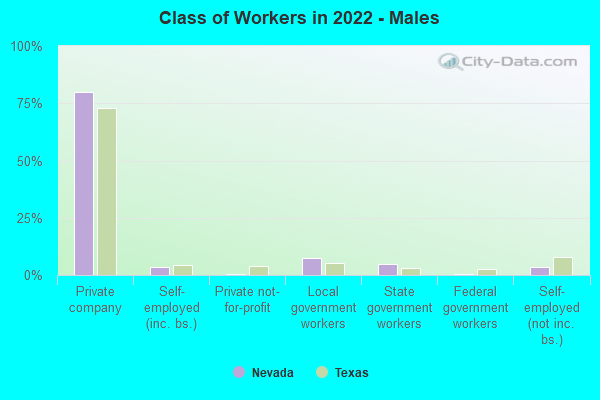
Employee of private company - Males:
| Nevada: | 79.9% (340) |
| Texas: | 73.1% (5,788,450) |
Self-employed in own incorporated business - Males:
| Nevada: | 3.4% (14) |
| Texas: | 4.2% (332,655) |
Private not-for-profit wage and salary workers - Males:
| Nevada: | 0.5% (2) |
| Texas: | 4.1% (323,476) |
Local government workers - Males:
| Nevada: | 7.6% (32) |
| Texas: | 5.1% (405,467) |
State government workers - Males:
| Nevada: | 4.9% (21) |
| Texas: | 3.0% (236,706) |
Federal government workers - Males:
| Nevada: | 0.3% (1) |
| Texas: | 2.7% (211,629) |
Self-employed workers in own not incorporated business - Males:
| Nevada: | 3.4% (14) |
| Texas: | 7.7% (609,246) |
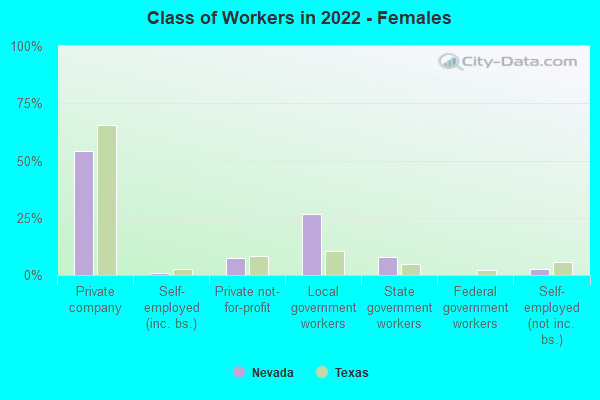
Employee of private company - Females:
| Nevada: | 54.2% (173) |
| Texas: | 65.4% (4,351,216) |
Self-employed in own incorporated business - Females:
| Nevada: | 1.0% (3) |
| Texas: | 2.8% (183,791) |
Private not-for-profit wage and salary workers - Females:
| Nevada: | 7.6% (24) |
| Texas: | 8.2% (546,978) |
Local government workers - Females:
| Nevada: | 26.7% (85) |
| Texas: | 10.6% (704,332) |
State government workers - Females:
| Nevada: | 8.0% (25) |
| Texas: | 4.8% (321,912) |
Self-employed workers in own not incorporated business - Females:
| Nevada: | 2.4% (8) |
| Texas: | 5.8% (389,024) |