Work and Jobs in Newberry-Baker, California (CA) Detailed Stats
Occupations, Industries, Unemployment, Workers, Commute
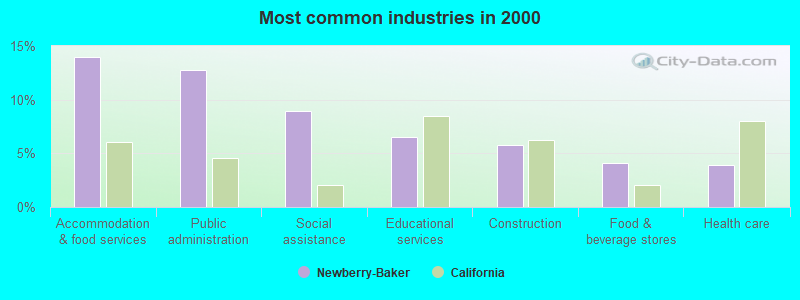
The most common industries in Newberry-Baker are: Accommodation & food services (14.0% of civilian employees), Public administration (12.7% of civilian employees), Social assistance (9.0% of civilian employees). 53.6% of workers are employees of private companies, which is 27.0% less than the rate of 68.0% across the entire state of California.
Most common industries
Most common industries | |||
|---|---|---|---|
Industry | All | Males | Females |
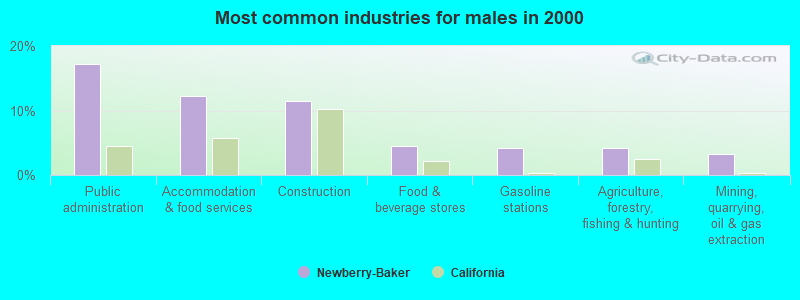
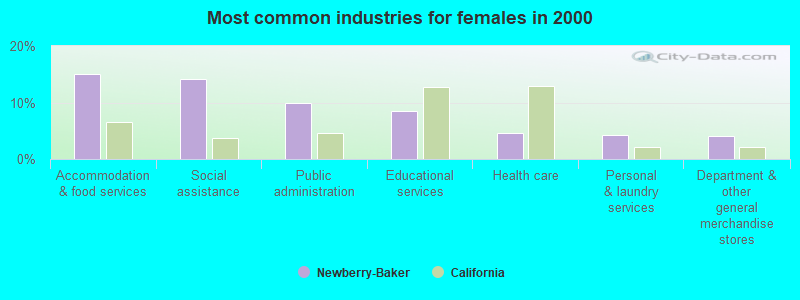
| Accommodation and food services | 14.0% (384) | 12.2% (129) | 15.1% (255) |
| Public administration | 12.7% (350) | 17.2% (182) | 9.9% (168) |
| Social assistance | 9.0% (247) | 0.6% (6) | 14.2% (241) |
| Educational services | 6.5% (179) | 3.2% (34) | 8.6% (145) |
| Construction | 5.8% (160) | 11.5% (121) | 2.3% (39) |
| Food and beverage stores | 4.1% (114) | 4.5% (47) | 4.0% (67) |
| Health care | 3.9% (108) | 2.9% (31) | 4.5% (77) |
| Professional, scientific, and technical services | 3.5% (96) | 2.7% (29) | 4.0% (67) |
| Other transportation, and support activities, and couriers | 3.2% (89) | 3.2% (34) | 3.2% (55) |
| Administrative and support and waste management services | 3.1% (84) | 2.0% (21) | 3.7% (63) |
| Gasoline stations | 3.1% (84) | 4.3% (45) | 2.3% (39) |
| Arts, entertainment, and recreation | 2.8% (76) | 2.7% (28) | 2.8% (48) |
| Personal and laundry services | 2.6% (72) | 0.0% (0) | 4.3% (72) |
| Department and other general merchandise stores | 2.5% (68) | 0.0% (0) | 4.0% (68) |
| Agriculture, forestry, fishing and hunting | 2.0% (54) | 4.2% (44) | 0.6% (10) |
| Motor vehicle and parts dealers | 1.7% (48) | 2.2% (23) | 1.5% (25) |
| Finance and insurance | 1.5% (41) | 0.8% (8) | 1.9% (33) |
| Repair and maintenance | 1.3% (36) | 2.8% (30) | 0.4% (6) |
| Mining, quarrying, and oil and gas extraction | 1.3% (35) | 3.3% (35) | 0.0% (0) |
| Transportation equipment | 1.2% (33) | 0.0% (0) | 1.9% (33) |
| Real estate and rental and leasing | 1.1% (29) | 2.0% (21) | 0.5% (8) |
| Publishing, and motion picture and sound recording industries | 1.1% (29) | 1.4% (15) | 0.8% (14) |
| Used merchandise, gift, novelty, and souvenir, and other miscellaneous stores | 0.8% (23) | 0.6% (6) | 1.0% (17) |
| U. S. Postal service | 0.8% (22) | 1.5% (16) | 0.4% (6) |
| Rail transportation | 0.8% (22) | 2.1% (22) | 0.0% (0) |
| Other direct selling establishments | 0.7% (19) | 0.9% (9) | 0.6% (10) |
| Truck transportation | 0.7% (18) | 1.7% (18) | 0.0% (0) |
| Clothing and accessories, including shoe, stores | 0.5% (15) | 0.3% (3) | 0.7% (12) |
| Chemicals | 0.5% (15) | 1.4% (15) | 0.0% (0) |
| Alcoholic beverages merchant wholesalers | 0.5% (14) | 1.3% (14) | 0.0% (0) |
| Private households | 0.5% (13) | 0.0% (0) | 0.8% (13) |
| Health and personal care, except drug, stores | 0.4% (12) | 0.0% (0) | 0.7% (12) |
| Religious, grantmaking, civic, professional, and similar organizations | 0.4% (12) | 0.6% (6) | 0.4% (6) |
| Miscellaneous manufacturing | 0.4% (11) | 1.0% (11) | 0.0% (0) |
| Groceries and related products merchant wholesalers | 0.4% (11) | 1.0% (11) | 0.0% (0) |
| Paper | 0.4% (10) | 0.9% (10) | 0.0% (0) |
| Jewelry, luggage, and leather goods stores | 0.3% (9) | 0.0% (0) | 0.5% (9) |
| Pharmacies and drug stores | 0.3% (9) | 0.0% (0) | 0.5% (9) |
| Warehousing and storage | 0.3% (9) | 0.0% (0) | 0.5% (9) |
| Utilities | 0.3% (9) | 0.0% (0) | 0.5% (9) |
| Food | 0.3% (9) | 0.0% (0) | 0.5% (9) |
| Retail florists | 0.3% (8) | 0.0% (0) | 0.5% (8) |
| Petroleum and petroleum products merchant wholesalers | 0.3% (8) | 0.8% (8) | 0.0% (0) |
| Electrical and electronic goods merchant wholesalers | 0.3% (7) | 0.0% (0) | 0.4% (7) |
| Miscellaneous nondurable goods merchant wholesalers | 0.3% (7) | 0.0% (0) | 0.4% (7) |
| Furniture and home furnishings, and household appliance stores | 0.3% (7) | 0.0% (0) | 0.4% (7) |
| Computer and electronic products | 0.2% (6) | 0.6% (6) | 0.0% (0) |
| Plastics and rubber products | 0.2% (6) | 0.6% (6) | 0.0% (0) |
| Radio, TV, and computer stores | 0.2% (6) | 0.0% (0) | 0.4% (6) |
| Furniture and related product manufacturing | 0.2% (5) | 0.5% (5) | 0.0% (0) |
| Fuel dealers | 0.1% (4) | 0.4% (4) | 0.0% (0) |
| Building material and garden equipment and supplies dealers | 0.1% (3) | 0.0% (0) | 0.2% (3) |
| Motor vehicles, parts and supplies merchant wholesalers | 0.1% (2) | 0.2% (2) | 0.0% (0) |
Unemployment in Newberry-Baker
- Unemployment by race in 2000
- Unemployment rate for White non-Hispanic residents
- 10.4%Males
- 10.0%Females
- Unemployment rate for Black residents
- 40.0%Males
- 11.8%Females
- Unemployment rate for American Indian and Alaska Native residents
- 33.3%Males
- Unemployment rate for Asian residents
- 23.1%Females
- Unemployment rate for other race residents
- 13.8%Females
- Unemployment rate for two or more race residents
- 46.2%Males
- 6.8%Females
- Unemployment rate for Hispanic or Latino residents
- 1.3%Males
- 10.2%Females
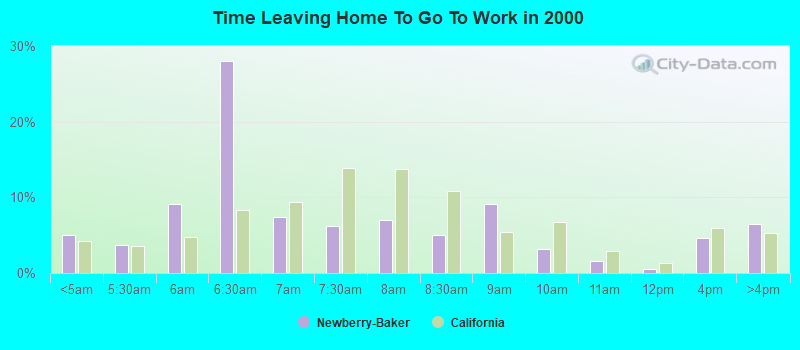
Time leaving home to go to work
<5am:
| Newberry-Baker: | 5.0% (322) |
| California: | 4.2% (606,086) |
5:30am:
| Newberry-Baker: | 3.8% (242) |
| California: | 3.6% (523,209) |
6am:
| Newberry-Baker: | 9.2% (589) |
| California: | 4.8% (692,256) |
6:30am:
| Newberry-Baker: | 28.0% (1,801) |
| California: | 8.4% (1,216,867) |
7am:
| Newberry-Baker: | 7.3% (472) |
| California: | 9.4% (1,362,830) |
7:30am:
| Newberry-Baker: | 6.2% (398) |
| California: | 13.8% (2,006,950) |
8am:
| Newberry-Baker: | 6.9% (446) |
| California: | 13.7% (1,986,831) |
8:30am:
| Newberry-Baker: | 5.0% (319) |
| California: | 10.9% (1,577,815) |
9am:
| Newberry-Baker: | 9.1% (588) |
| California: | 5.4% (778,152) |
10am:
| Newberry-Baker: | 3.2% (204) |
| California: | 6.7% (972,355) |
11am:
| Newberry-Baker: | 1.6% (100) |
| California: | 2.9% (414,479) |
12pm:
| Newberry-Baker: | 0.5% (35) |
| California: | 1.3% (189,005) |
4pm:
| Newberry-Baker: | 4.7% (301) |
| California: | 6.0% (865,284) |
>4pm:
| Newberry-Baker: | 6.4% (412) |
| California: | 5.3% (776,167) |
Travel time to work
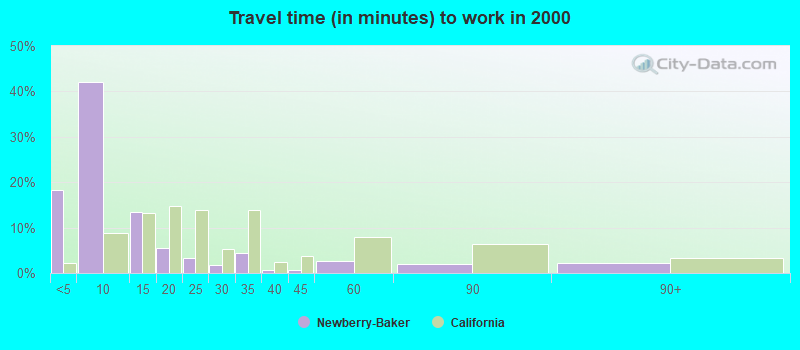
Less than 5 minutes:
| Newberry-Baker: | 18.3% (1,176) |
| California: | 2.2% (324,703) |
5 to 9 minutes:
| Newberry-Baker: | 42.1% (2,708) |
| California: | 8.8% (1,280,443) |
10 to 14 minutes:
| Newberry-Baker: | 13.5% (868) |
| California: | 13.3% (1,930,263) |
15 to 19 minutes:
| Newberry-Baker: | 5.5% (352) |
| California: | 14.9% (2,157,970) |
20 to 24 minutes:
| Newberry-Baker: | 3.3% (212) |
| California: | 13.8% (2,004,060) |
25 to 29 minutes:
| Newberry-Baker: | 1.8% (115) |
| California: | 5.4% (782,241) |
30 to 34 minutes:
| Newberry-Baker: | 4.4% (286) |
| California: | 13.9% (2,025,657) |
35 to 39 minutes:
| Newberry-Baker: | 0.6% (36) |
| California: | 2.5% (366,487) |
40 to 44 minutes:
| Newberry-Baker: | 0.6% (39) |
| California: | 3.6% (528,043) |
45 to 59 minutes:
| Newberry-Baker: | 2.6% (170) |
| California: | 7.9% (1,151,598) |
60 to 89 minutes:
| Newberry-Baker: | 2.1% (132) |
| California: | 6.4% (933,123) |
90 or more minutes:
| Newberry-Baker: | 2.1% (135) |
| California: | 3.3% (483,698) |
Means of transportation to work
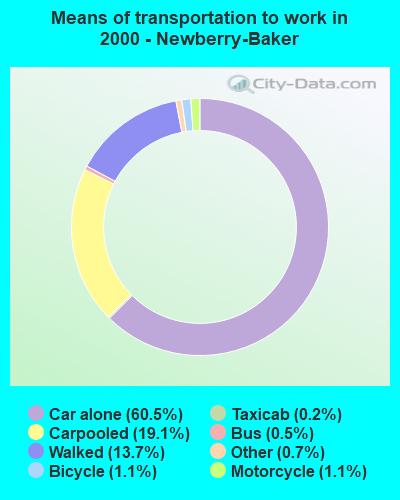

Drove car alone:
| Newberry-Baker: | 60.5% (3,888) |
| California: | 71.8% (10,432,462) |
Carpooled:
| Newberry-Baker: | 19.1% (1,229) |
| California: | 14.5% (2,113,313) |
Bus or trolley bus:
| Newberry-Baker: | 0.5% (30) |
| California: | 3.8% (549,425) |
Taxicab:
| Newberry-Baker: | 0.2% (15) |
| California: | 0.1% (9,890) |
Motorcycle:
| Newberry-Baker: | 1.1% (70) |
| California: | 0.2% (36,262) |
Bicycle:
| Newberry-Baker: | 1.1% (71) |
| California: | 0.8% (120,567) |
Walked:
| Newberry-Baker: | 13.7% (879) |
| California: | 2.9% (414,581) |
Other means:
| Newberry-Baker: | 0.7% (47) |
| California: | 0.8% (115,064) |
Private vehicle occupancy
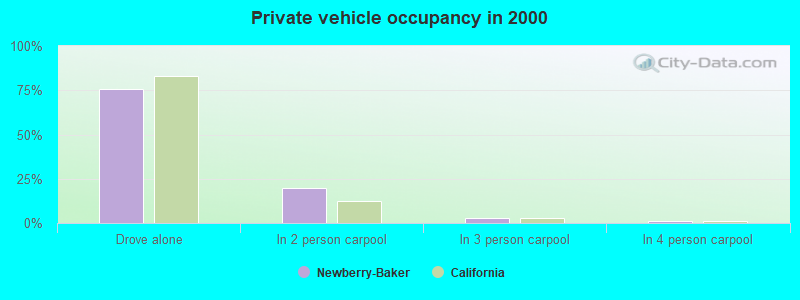
Drove alone:
| Newberry-Baker: | 76.0% (3,888) |
| California: | 83.2% (10,432,462) |
In 2 person carpool:
| Newberry-Baker: | 19.7% (1,007) |
| California: | 12.5% (1,564,905) |
In 3 person carpool:
| Newberry-Baker: | 2.9% (146) |
| California: | 2.6% (330,732) |
In 4 person carpool:
| Newberry-Baker: | 1.3% (67) |
| California: | 1.0% (119,364) |
In 5-6 person carpool:
| Newberry-Baker: | 0.1% (7) |
| California: | 0.5% (57,036) |
In 7+ person carpool:
| Newberry-Baker: | 0.0% (2) |
| California: | 0.3% (41,276) |
Class of workers
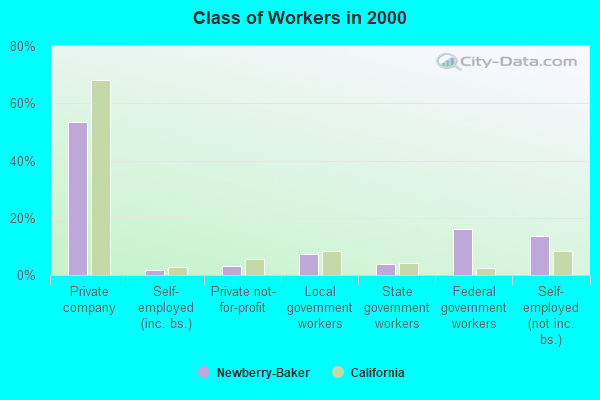
Employee of private company:
| Newberry-Baker: | 53.6% (1,473) |
| California: | 68.0% (10,009,465) |
Self-employed in own incorporated business:
| Newberry-Baker: | 1.6% (45) |
| California: | 2.7% (402,392) |
Private not-for-profit wage and salary workers:
| Newberry-Baker: | 3.3% (91) |
| California: | 5.7% (845,536) |
Local government workers:
| Newberry-Baker: | 7.3% (200) |
| California: | 8.3% (1,218,764) |
State government workers:
| Newberry-Baker: | 3.9% (108) |
| California: | 4.0% (594,953) |
Federal government workers:
| Newberry-Baker: | 16.2% (445) |
| California: | 2.3% (344,354) |
Self-employed workers in own not incorporated business:
| Newberry-Baker: | 13.7% (377) |
| California: | 8.5% (1,249,530) |
Unpaid family workers:
| Newberry-Baker: | 0.4% (11) |
| California: | 0.4% (53,934) |
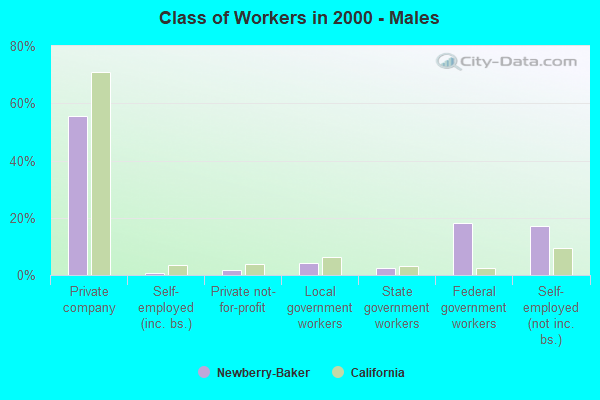
Employee of private company - Males:
| Newberry-Baker: | 55.5% (586) |
| California: | 71.1% (5,716,697) |
Self-employed in own incorporated business - Males:
| Newberry-Baker: | 0.8% (8) |
| California: | 3.6% (290,657) |
Private not-for-profit wage and salary workers - Males:
| Newberry-Baker: | 1.8% (19) |
| California: | 3.8% (303,997) |
Local government workers - Males:
| Newberry-Baker: | 4.2% (44) |
| California: | 6.2% (495,927) |
State government workers - Males:
| Newberry-Baker: | 2.4% (25) |
| California: | 3.2% (255,434) |
Federal government workers - Males:
| Newberry-Baker: | 18.2% (192) |
| California: | 2.5% (198,555) |
Self-employed workers in own not incorporated business - Males:
| Newberry-Baker: | 17.2% (182) |
| California: | 9.5% (760,853) |
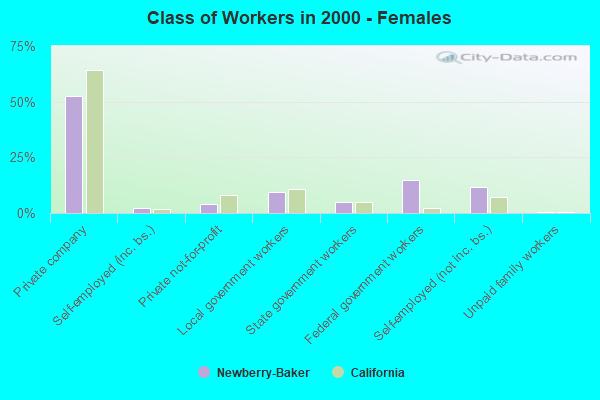
Employee of private company - Females:
| Newberry-Baker: | 52.4% (887) |
| California: | 64.3% (4,292,768) |
Self-employed in own incorporated business - Females:
| Newberry-Baker: | 2.2% (37) |
| California: | 1.7% (111,735) |
Private not-for-profit wage and salary workers - Females:
| Newberry-Baker: | 4.3% (72) |
| California: | 8.1% (541,539) |
Local government workers - Females:
| Newberry-Baker: | 9.2% (156) |
| California: | 10.8% (722,837) |
State government workers - Females:
| Newberry-Baker: | 4.9% (83) |
| California: | 5.1% (339,519) |
Federal government workers - Females:
| Newberry-Baker: | 14.9% (253) |
| California: | 2.2% (145,799) |
Self-employed workers in own not incorporated business - Females:
| Newberry-Baker: | 11.5% (195) |
| California: | 7.3% (488,677) |
Unpaid family workers - Females:
| Newberry-Baker: | 0.6% (11) |
| California: | 0.5% (30,704) |