Work and Jobs in North Aurora, Colorado (CO) Detailed Stats
Occupations, Industries, Unemployment, Workers, Commute
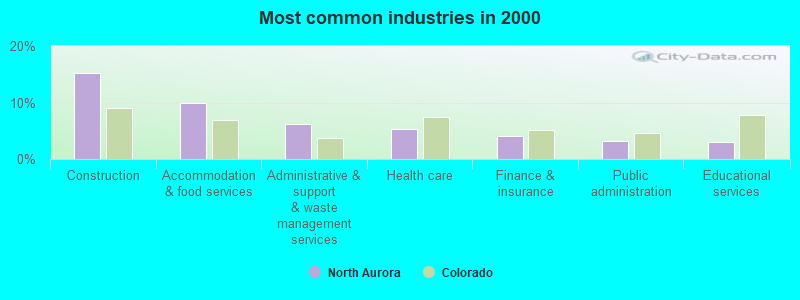
The most common industries in North Aurora are: Construction (15.2% of civilian employees), Accommodation & food services (9.9% of civilian employees), Administrative & support & waste management services (6.2% of civilian employees). 80.7% of workers are employees of private companies, which is 16.6% greater than the rate of 67.3% across the entire state of Colorado.
Most common industries
Most common industries | |||
|---|---|---|---|
Industry | All | Males | Females |
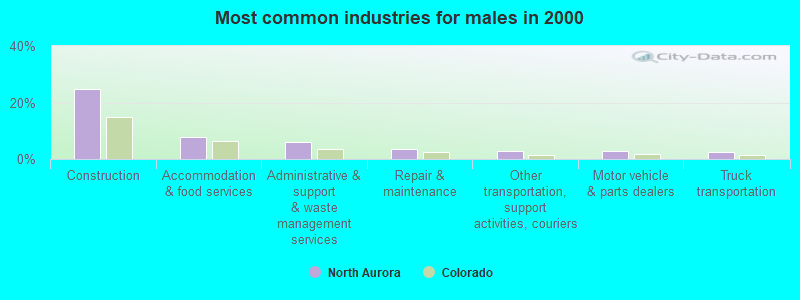
| Construction | 15.2% (2,507) | 24.8% (2,352) | 2.2% (155) |
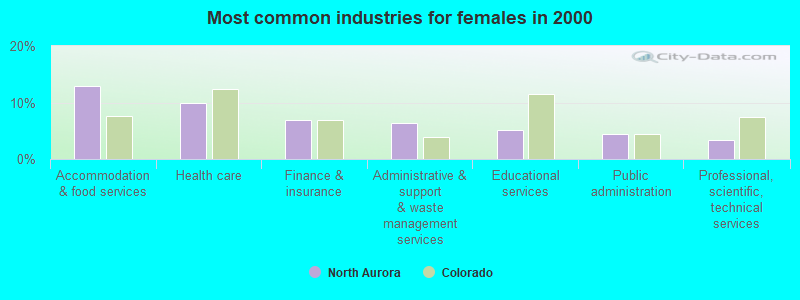
| Accommodation and food services | 9.9% (1,625) | 7.6% (724) | 12.9% (901) |
| Administrative and support and waste management services | 6.2% (1,020) | 6.1% (577) | 6.3% (443) |
| Health care | 5.3% (870) | 1.9% (183) | 9.8% (687) |
| Finance and insurance | 4.0% (662) | 1.9% (181) | 6.9% (481) |
| Public administration | 3.3% (537) | 2.4% (230) | 4.4% (307) |
| Educational services | 3.0% (498) | 1.5% (143) | 5.1% (355) |
| Professional, scientific, and technical services | 2.8% (465) | 2.5% (234) | 3.3% (231) |
| Other transportation, and support activities, and couriers | 2.6% (423) | 2.7% (258) | 2.4% (165) |
| Repair and maintenance | 2.5% (417) | 3.6% (340) | 1.1% (77) |
| Broadcasting and telecommunications | 2.5% (410) | 2.0% (191) | 3.1% (219) |
| Real estate and rental and leasing | 2.5% (409) | 2.2% (212) | 2.8% (197) |
| Food and beverage stores | 2.4% (394) | 2.0% (186) | 3.0% (208) |
| Department and other general merchandise stores | 2.1% (341) | 1.4% (128) | 3.1% (213) |
| Personal and laundry services | 1.9% (312) | 1.2% (113) | 2.9% (199) |
| Motor vehicle and parts dealers | 1.8% (290) | 2.7% (257) | 0.5% (33) |
| Truck transportation | 1.7% (287) | 2.6% (248) | 0.6% (39) |
| Air transportation | 1.6% (259) | 2.1% (200) | 0.8% (59) |
| U. S. Postal service | 1.5% (254) | 1.6% (154) | 1.4% (100) |
| Social assistance | 1.4% (227) | 0.3% (28) | 2.9% (199) |
| Miscellaneous manufacturing | 1.2% (192) | 1.3% (122) | 1.0% (70) |
| Groceries and related products merchant wholesalers | 1.1% (189) | 1.5% (140) | 0.7% (49) |
| Computer and electronic products | 1.1% (176) | 0.8% (77) | 1.4% (99) |
| Furniture and related product manufacturing | 1.1% (173) | 1.4% (135) | 0.5% (38) |
| Religious, grantmaking, civic, professional, and similar organizations | 1.0% (172) | 0.4% (40) | 1.9% (132) |
| Metal and metal products | 0.9% (155) | 1.4% (129) | 0.4% (26) |
| Food | 0.9% (154) | 1.2% (109) | 0.6% (45) |
| Printing and related support activities | 0.9% (147) | 0.9% (89) | 0.8% (58) |
| Building material and garden equipment and supplies dealers | 0.8% (136) | 1.2% (117) | 0.3% (19) |
| Arts, entertainment, and recreation | 0.8% (132) | 0.5% (46) | 1.2% (86) |
| Transportation equipment | 0.8% (128) | 0.9% (86) | 0.6% (42) |
| Used merchandise, gift, novelty, and souvenir, and other miscellaneous stores | 0.8% (126) | 0.4% (36) | 1.3% (90) |
| Data processing, libraries, and other information services | 0.7% (123) | 0.5% (45) | 1.1% (78) |
| Publishing, and motion picture and sound recording industries | 0.7% (114) | 0.8% (75) | 0.6% (39) |
| Machinery, equipment, and supplies merchant wholesalers | 0.7% (114) | 0.9% (81) | 0.5% (33) |
| Motor vehicles, parts and supplies merchant wholesalers | 0.7% (109) | 0.9% (82) | 0.4% (27) |
| Warehousing and storage | 0.7% (107) | 0.5% (51) | 0.8% (56) |
| Furniture and home furnishings, and household appliance stores | 0.6% (105) | 0.9% (90) | 0.2% (15) |
| Machinery | 0.6% (101) | 0.8% (79) | 0.3% (22) |
| Electrical and electronic goods merchant wholesalers | 0.6% (92) | 0.5% (48) | 0.6% (44) |
| Gasoline stations | 0.5% (86) | 0.4% (36) | 0.7% (50) |
| Other direct selling establishments | 0.5% (85) | 0.2% (17) | 1.0% (68) |
| Radio, TV, and computer stores | 0.5% (82) | 0.5% (44) | 0.5% (38) |
| Leather and allied products | 0.5% (80) | 0.5% (47) | 0.5% (33) |
| Nonmetallic mineral products | 0.5% (76) | 0.7% (67) | 0.1% (9) |
| Private households | 0.4% (66) | 0.1% (10) | 0.8% (56) |
| Hardware, plumbing and heating equipment, and supplies merchant wholesalers | 0.4% (64) | 0.5% (48) | 0.2% (16) |
| Paper | 0.4% (63) | 0.6% (57) | 0.1% (6) |
| Agriculture, forestry, fishing and hunting | 0.3% (56) | 0.4% (41) | 0.2% (15) |
| Electrical equipment, appliances, and components | 0.3% (54) | 0.3% (29) | 0.4% (25) |
| Plastics and rubber products | 0.3% (50) | 0.3% (25) | 0.4% (25) |
| Lumber and other construction materials merchant wholesalers | 0.3% (49) | 0.3% (33) | 0.2% (16) |
| Wood products | 0.3% (45) | 0.4% (36) | 0.1% (9) |
| Professional and commercial equipment and supplies merchant wholesalers | 0.3% (43) | 0.2% (18) | 0.4% (25) |
| Utilities | 0.2% (40) | 0.3% (30) | 0.1% (10) |
| Chemicals | 0.2% (39) | 0.3% (29) | 0.1% (10) |
| Recyclable material merchant wholesalers | 0.2% (37) | 0.4% (37) | 0.0% (0) |
| Textile mills and textile products | 0.2% (35) | 0.2% (19) | 0.2% (16) |
| Book stores and news dealers | 0.2% (33) | 0.3% (33) | 0.0% (0) |
| Alcoholic beverages merchant wholesalers | 0.2% (29) | 0.1% (5) | 0.3% (24) |
| Health and personal care, except drug, stores | 0.2% (29) | 0.1% (6) | 0.3% (23) |
| Apparel | 0.2% (27) | 0.0% (0) | 0.4% (27) |
| Paper and paper products merchant wholesalers | 0.2% (27) | 0.2% (21) | 0.1% (6) |
| Mining, quarrying, and oil and gas extraction | 0.2% (25) | 0.2% (19) | 0.1% (6) |
| Retail florists | 0.2% (25) | 0.0% (0) | 0.4% (25) |
| Furniture and home furnishing merchant wholesalers | 0.1% (23) | 0.2% (23) | 0.0% (0) |
| Drugs, sundries, and chemical and allied products merchant wholesalers | 0.1% (21) | 0.0% (0) | 0.3% (21) |
| Beverage and tobacco products | 0.1% (20) | 0.2% (20) | 0.0% (0) |
| Clothing and accessories, including shoe, stores | 0.1% (20) | 0.1% (12) | 0.1% (8) |
| Petroleum and petroleum products merchant wholesalers | 0.1% (20) | 0.0% (0) | 0.3% (20) |
| Petroleum and coal products | 0.1% (20) | 0.2% (20) | 0.0% (0) |
| Jewelry, luggage, and leather goods stores | 0.1% (19) | 0.1% (8) | 0.2% (11) |
| Miscellaneous durable goods merchant wholesalers | 0.1% (19) | 0.1% (7) | 0.2% (12) |
| Office supplies and stationery stores | 0.1% (18) | 0.1% (14) | 0.1% (4) |
| Miscellaneous nondurable goods merchant wholesalers | 0.1% (18) | 0.2% (18) | 0.0% (0) |
| Sporting goods, camera, and hobby and toy stores | 0.1% (18) | 0.1% (7) | 0.2% (11) |
| Metals and minerals, except petroleum, merchant wholesalers | 0.1% (16) | 0.2% (16) | 0.0% (0) |
Unemployment in North Aurora
- Unemployment by race in 2000
- Unemployment rate for White non-Hispanic residents
- 7.0%Males
- 4.9%Females
- Unemployment rate for Black residents
- 10.2%Males
- 9.0%Females
- Unemployment rate for American Indian and Alaska Native residents
- 27.4%Males
- 8.8%Females
- Unemployment rate for Asian residents
- 5.4%Males
- Unemployment rate for other race residents
- 7.1%Males
- 14.7%Females
- Unemployment rate for two or more race residents
- 6.2%Males
- 24.2%Females
- Unemployment rate for Hispanic or Latino residents
- 6.9%Males
- 16.1%Females
Time leaving home to go to work
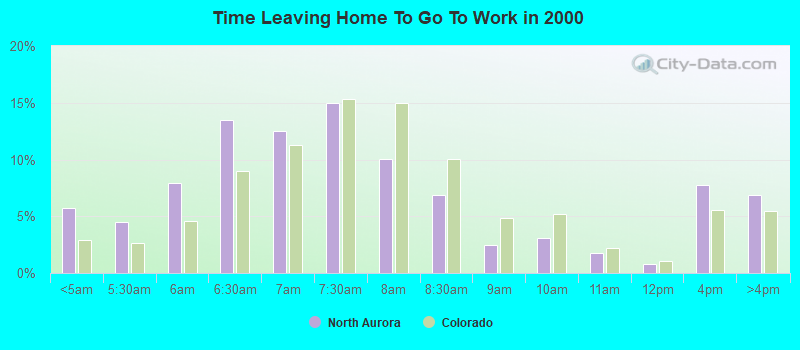
<5am:
| North Aurora: | 5.7% (924) |
| Colorado: | 2.9% (62,865) |
5:30am:
| North Aurora: | 4.5% (717) |
| Colorado: | 2.6% (57,037) |
6am:
| North Aurora: | 7.9% (1,269) |
| Colorado: | 4.6% (100,940) |
6:30am:
| North Aurora: | 13.5% (2,166) |
| Colorado: | 9.0% (197,321) |
7am:
| North Aurora: | 12.5% (2,006) |
| Colorado: | 11.3% (246,749) |
7:30am:
| North Aurora: | 15.0% (2,408) |
| Colorado: | 15.4% (336,717) |
8am:
| North Aurora: | 10.0% (1,611) |
| Colorado: | 15.0% (329,151) |
8:30am:
| North Aurora: | 6.8% (1,101) |
| Colorado: | 10.0% (219,216) |
9am:
| North Aurora: | 2.4% (393) |
| Colorado: | 4.8% (105,802) |
10am:
| North Aurora: | 3.1% (502) |
| Colorado: | 5.2% (114,870) |
11am:
| North Aurora: | 1.7% (277) |
| Colorado: | 2.2% (48,948) |
12pm:
| North Aurora: | 0.8% (134) |
| Colorado: | 1.0% (22,224) |
4pm:
| North Aurora: | 7.7% (1,240) |
| Colorado: | 5.6% (122,019) |
>4pm:
| North Aurora: | 6.9% (1,109) |
| Colorado: | 5.5% (119,635) |
Travel time to work
Less than 5 minutes:
| North Aurora: | 1.3% (212) |
| Colorado: | 3.3% (72,206) |
5 to 9 minutes:
| North Aurora: | 5.8% (940) |
| Colorado: | 10.8% (235,913) |
10 to 14 minutes:
| North Aurora: | 11.5% (1,852) |
| Colorado: | 14.5% (318,642) |
15 to 19 minutes:
| North Aurora: | 15.2% (2,449) |
| Colorado: | 15.2% (333,306) |
20 to 24 minutes:
| North Aurora: | 15.4% (2,469) |
| Colorado: | 14.3% (313,409) |
25 to 29 minutes:
| North Aurora: | 6.3% (1,008) |
| Colorado: | 5.7% (125,679) |
30 to 34 minutes:
| North Aurora: | 19.5% (3,135) |
| Colorado: | 12.8% (281,268) |
35 to 39 minutes:
| North Aurora: | 3.0% (483) |
| Colorado: | 2.6% (56,816) |
40 to 44 minutes:
| North Aurora: | 3.4% (539) |
| Colorado: | 3.3% (71,983) |
45 to 59 minutes:
| North Aurora: | 8.9% (1,429) |
| Colorado: | 6.6% (145,592) |
60 to 89 minutes:
| North Aurora: | 5.3% (849) |
| Colorado: | 3.9% (85,337) |
90 or more minutes:
| North Aurora: | 3.1% (492) |
| Colorado: | 2.0% (43,343) |
Means of transportation to work
Drove car alone:
| North Aurora: | 66.7% (10,721) |
| Colorado: | 75.1% (1,646,454) |
Carpooled:
| North Aurora: | 21.8% (3,498) |
| Colorado: | 12.2% (268,168) |
Bus or trolley bus:
| North Aurora: | 7.6% (1,227) |
| Colorado: | 3.0% (66,179) |
Streetcar or trolley car:
| North Aurora: | 0.1% (14) |
| Colorado: | 0.0% (780) |
Subway or elevated:
| North Aurora: | 0.1% (11) |
| Colorado: | 0.0% (738) |
Taxicab:
| North Aurora: | 0.0% (6) |
| Colorado: | 0.1% (1,254) |
Motorcycle:
| North Aurora: | 0.2% (35) |
| Colorado: | 0.1% (2,582) |
Bicycle:
| North Aurora: | 0.3% (43) |
| Colorado: | 0.8% (16,905) |
Walked:
| North Aurora: | 1.5% (236) |
| Colorado: | 3.0% (65,668) |
Other means:
| North Aurora: | 0.4% (66) |
| Colorado: | 0.6% (14,202) |
Private vehicle occupancy
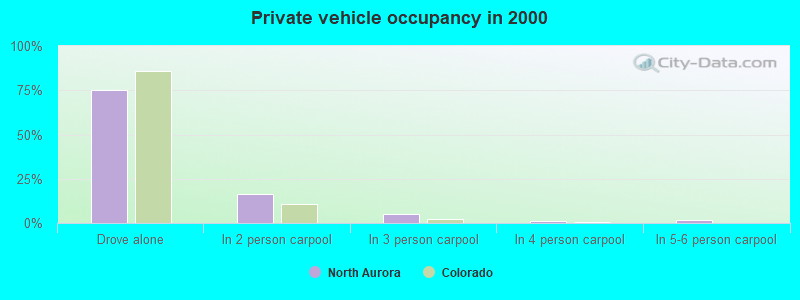
Drove alone:
| North Aurora: | 75.4% (10,721) |
| Colorado: | 86.0% (1,646,454) |
In 2 person carpool:
| North Aurora: | 16.5% (2,353) |
| Colorado: | 11.0% (210,761) |
In 3 person carpool:
| North Aurora: | 5.0% (713) |
| Colorado: | 2.0% (37,987) |
In 4 person carpool:
| North Aurora: | 1.1% (155) |
| Colorado: | 0.6% (12,167) |
In 5-6 person carpool:
| North Aurora: | 1.7% (243) |
| Colorado: | 0.3% (5,172) |
In 7+ person carpool:
| North Aurora: | 0.2% (34) |
| Colorado: | 0.1% (2,081) |
Class of workers
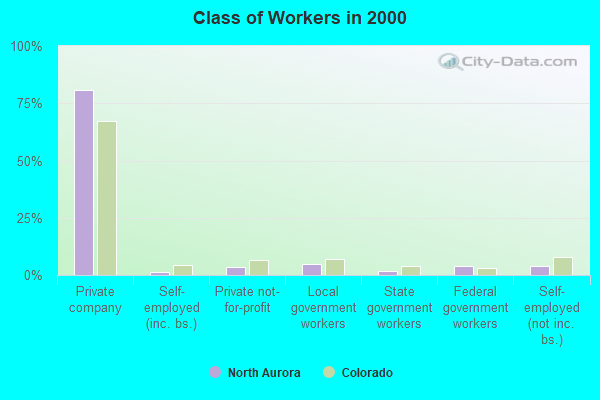
Employee of private company:
| North Aurora: | 80.7% (13,287) |
| Colorado: | 67.3% (1,485,056) |
Self-employed in own incorporated business:
| North Aurora: | 1.4% (226) |
| Colorado: | 4.4% (96,165) |
Private not-for-profit wage and salary workers:
| North Aurora: | 3.7% (605) |
| Colorado: | 6.4% (141,129) |
Local government workers:
| North Aurora: | 4.6% (761) |
| Colorado: | 6.9% (152,123) |
State government workers:
| North Aurora: | 1.6% (270) |
| Colorado: | 3.9% (85,273) |
Federal government workers:
| North Aurora: | 4.0% (660) |
| Colorado: | 3.1% (68,409) |
Self-employed workers in own not incorporated business:
| North Aurora: | 3.7% (616) |
| Colorado: | 7.7% (169,415) |
Unpaid family workers:
| North Aurora: | 0.2% (33) |
| Colorado: | 0.3% (7,624) |
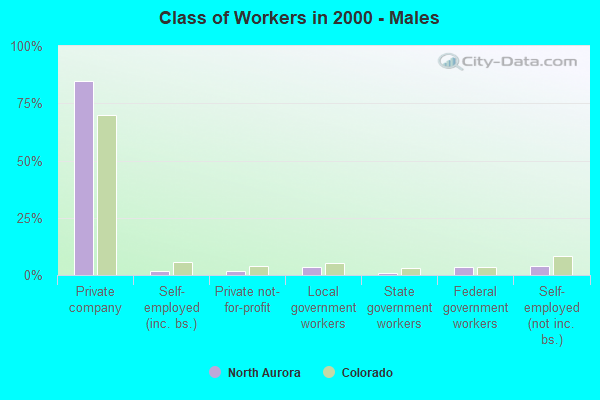
Employee of private company - Males:
| North Aurora: | 84.6% (8,018) |
| Colorado: | 70.0% (837,579) |
Self-employed in own incorporated business - Males:
| North Aurora: | 1.8% (173) |
| Colorado: | 5.7% (68,129) |
Private not-for-profit wage and salary workers - Males:
| North Aurora: | 1.7% (160) |
| Colorado: | 3.8% (45,796) |
Local government workers - Males:
| North Aurora: | 3.4% (318) |
| Colorado: | 5.4% (64,615) |
State government workers - Males:
| North Aurora: | 0.9% (84) |
| Colorado: | 3.2% (38,404) |
Federal government workers - Males:
| North Aurora: | 3.6% (339) |
| Colorado: | 3.3% (39,817) |
Self-employed workers in own not incorporated business - Males:
| North Aurora: | 3.9% (371) |
| Colorado: | 8.3% (98,982) |
Unpaid family workers - Males:
| North Aurora: | 0.2% (15) |
| Colorado: | 0.3% (3,439) |
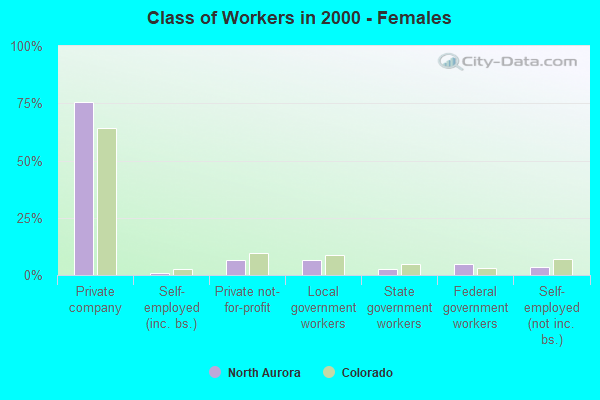
Employee of private company - Females:
| North Aurora: | 75.5% (5,269) |
| Colorado: | 64.2% (647,477) |
Self-employed in own incorporated business - Females:
| North Aurora: | 0.8% (53) |
| Colorado: | 2.8% (28,036) |
Private not-for-profit wage and salary workers - Females:
| North Aurora: | 6.4% (445) |
| Colorado: | 9.5% (95,333) |
Local government workers - Females:
| North Aurora: | 6.3% (443) |
| Colorado: | 8.7% (87,508) |
State government workers - Females:
| North Aurora: | 2.7% (186) |
| Colorado: | 4.6% (46,869) |
Federal government workers - Females:
| North Aurora: | 4.6% (321) |
| Colorado: | 2.8% (28,592) |
Self-employed workers in own not incorporated business - Females:
| North Aurora: | 3.5% (245) |
| Colorado: | 7.0% (70,433) |
Unpaid family workers - Females:
| North Aurora: | 0.3% (18) |
| Colorado: | 0.4% (4,185) |