Work and Jobs in North Kona, Hawaii (HI) Detailed Stats
Occupations, Industries, Unemployment, Workers, Commute
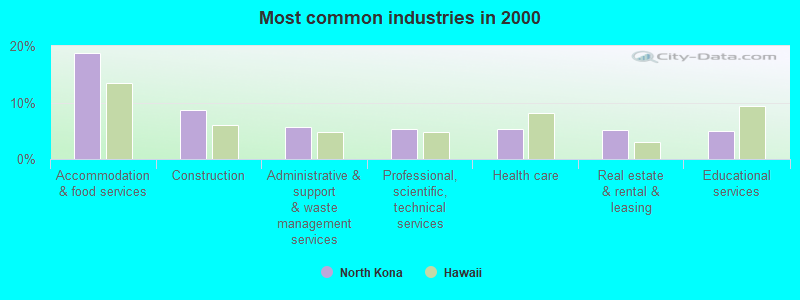
The most common industries in North Kona are: Accommodation & food services (18.7% of civilian employees), Construction (8.7% of civilian employees), Administrative & support & waste management services (5.7% of civilian employees). 66.3% of workers are employees of private companies, which is 7.9% greater than the rate of 61.1% across the entire state of Hawaii.
Most common industries
Most common industries | |||
|---|---|---|---|
Industry | All | Males | Females |
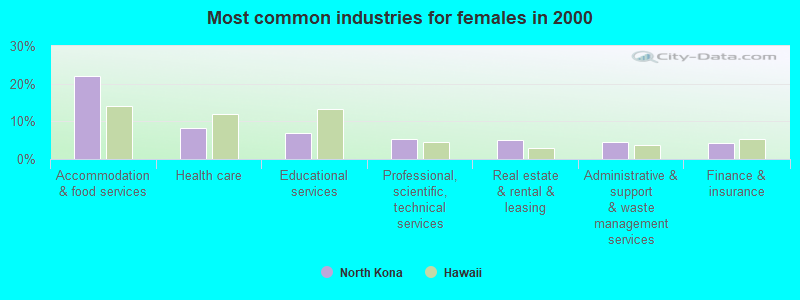
| Accommodation and food services | 18.7% (2,784) | 15.8% (1,243) | 22.0% (1,541) |
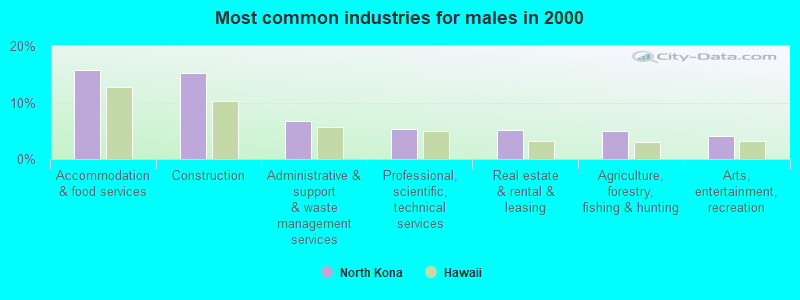
| Construction | 8.7% (1,292) | 15.2% (1,197) | 1.4% (95) |
| Administrative and support and waste management services | 5.7% (849) | 6.8% (535) | 4.5% (314) |
| Professional, scientific, and technical services | 5.4% (798) | 5.4% (424) | 5.3% (374) |
| Health care | 5.2% (780) | 2.6% (204) | 8.2% (576) |
| Real estate and rental and leasing | 5.2% (768) | 5.2% (409) | 5.1% (359) |
| Educational services | 5.0% (749) | 3.5% (273) | 6.8% (476) |
| Agriculture, forestry, fishing and hunting | 3.7% (554) | 4.9% (389) | 2.4% (165) |
| Public administration | 3.5% (520) | 3.4% (267) | 3.6% (253) |
| Arts, entertainment, and recreation | 3.4% (505) | 4.1% (326) | 2.6% (179) |
| Finance and insurance | 2.6% (389) | 1.3% (100) | 4.1% (289) |
| Department and other general merchandise stores | 2.6% (383) | 1.8% (145) | 3.4% (238) |
| Other transportation, and support activities, and couriers | 2.5% (378) | 3.0% (239) | 2.0% (139) |
| Food and beverage stores | 2.4% (352) | 2.2% (174) | 2.5% (178) |
| Air transportation | 2.3% (337) | 2.3% (180) | 2.2% (157) |
| Personal and laundry services | 1.8% (275) | 0.6% (45) | 3.3% (230) |
| Social assistance | 1.5% (229) | 0.4% (34) | 2.8% (195) |
| Used merchandise, gift, novelty, and souvenir, and other miscellaneous stores | 1.2% (186) | 1.0% (76) | 1.6% (110) |
| Clothing and accessories, including shoe, stores | 1.2% (182) | 0.6% (46) | 1.9% (136) |
| Repair and maintenance | 1.1% (168) | 1.6% (125) | 0.6% (43) |
| Motor vehicle and parts dealers | 1.1% (166) | 1.7% (135) | 0.4% (31) |
| Religious, grantmaking, civic, professional, and similar organizations | 1.0% (154) | 0.5% (42) | 1.6% (112) |
| Truck transportation | 1.0% (151) | 1.4% (112) | 0.6% (39) |
| Utilities | 0.9% (129) | 1.4% (113) | 0.2% (16) |
| Broadcasting and telecommunications | 0.8% (114) | 1.0% (79) | 0.5% (35) |
| Sporting goods, camera, and hobby and toy stores | 0.8% (113) | 0.9% (68) | 0.6% (45) |
| Food | 0.7% (105) | 0.9% (72) | 0.5% (33) |
| Publishing, and motion picture and sound recording industries | 0.7% (104) | 0.8% (62) | 0.6% (42) |
| Private households | 0.7% (98) | 0.2% (15) | 1.2% (83) |
| Gasoline stations | 0.6% (92) | 0.3% (26) | 0.9% (66) |
| Furniture and home furnishings, and household appliance stores | 0.6% (86) | 0.7% (56) | 0.4% (30) |
| Groceries and related products merchant wholesalers | 0.5% (81) | 0.7% (59) | 0.3% (22) |
| Building material and garden equipment and supplies dealers | 0.5% (72) | 0.5% (40) | 0.5% (32) |
| Jewelry, luggage, and leather goods stores | 0.5% (71) | 0.2% (19) | 0.7% (52) |
| Alcoholic beverages merchant wholesalers | 0.5% (67) | 0.9% (67) | 0.0% (0) |
| U. S. Postal service | 0.4% (58) | 0.4% (35) | 0.3% (23) |
| Retail florists | 0.4% (58) | 0.2% (17) | 0.6% (41) |
| Other direct selling establishments | 0.3% (52) | 0.1% (8) | 0.6% (44) |
| Wood products | 0.3% (50) | 0.5% (41) | 0.1% (9) |
| Pharmacies and drug stores | 0.3% (46) | 0.3% (27) | 0.3% (19) |
| Chemicals | 0.3% (45) | 0.5% (40) | 0.1% (5) |
| Printing and related support activities | 0.3% (44) | 0.5% (36) | 0.1% (8) |
| Miscellaneous manufacturing | 0.3% (43) | 0.5% (43) | 0.0% (0) |
| Water transportation | 0.3% (43) | 0.3% (23) | 0.3% (20) |
| Miscellaneous nondurable goods merchant wholesalers | 0.3% (42) | 0.2% (17) | 0.4% (25) |
| Book stores and news dealers | 0.2% (36) | 0.0% (1) | 0.5% (35) |
| Transportation equipment | 0.2% (26) | 0.3% (26) | 0.0% (0) |
| Machinery, equipment, and supplies merchant wholesalers | 0.2% (24) | 0.3% (24) | 0.0% (0) |
| Music stores | 0.2% (24) | 0.2% (16) | 0.1% (8) |
| Paper and paper products merchant wholesalers | 0.1% (21) | 0.1% (10) | 0.2% (11) |
| Warehousing and storage | 0.1% (21) | 0.0% (0) | 0.3% (21) |
| Furniture and related product manufacturing | 0.1% (19) | 0.2% (19) | 0.0% (0) |
| Electrical and electronic goods merchant wholesalers | 0.1% (19) | 0.1% (11) | 0.1% (8) |
| Metal and metal products | 0.1% (18) | 0.2% (18) | 0.0% (0) |
| Electronic shopping and mail-order houses | 0.1% (16) | 0.2% (16) | 0.0% (0) |
| Beverage and tobacco products | 0.1% (14) | 0.1% (10) | 0.1% (4) |
| Hardware, plumbing and heating equipment, and supplies merchant wholesalers | 0.1% (9) | 0.1% (9) | 0.0% (0) |
| Fuel dealers | 0.1% (9) | 0.1% (9) | 0.0% (0) |
| Office supplies and stationery stores | 0.1% (8) | 0.1% (8) | 0.0% (0) |
Unemployment in North Kona
- Unemployment by race in 2000
- Unemployment rate for White non-Hispanic residents
- 3.1%Males
- 2.4%Females
- Unemployment rate for American Indian and Alaska Native residents
- 23.7%Females
- Unemployment rate for Asian residents
- 5.4%Males
- 3.3%Females
- Unemployment rate for two or more race residents
- 2.9%Males
- 5.7%Females
- Unemployment rate for Hispanic or Latino residents
- 4.5%Males
- 7.8%Females
Time leaving home to go to work
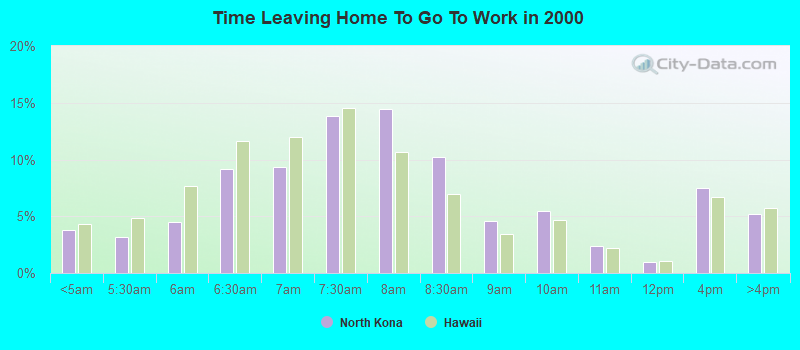
<5am:
| North Kona: | 3.8% (550) |
| Hawaii: | 4.3% (24,484) |
5:30am:
| North Kona: | 3.2% (455) |
| Hawaii: | 4.9% (27,476) |
6am:
| North Kona: | 4.5% (651) |
| Hawaii: | 7.7% (43,322) |
6:30am:
| North Kona: | 9.2% (1,322) |
| Hawaii: | 11.6% (65,360) |
7am:
| North Kona: | 9.4% (1,350) |
| Hawaii: | 12.0% (67,419) |
7:30am:
| North Kona: | 13.8% (1,997) |
| Hawaii: | 14.5% (81,910) |
8am:
| North Kona: | 14.4% (2,083) |
| Hawaii: | 10.7% (60,043) |
8:30am:
| North Kona: | 10.3% (1,479) |
| Hawaii: | 6.9% (39,062) |
9am:
| North Kona: | 4.6% (659) |
| Hawaii: | 3.4% (19,353) |
10am:
| North Kona: | 5.5% (794) |
| Hawaii: | 4.6% (26,106) |
11am:
| North Kona: | 2.4% (340) |
| Hawaii: | 2.2% (12,599) |
12pm:
| North Kona: | 1.0% (143) |
| Hawaii: | 1.1% (6,027) |
4pm:
| North Kona: | 7.5% (1,075) |
| Hawaii: | 6.7% (37,483) |
>4pm:
| North Kona: | 5.2% (748) |
| Hawaii: | 5.7% (32,314) |
Travel time to work
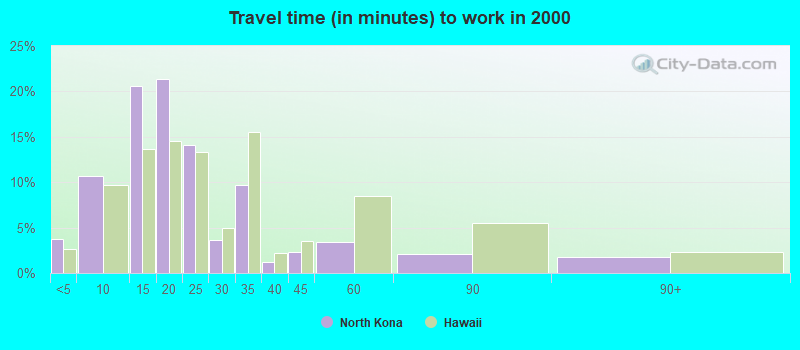
Less than 5 minutes:
| North Kona: | 3.7% (539) |
| Hawaii: | 2.6% (14,748) |
5 to 9 minutes:
| North Kona: | 10.6% (1,534) |
| Hawaii: | 9.6% (54,341) |
10 to 14 minutes:
| North Kona: | 20.6% (2,976) |
| Hawaii: | 13.7% (77,207) |
15 to 19 minutes:
| North Kona: | 21.4% (3,082) |
| Hawaii: | 14.5% (81,891) |
20 to 24 minutes:
| North Kona: | 14.1% (2,031) |
| Hawaii: | 13.4% (75,329) |
25 to 29 minutes:
| North Kona: | 3.6% (523) |
| Hawaii: | 5.0% (28,106) |
30 to 34 minutes:
| North Kona: | 9.7% (1,398) |
| Hawaii: | 15.5% (87,508) |
35 to 39 minutes:
| North Kona: | 1.2% (170) |
| Hawaii: | 2.1% (12,088) |
40 to 44 minutes:
| North Kona: | 2.3% (338) |
| Hawaii: | 3.5% (19,539) |
45 to 59 minutes:
| North Kona: | 3.5% (499) |
| Hawaii: | 8.5% (48,025) |
60 to 89 minutes:
| North Kona: | 2.1% (305) |
| Hawaii: | 5.6% (31,296) |
90 or more minutes:
| North Kona: | 1.7% (251) |
| Hawaii: | 2.3% (12,880) |
Means of transportation to work
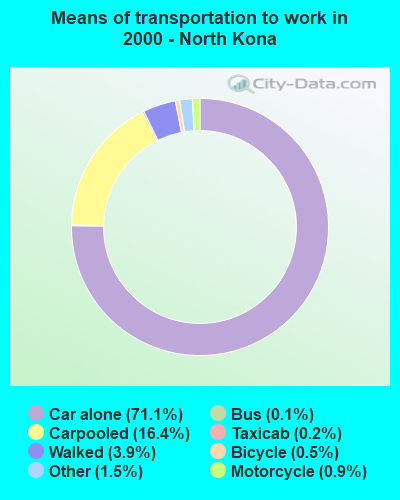
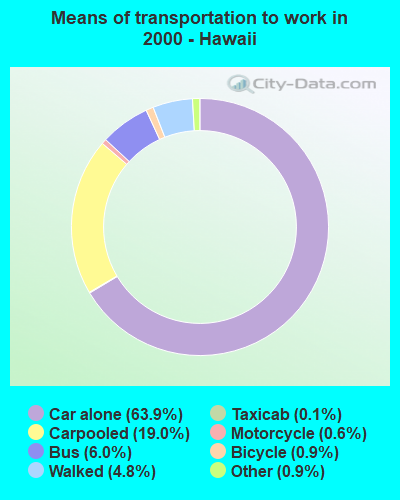
Drove car alone:
| North Kona: | 71.1% (10,252) |
| Hawaii: | 63.9% (359,916) |
Carpooled:
| North Kona: | 16.4% (2,365) |
| Hawaii: | 19.0% (107,191) |
Bus or trolley bus:
| North Kona: | 0.1% (20) |
| Hawaii: | 6.0% (34,022) |
Taxicab:
| North Kona: | 0.2% (27) |
| Hawaii: | 0.1% (798) |
Motorcycle:
| North Kona: | 0.9% (135) |
| Hawaii: | 0.6% (3,254) |
Bicycle:
| North Kona: | 0.5% (71) |
| Hawaii: | 0.9% (4,888) |
Walked:
| North Kona: | 3.9% (560) |
| Hawaii: | 4.8% (27,134) |
Other means:
| North Kona: | 1.5% (216) |
| Hawaii: | 0.9% (5,207) |
Private vehicle occupancy
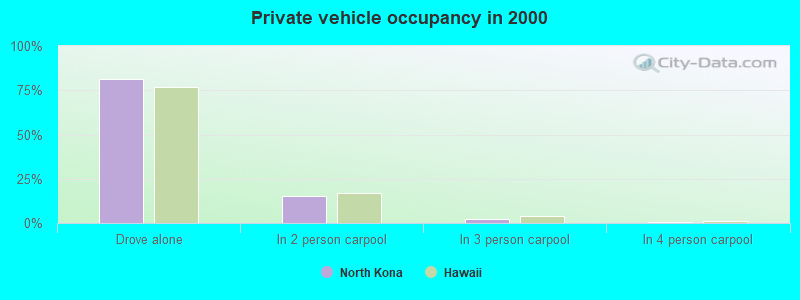
Drove alone:
| North Kona: | 81.3% (10,252) |
| Hawaii: | 77.1% (359,916) |
In 2 person carpool:
| North Kona: | 15.5% (1,957) |
| Hawaii: | 17.1% (80,034) |
In 3 person carpool:
| North Kona: | 2.2% (273) |
| Hawaii: | 3.8% (17,627) |
In 4 person carpool:
| North Kona: | 0.8% (102) |
| Hawaii: | 1.3% (6,277) |
In 5-6 person carpool:
| North Kona: | 0.3% (33) |
| Hawaii: | 0.5% (2,391) |
Class of workers
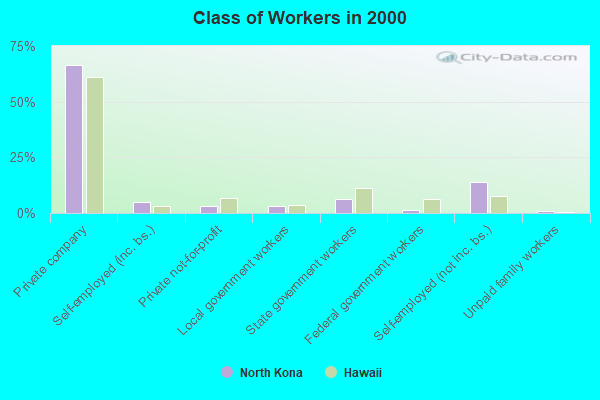
Employee of private company:
| North Kona: | 66.3% (9,865) |
| Hawaii: | 61.1% (328,465) |
Self-employed in own incorporated business:
| North Kona: | 4.9% (726) |
| Hawaii: | 3.2% (17,161) |
Private not-for-profit wage and salary workers:
| North Kona: | 3.3% (495) |
| Hawaii: | 6.7% (35,980) |
Local government workers:
| North Kona: | 3.2% (471) |
| Hawaii: | 3.5% (18,685) |
State government workers:
| North Kona: | 6.3% (941) |
| Hawaii: | 11.2% (60,085) |
Federal government workers:
| North Kona: | 1.3% (194) |
| Hawaii: | 6.4% (34,229) |
Self-employed workers in own not incorporated business:
| North Kona: | 13.9% (2,065) |
| Hawaii: | 7.6% (41,109) |
Unpaid family workers:
| North Kona: | 0.9% (130) |
| Hawaii: | 0.4% (2,195) |
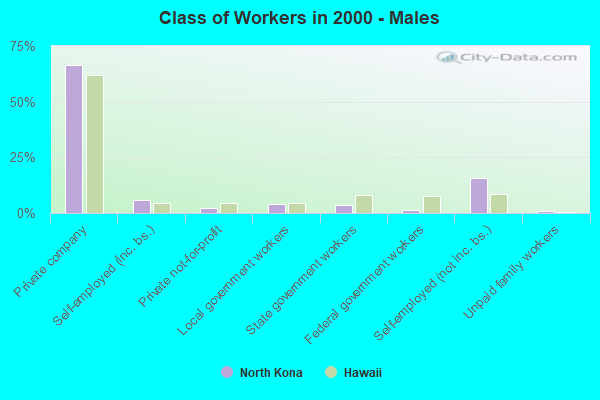
Employee of private company - Males:
| North Kona: | 66.3% (5,218) |
| Hawaii: | 62.1% (171,831) |
Self-employed in own incorporated business - Males:
| North Kona: | 6.0% (471) |
| Hawaii: | 4.3% (11,812) |
Private not-for-profit wage and salary workers - Males:
| North Kona: | 2.3% (180) |
| Hawaii: | 4.6% (12,779) |
Local government workers - Males:
| North Kona: | 4.1% (325) |
| Hawaii: | 4.3% (11,954) |
State government workers - Males:
| North Kona: | 3.4% (266) |
| Hawaii: | 7.9% (21,739) |
Federal government workers - Males:
| North Kona: | 1.4% (113) |
| Hawaii: | 7.7% (21,221) |
Self-employed workers in own not incorporated business - Males:
| North Kona: | 15.5% (1,221) |
| Hawaii: | 8.8% (24,193) |
Unpaid family workers - Males:
| North Kona: | 1.0% (78) |
| Hawaii: | 0.3% (954) |
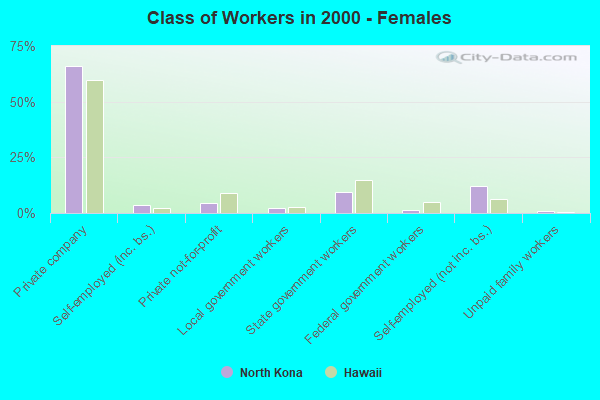
Employee of private company - Females:
| North Kona: | 66.2% (4,647) |
| Hawaii: | 59.9% (156,634) |
Self-employed in own incorporated business - Females:
| North Kona: | 3.6% (255) |
| Hawaii: | 2.0% (5,349) |
Private not-for-profit wage and salary workers - Females:
| North Kona: | 4.5% (315) |
| Hawaii: | 8.9% (23,201) |
Local government workers - Females:
| North Kona: | 2.1% (146) |
| Hawaii: | 2.6% (6,731) |
State government workers - Females:
| North Kona: | 9.6% (675) |
| Hawaii: | 14.7% (38,346) |
Federal government workers - Females:
| North Kona: | 1.2% (81) |
| Hawaii: | 5.0% (13,008) |
Self-employed workers in own not incorporated business - Females:
| North Kona: | 12.0% (844) |
| Hawaii: | 6.5% (16,916) |
Unpaid family workers - Females:
| North Kona: | 0.7% (52) |
| Hawaii: | 0.5% (1,241) |