Work and Jobs in Orange, New Jersey (NJ) Detailed Stats
Occupations, Industries, Unemployment, Workers, Commute

Recent posts about work in Orange, New Jersey on our local forum with over 2,400,000 registered users:
 | Curious about schools in West Orange or Verona (18 replies) |
| West Orange pleasantdale area? (24 replies) |
| Why is the City of Orange so much rougher than West Orange? (40 replies) |
| West Orange - The Good The Bad and Ugly (46 replies) |
| Restrictions on travel into/out of NJ (South Orange area) (1 reply) |
| Took Job in NYC: Seeking Advice on Where to Live in NJ & Commute (68 replies) |
Latest news about work in Orange, NJ collected exclusively by city-data.com from local newspapers, TV, and radio stations
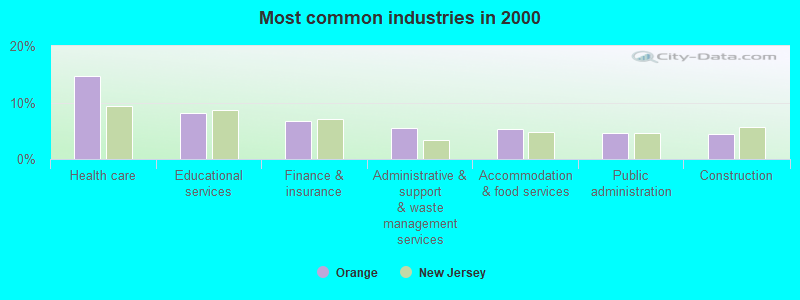
The most common industries in Orange are: Health care (14.7% of civilian employees), Educational services (8.1% of civilian employees), Finance & insurance (6.8% of civilian employees). 71.3% of workers are employees of private companies, which is about the same as the rate of 70.6% across the entire state of New Jersey.
Most common industries
Most common industries | |||
|---|---|---|---|
Industry | All | Males | Females |
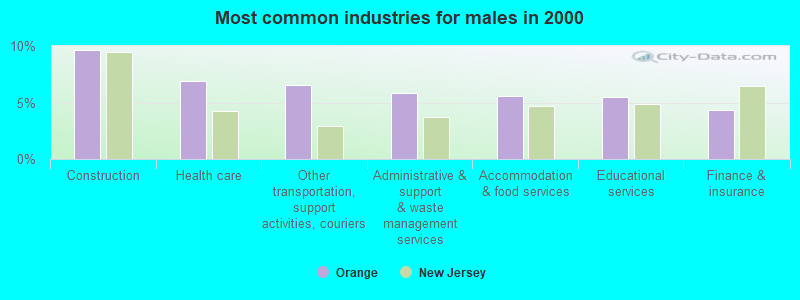
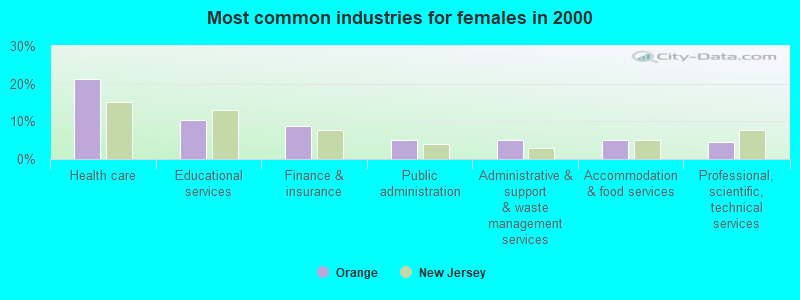
| Health care | 14.7% (2,015) | 6.9% (432) | 21.2% (1,583) |
| Educational services | 8.1% (1,105) | 5.4% (341) | 10.3% (764) |
| Finance and insurance | 6.8% (927) | 4.3% (271) | 8.8% (656) |
| Administrative and support and waste management services | 5.4% (744) | 5.8% (363) | 5.1% (381) |
| Accommodation and food services | 5.3% (730) | 5.6% (350) | 5.1% (380) |
| Public administration | 4.5% (621) | 3.8% (238) | 5.1% (383) |
| Construction | 4.5% (616) | 9.6% (603) | 0.2% (13) |
| Professional, scientific, and technical services | 4.4% (606) | 4.2% (263) | 4.6% (343) |
| Other transportation, and support activities, and couriers | 4.2% (575) | 6.5% (408) | 2.2% (167) |
| Social assistance | 2.7% (377) | 1.1% (70) | 4.1% (307) |
| Broadcasting and telecommunications | 2.6% (359) | 2.2% (140) | 2.9% (219) |
| Personal and laundry services | 2.2% (306) | 2.0% (123) | 2.5% (183) |
| Chemicals | 2.1% (288) | 2.3% (145) | 1.9% (143) |
| Real estate and rental and leasing | 1.9% (263) | 2.4% (153) | 1.5% (110) |
| Food and beverage stores | 1.9% (254) | 2.1% (129) | 1.7% (125) |
| U. S. Postal service | 1.5% (207) | 1.3% (82) | 1.7% (125) |
| Religious, grantmaking, civic, professional, and similar organizations | 1.5% (201) | 2.4% (149) | 0.7% (52) |
| Repair and maintenance | 1.4% (195) | 2.9% (182) | 0.2% (13) |
| Miscellaneous manufacturing | 1.3% (177) | 1.2% (75) | 1.4% (102) |
| Publishing, and motion picture and sound recording industries | 1.3% (172) | 1.1% (71) | 1.4% (101) |
| Department and other general merchandise stores | 1.3% (172) | 0.8% (48) | 1.7% (124) |
| Clothing and accessories, including shoe, stores | 1.3% (172) | 0.9% (54) | 1.6% (118) |
| Food | 1.2% (163) | 0.9% (55) | 1.4% (108) |
| Arts, entertainment, and recreation | 1.0% (138) | 1.5% (91) | 0.6% (47) |
| Other direct selling establishments | 1.0% (133) | 1.5% (96) | 0.5% (37) |
| Radio, TV, and computer stores | 1.0% (132) | 0.4% (28) | 1.4% (104) |
| Truck transportation | 0.8% (110) | 1.5% (93) | 0.2% (17) |
| Motor vehicle and parts dealers | 0.8% (109) | 1.6% (98) | 0.1% (11) |
| Metal and metal products | 0.7% (93) | 1.2% (72) | 0.3% (21) |
| Computer and electronic products | 0.6% (88) | 0.5% (29) | 0.8% (59) |
| Private households | 0.6% (84) | 0.1% (5) | 1.1% (79) |
| Groceries and related products merchant wholesalers | 0.6% (83) | 0.8% (52) | 0.4% (31) |
| Transportation equipment | 0.6% (81) | 1.1% (67) | 0.2% (14) |
| Air transportation | 0.6% (81) | 0.7% (42) | 0.5% (39) |
| Machinery | 0.6% (80) | 0.7% (45) | 0.5% (35) |
| Pharmacies and drug stores | 0.6% (80) | 0.0% (0) | 1.1% (80) |
| Warehousing and storage | 0.5% (69) | 0.7% (44) | 0.3% (25) |
| Data processing, libraries, and other information services | 0.5% (67) | 0.6% (36) | 0.4% (31) |
| Printing and related support activities | 0.5% (65) | 0.8% (52) | 0.2% (13) |
| Apparel | 0.5% (64) | 0.6% (37) | 0.4% (27) |
| Nonmetallic mineral products | 0.5% (62) | 1.0% (62) | 0.0% (0) |
| Furniture and home furnishings, and household appliance stores | 0.4% (60) | 0.8% (48) | 0.2% (12) |
| Utilities | 0.4% (57) | 0.6% (35) | 0.3% (22) |
| Plastics and rubber products | 0.4% (50) | 0.6% (35) | 0.2% (15) |
| Building material and garden equipment and supplies dealers | 0.4% (50) | 0.8% (50) | 0.0% (0) |
| Apparel, fabrics, and notions merchant wholesalers | 0.3% (47) | 0.6% (36) | 0.1% (11) |
| Sporting goods, camera, and hobby and toy stores | 0.3% (44) | 0.1% (4) | 0.5% (40) |
| Furniture and related product manufacturing | 0.3% (41) | 0.5% (33) | 0.1% (8) |
| Professional and commercial equipment and supplies merchant wholesalers | 0.3% (37) | 0.5% (29) | 0.1% (8) |
| Retail florists | 0.3% (35) | 0.3% (20) | 0.2% (15) |
| Music stores | 0.2% (33) | 0.4% (25) | 0.1% (8) |
| Miscellaneous nondurable goods merchant wholesalers | 0.2% (31) | 0.3% (19) | 0.2% (12) |
| Used merchandise, gift, novelty, and souvenir, and other miscellaneous stores | 0.2% (30) | 0.1% (9) | 0.3% (21) |
| Textile mills and textile products | 0.2% (30) | 0.4% (22) | 0.1% (8) |
| Alcoholic beverages merchant wholesalers | 0.2% (26) | 0.4% (26) | 0.0% (0) |
| Electrical equipment, appliances, and components | 0.2% (24) | 0.1% (5) | 0.3% (19) |
| Office supplies and stationery stores | 0.2% (24) | 0.2% (10) | 0.2% (14) |
| Mining, quarrying, and oil and gas extraction | 0.1% (17) | 0.2% (10) | 0.1% (7) |
| Electrical and electronic goods merchant wholesalers | 0.1% (16) | 0.1% (8) | 0.1% (8) |
| Lumber and other construction materials merchant wholesalers | 0.1% (15) | 0.1% (9) | 0.1% (6) |
| Gasoline stations | 0.1% (14) | 0.2% (14) | 0.0% (0) |
| Beverage and tobacco products | 0.1% (14) | 0.2% (14) | 0.0% (0) |
| Health and personal care, except drug, stores | 0.1% (13) | 0.1% (7) | 0.1% (6) |
| Drugs, sundries, and chemical and allied products merchant wholesalers | 0.1% (13) | 0.1% (7) | 0.1% (6) |
| Hardware, plumbing and heating equipment, and supplies merchant wholesalers | 0.1% (12) | 0.2% (12) | 0.0% (0) |
| Rail transportation | 0.1% (12) | 0.2% (12) | 0.0% (0) |
| Paper | 0.1% (12) | 0.2% (12) | 0.0% (0) |
| Furniture and home furnishing merchant wholesalers | 0.1% (11) | 0.1% (7) | 0.1% (4) |
| Motor vehicles, parts and supplies merchant wholesalers | 0.1% (10) | 0.2% (10) | 0.0% (0) |
| Recyclable material merchant wholesalers | 0.1% (9) | 0.1% (9) | 0.0% (0) |
| Paper and paper products merchant wholesalers | 0.1% (7) | 0.1% (7) | 0.0% (0) |
| Metals and minerals, except petroleum, merchant wholesalers | 0.1% (7) | 0.1% (7) | 0.0% (0) |
Unemployment in Orange
- Unemployment by race in 2000
- Unemployment rate for White non-Hispanic residents
- 19.7%Males
- 7.9%Females
- Unemployment rate for Black residents
- 12.9%Males
- 10.4%Females
- Unemployment rate for other race residents
- 14.5%Males
- 2.8%Females
- Unemployment rate for two or more race residents
- 5.9%Males
- 8.1%Females
- Unemployment rate for Hispanic or Latino residents
- 9.9%Males
- 5.9%Females
Time leaving home to go to work
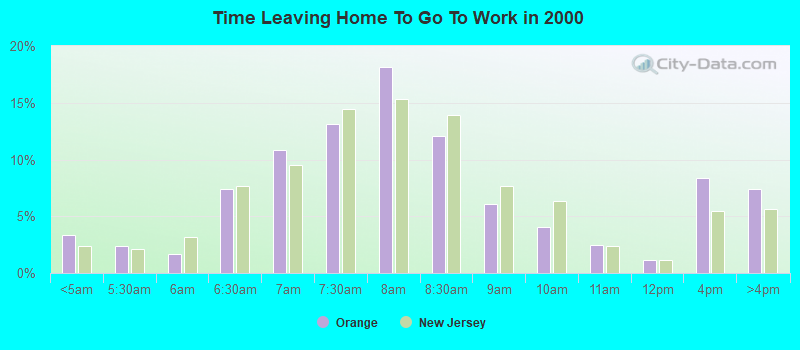
<5am:
| Orange: | 3.4% (451) |
| New Jersey: | 2.4% (92,776) |
5:30am:
| Orange: | 2.4% (323) |
| New Jersey: | 2.1% (83,147) |
6am:
| Orange: | 1.7% (227) |
| New Jersey: | 3.2% (124,191) |
6:30am:
| Orange: | 7.4% (995) |
| New Jersey: | 7.7% (297,494) |
7am:
| Orange: | 10.9% (1,453) |
| New Jersey: | 9.5% (369,088) |
7:30am:
| Orange: | 13.2% (1,760) |
| New Jersey: | 14.4% (558,435) |
8am:
| Orange: | 18.2% (2,432) |
| New Jersey: | 15.3% (592,839) |
8:30am:
| Orange: | 12.0% (1,611) |
| New Jersey: | 14.0% (541,137) |
9am:
| Orange: | 6.0% (809) |
| New Jersey: | 7.6% (295,834) |
10am:
| Orange: | 4.1% (543) |
| New Jersey: | 6.4% (246,745) |
11am:
| Orange: | 2.4% (327) |
| New Jersey: | 2.4% (92,391) |
12pm:
| Orange: | 1.1% (151) |
| New Jersey: | 1.1% (43,997) |
4pm:
| Orange: | 8.4% (1,120) |
| New Jersey: | 5.5% (213,079) |
>4pm:
| Orange: | 7.4% (987) |
| New Jersey: | 5.6% (218,724) |
Travel time to work
Daytime population change due to commuting: -6,155 (-18.7%)
Workers who live and work in this place: 1,400 (10.5%)
Workers who live and work in this place: 1,400 (10.5%)
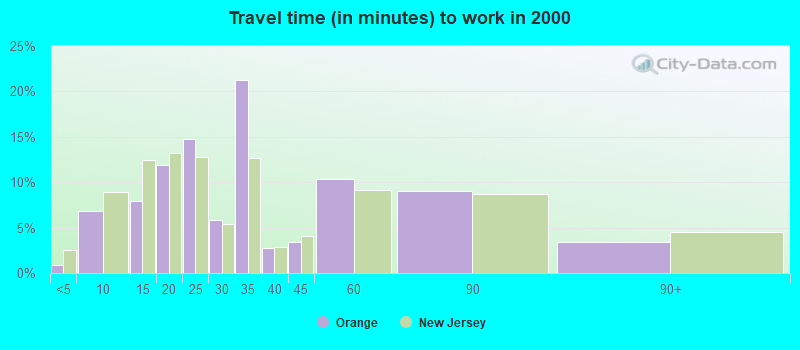
Less than 5 minutes:
| Orange: | 0.9% (123) |
| New Jersey: | 2.6% (99,241) |
5 to 9 minutes:
| Orange: | 6.8% (911) |
| New Jersey: | 9.0% (347,598) |
10 to 14 minutes:
| Orange: | 7.9% (1,060) |
| New Jersey: | 12.5% (482,988) |
15 to 19 minutes:
| Orange: | 11.9% (1,594) |
| New Jersey: | 13.2% (510,571) |
20 to 24 minutes:
| Orange: | 14.8% (1,979) |
| New Jersey: | 12.8% (497,467) |
25 to 29 minutes:
| Orange: | 5.9% (788) |
| New Jersey: | 5.4% (210,226) |
30 to 34 minutes:
| Orange: | 21.2% (2,838) |
| New Jersey: | 12.7% (492,539) |
35 to 39 minutes:
| Orange: | 2.8% (370) |
| New Jersey: | 2.8% (109,571) |
40 to 44 minutes:
| Orange: | 3.5% (463) |
| New Jersey: | 4.0% (156,148) |
45 to 59 minutes:
| Orange: | 10.4% (1,388) |
| New Jersey: | 9.1% (352,609) |
60 to 89 minutes:
| Orange: | 9.1% (1,213) |
| New Jersey: | 8.7% (335,777) |
90 or more minutes:
| Orange: | 3.5% (462) |
| New Jersey: | 4.5% (175,142) |
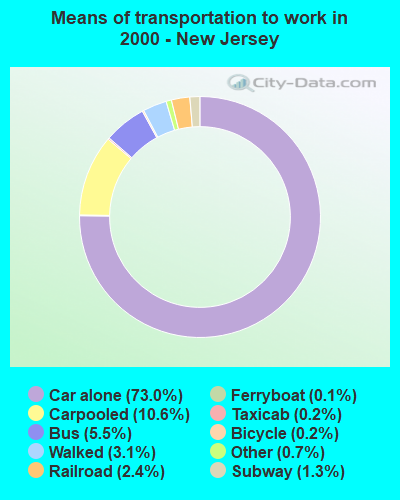
Means of transportation to work
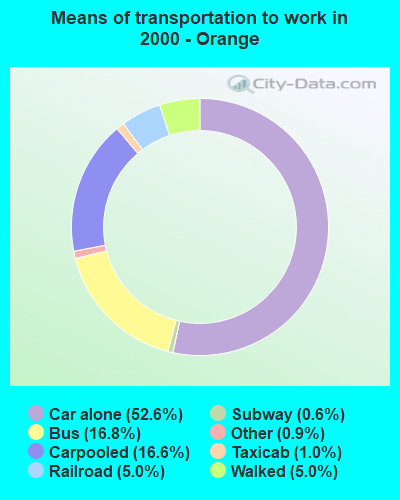
Drove car alone:
| Orange: | 52.6% (7,033) |
| New Jersey: | 73.0% (2,828,303) |
Carpooled:
| Orange: | 16.6% (2,224) |
| New Jersey: | 10.6% (412,299) |
Bus or trolley bus:
| Orange: | 16.8% (2,253) |
| New Jersey: | 5.5% (213,067) |
Subway or elevated:
| Orange: | 0.6% (76) |
| New Jersey: | 1.3% (50,279) |
Railroad:
| Orange: | 5.0% (670) |
| New Jersey: | 2.4% (93,864) |
Ferryboat:
| Orange: | 0.0% (5) |
| New Jersey: | 0.1% (4,904) |
Taxicab:
| Orange: | 1.0% (136) |
| New Jersey: | 0.2% (7,879) |
Bicycle:
| Orange: | 0.1% (9) |
| New Jersey: | 0.2% (9,142) |
Walked:
| Orange: | 5.0% (668) |
| New Jersey: | 3.1% (121,305) |
Other means:
| Orange: | 0.9% (115) |
| New Jersey: | 0.7% (25,484) |
Private vehicle occupancy
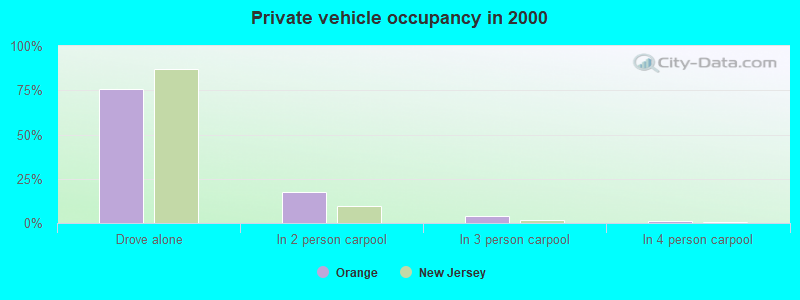
Drove alone:
| Orange: | 76.0% (7,033) |
| New Jersey: | 87.3% (2,828,303) |
In 2 person carpool:
| Orange: | 17.3% (1,603) |
| New Jersey: | 9.6% (311,146) |
In 3 person carpool:
| Orange: | 4.2% (388) |
| New Jersey: | 1.7% (55,192) |
In 4 person carpool:
| Orange: | 1.3% (122) |
| New Jersey: | 0.7% (21,516) |
In 5-6 person carpool:
| Orange: | 0.7% (66) |
| New Jersey: | 0.4% (12,963) |
In 7+ person carpool:
| Orange: | 0.5% (45) |
| New Jersey: | 0.4% (11,482) |
Class of workers
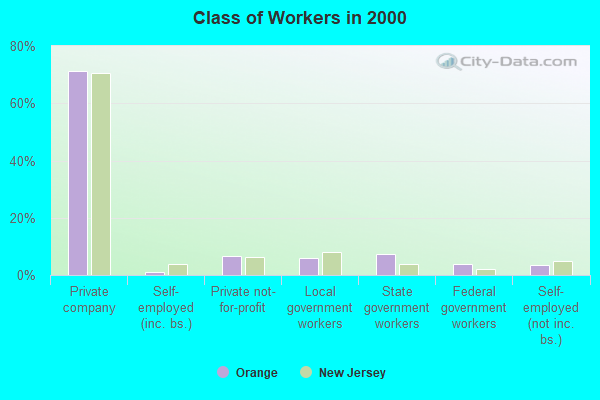
Employee of private company:
| Orange: | 71.3% (9,770) |
| New Jersey: | 70.6% (2,789,718) |
Self-employed in own incorporated business:
| Orange: | 1.1% (155) |
| New Jersey: | 3.8% (149,548) |
Private not-for-profit wage and salary workers:
| Orange: | 6.7% (920) |
| New Jersey: | 6.4% (254,203) |
Local government workers:
| Orange: | 6.1% (834) |
| New Jersey: | 7.9% (311,080) |
State government workers:
| Orange: | 7.2% (990) |
| New Jersey: | 3.8% (151,067) |
Federal government workers:
| Orange: | 3.9% (536) |
| New Jersey: | 2.2% (88,294) |
Self-employed workers in own not incorporated business:
| Orange: | 3.6% (491) |
| New Jersey: | 5.0% (197,664) |
Unpaid family workers:
| Orange: | 0.1% (14) |
| New Jersey: | 0.2% (8,455) |
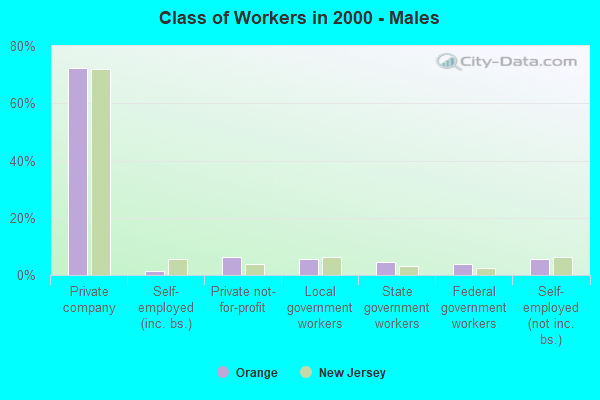
Employee of private company - Males:
| Orange: | 72.3% (4,526) |
| New Jersey: | 72.1% (1,513,771) |
Self-employed in own incorporated business - Males:
| Orange: | 1.4% (88) |
| New Jersey: | 5.5% (115,635) |
Private not-for-profit wage and salary workers - Males:
| Orange: | 6.4% (402) |
| New Jersey: | 3.9% (82,116) |
Local government workers - Males:
| Orange: | 5.6% (351) |
| New Jersey: | 6.3% (131,844) |
State government workers - Males:
| Orange: | 4.5% (283) |
| New Jersey: | 3.2% (68,111) |
Federal government workers - Males:
| Orange: | 4.0% (248) |
| New Jersey: | 2.6% (53,792) |
Self-employed workers in own not incorporated business - Males:
| Orange: | 5.6% (348) |
| New Jersey: | 6.2% (130,204) |
Unpaid family workers - Males:
| Orange: | 0.2% (14) |
| New Jersey: | 0.2% (3,384) |
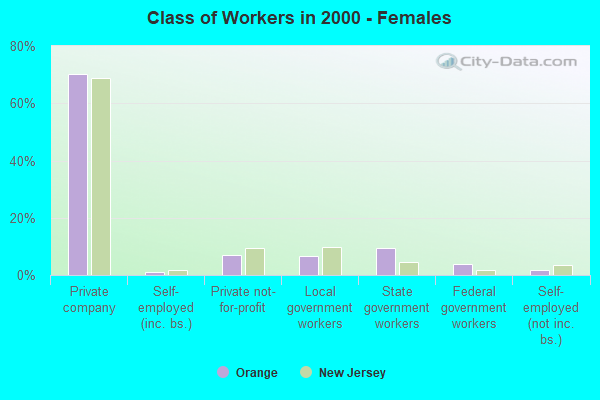
Employee of private company - Females:
| Orange: | 70.4% (5,244) |
| New Jersey: | 68.9% (1,275,947) |
Self-employed in own incorporated business - Females:
| Orange: | 0.9% (67) |
| New Jersey: | 1.8% (33,913) |
Private not-for-profit wage and salary workers - Females:
| Orange: | 7.0% (518) |
| New Jersey: | 9.3% (172,087) |
Local government workers - Females:
| Orange: | 6.5% (483) |
| New Jersey: | 9.7% (179,236) |
State government workers - Females:
| Orange: | 9.5% (707) |
| New Jersey: | 4.5% (82,956) |
Federal government workers - Females:
| Orange: | 3.9% (288) |
| New Jersey: | 1.9% (34,502) |
Self-employed workers in own not incorporated business - Females:
| Orange: | 1.9% (143) |
| New Jersey: | 3.6% (67,460) |