Work and Jobs in Perris Valley, California (CA) Detailed Stats
Occupations, Industries, Unemployment, Workers, Commute
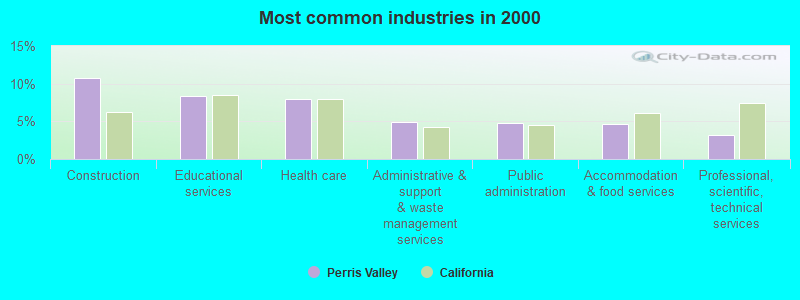
The most common industries in Perris Valley are: Construction (10.8% of civilian employees), Educational services (8.3% of civilian employees), Health care (8.0% of civilian employees). 69.8% of workers are employees of private companies, which is 2.5% greater than the rate of 68.0% across the entire state of California.
Most common industries
Most common industries | |||
|---|---|---|---|
Industry | All | Males | Females |
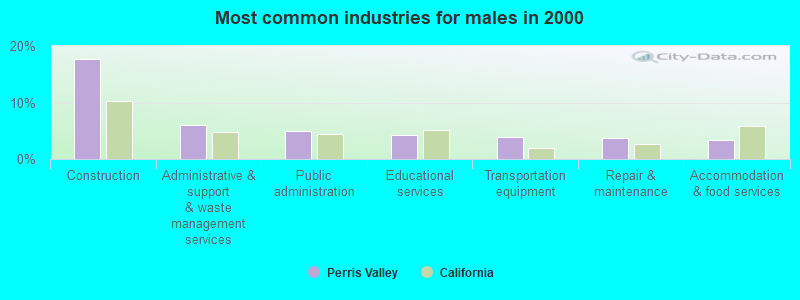
| Construction | 10.8% (5,429) | 17.8% (5,023) | 1.8% (406) |
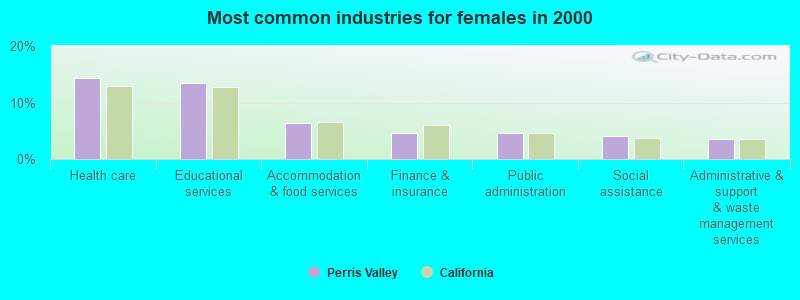
| Educational services | 8.3% (4,207) | 4.3% (1,223) | 13.5% (2,984) |
| Health care | 8.0% (4,024) | 2.9% (833) | 14.4% (3,191) |
| Administrative and support and waste management services | 4.9% (2,472) | 6.0% (1,693) | 3.5% (779) |
| Public administration | 4.8% (2,422) | 5.0% (1,418) | 4.5% (1,004) |
| Accommodation and food services | 4.7% (2,371) | 3.4% (958) | 6.4% (1,413) |
| Professional, scientific, and technical services | 3.1% (1,577) | 3.1% (863) | 3.2% (714) |
| Finance and insurance | 3.0% (1,492) | 1.7% (488) | 4.5% (1,004) |
| Miscellaneous manufacturing | 2.8% (1,433) | 2.4% (680) | 3.4% (753) |
| Food and beverage stores | 2.8% (1,424) | 2.8% (780) | 2.9% (644) |
| Transportation equipment | 2.7% (1,356) | 3.9% (1,106) | 1.1% (250) |
| Repair and maintenance | 2.3% (1,158) | 3.7% (1,049) | 0.5% (109) |
| Real estate and rental and leasing | 2.2% (1,121) | 1.8% (498) | 2.8% (623) |
| Social assistance | 2.0% (1,011) | 0.3% (96) | 4.1% (915) |
| Department and other general merchandise stores | 2.0% (988) | 1.2% (330) | 3.0% (658) |
| Arts, entertainment, and recreation | 1.9% (944) | 2.0% (563) | 1.7% (381) |
| Truck transportation | 1.7% (882) | 2.9% (828) | 0.2% (54) |
| Agriculture, forestry, fishing and hunting | 1.7% (876) | 2.6% (742) | 0.6% (134) |
| Other transportation, and support activities, and couriers | 1.5% (744) | 1.9% (524) | 1.0% (220) |
| Metal and metal products | 1.4% (721) | 1.9% (542) | 0.8% (179) |
| Computer and electronic products | 1.3% (675) | 1.1% (319) | 1.6% (356) |
| Broadcasting and telecommunications | 1.3% (672) | 1.6% (463) | 0.9% (209) |
| Motor vehicle and parts dealers | 1.3% (670) | 1.9% (550) | 0.5% (120) |
| Personal and laundry services | 1.3% (656) | 0.5% (152) | 2.3% (504) |
| Electronic shopping and mail-order houses | 1.1% (550) | 0.6% (183) | 1.7% (367) |
| Utilities | 1.0% (502) | 1.2% (346) | 0.7% (156) |
| Religious, grantmaking, civic, professional, and similar organizations | 1.0% (481) | 0.9% (250) | 1.0% (231) |
| Other direct selling establishments | 0.9% (472) | 1.0% (288) | 0.8% (184) |
| Building material and garden equipment and supplies dealers | 0.9% (471) | 1.1% (318) | 0.7% (153) |
| U. S. Postal service | 0.9% (466) | 1.1% (300) | 0.7% (166) |
| Publishing, and motion picture and sound recording industries | 0.9% (429) | 0.9% (257) | 0.8% (172) |
| Groceries and related products merchant wholesalers | 0.8% (420) | 1.1% (324) | 0.4% (96) |
| Nonmetallic mineral products | 0.8% (391) | 1.2% (329) | 0.3% (62) |
| Plastics and rubber products | 0.7% (350) | 0.8% (223) | 0.6% (127) |
| Machinery | 0.7% (345) | 0.8% (239) | 0.5% (106) |
| Private households | 0.7% (330) | 0.1% (19) | 1.4% (311) |
| Wood products | 0.7% (328) | 1.0% (274) | 0.2% (54) |
| Used merchandise, gift, novelty, and souvenir, and other miscellaneous stores | 0.6% (323) | 0.4% (122) | 0.9% (201) |
| Food | 0.6% (290) | 0.5% (129) | 0.7% (161) |
| Gasoline stations | 0.6% (279) | 0.3% (73) | 0.9% (206) |
| Printing and related support activities | 0.6% (278) | 0.7% (210) | 0.3% (68) |
| Chemicals | 0.5% (266) | 0.6% (179) | 0.4% (87) |
| Radio, TV, and computer stores | 0.5% (252) | 0.5% (155) | 0.4% (97) |
| Clothing and accessories, including shoe, stores | 0.5% (248) | 0.2% (56) | 0.9% (192) |
| Miscellaneous nondurable goods merchant wholesalers | 0.4% (224) | 0.6% (163) | 0.3% (61) |
| Furniture and related product manufacturing | 0.4% (204) | 0.6% (167) | 0.2% (37) |
| Furniture and home furnishings, and household appliance stores | 0.4% (204) | 0.4% (126) | 0.4% (78) |
| Pharmacies and drug stores | 0.4% (200) | 0.2% (52) | 0.7% (148) |
| Machinery, equipment, and supplies merchant wholesalers | 0.3% (173) | 0.5% (155) | 0.1% (18) |
| Warehousing and storage | 0.3% (168) | 0.5% (138) | 0.1% (30) |
| Motor vehicles, parts and supplies merchant wholesalers | 0.3% (158) | 0.4% (125) | 0.1% (33) |
| Apparel | 0.3% (148) | 0.1% (42) | 0.5% (106) |
| Rail transportation | 0.3% (146) | 0.3% (84) | 0.3% (62) |
| Air transportation | 0.3% (142) | 0.4% (117) | 0.1% (25) |
| Sporting goods, camera, and hobby and toy stores | 0.3% (140) | 0.2% (59) | 0.4% (81) |
| Professional and commercial equipment and supplies merchant wholesalers | 0.3% (135) | 0.3% (91) | 0.2% (44) |
| Electrical equipment, appliances, and components | 0.3% (130) | 0.3% (88) | 0.2% (42) |
| Data processing, libraries, and other information services | 0.3% (130) | 0.1% (38) | 0.4% (92) |
| Electrical and electronic goods merchant wholesalers | 0.2% (109) | 0.2% (65) | 0.2% (44) |
| Beverage and tobacco products | 0.2% (106) | 0.3% (93) | 0.1% (13) |
| Textile mills and textile products | 0.2% (90) | 0.1% (20) | 0.3% (70) |
| Health and personal care, except drug, stores | 0.2% (80) | 0.1% (35) | 0.2% (45) |
| Lumber and other construction materials merchant wholesalers | 0.2% (79) | 0.2% (44) | 0.2% (35) |
| Paper | 0.1% (72) | 0.2% (54) | 0.1% (18) |
| Furniture and home furnishing merchant wholesalers | 0.1% (68) | 0.2% (49) | 0.1% (19) |
| Petroleum and coal products | 0.1% (65) | 0.2% (65) | 0.0% (0) |
| Petroleum and petroleum products merchant wholesalers | 0.1% (62) | 0.2% (54) | 0.0% (8) |
| Mining, quarrying, and oil and gas extraction | 0.1% (54) | 0.2% (54) | 0.0% (0) |
| Paper and paper products merchant wholesalers | 0.1% (50) | 0.1% (41) | 0.0% (9) |
| Miscellaneous durable goods merchant wholesalers | 0.1% (47) | 0.1% (29) | 0.1% (18) |
| Recyclable material merchant wholesalers | 0.1% (41) | 0.1% (41) | 0.0% (0) |
| Hardware, plumbing and heating equipment, and supplies merchant wholesalers | 0.1% (32) | 0.1% (32) | 0.0% (0) |
Unemployment in Perris Valley
- Unemployment by race in 2000
- Unemployment rate for White non-Hispanic residents
- 6.9%Males
- 7.9%Females
- Unemployment rate for Black residents
- 13.5%Males
- 15.4%Females
- Unemployment rate for American Indian and Alaska Native residents
- 4.7%Males
- 8.7%Females
- Unemployment rate for Asian residents
- 2.8%Males
- 4.9%Females
- Unemployment rate for other race residents
- 8.6%Males
- 12.0%Females
- Unemployment rate for two or more race residents
- 8.0%Males
- 13.2%Females
- Unemployment rate for Hispanic or Latino residents
- 8.8%Males
- 13.4%Females
Time leaving home to go to work
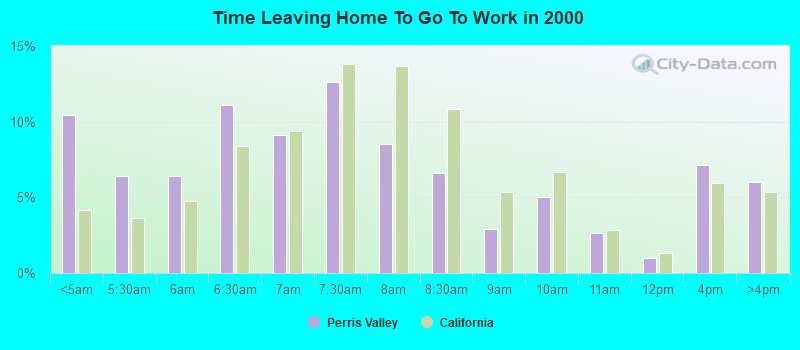
<5am:
| Perris Valley: | 10.4% (5,121) |
| California: | 4.2% (606,086) |
5:30am:
| Perris Valley: | 6.4% (3,160) |
| California: | 3.6% (523,209) |
6am:
| Perris Valley: | 6.4% (3,167) |
| California: | 4.8% (692,256) |
6:30am:
| Perris Valley: | 11.1% (5,448) |
| California: | 8.4% (1,216,867) |
7am:
| Perris Valley: | 9.1% (4,495) |
| California: | 9.4% (1,362,830) |
7:30am:
| Perris Valley: | 12.6% (6,211) |
| California: | 13.8% (2,006,950) |
8am:
| Perris Valley: | 8.5% (4,200) |
| California: | 13.7% (1,986,831) |
8:30am:
| Perris Valley: | 6.6% (3,251) |
| California: | 10.9% (1,577,815) |
9am:
| Perris Valley: | 2.9% (1,436) |
| California: | 5.4% (778,152) |
10am:
| Perris Valley: | 5.1% (2,484) |
| California: | 6.7% (972,355) |
11am:
| Perris Valley: | 2.6% (1,301) |
| California: | 2.9% (414,479) |
12pm:
| Perris Valley: | 1.0% (488) |
| California: | 1.3% (189,005) |
4pm:
| Perris Valley: | 7.1% (3,498) |
| California: | 6.0% (865,284) |
>4pm:
| Perris Valley: | 6.0% (2,962) |
| California: | 5.3% (776,167) |
Travel time to work
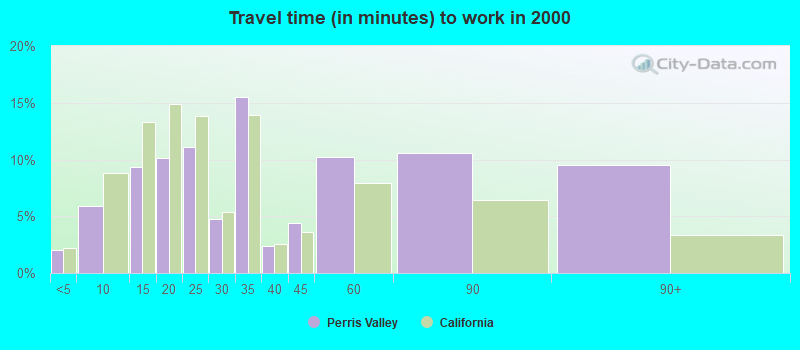
Less than 5 minutes:
| Perris Valley: | 2.0% (1,006) |
| California: | 2.2% (324,703) |
5 to 9 minutes:
| Perris Valley: | 5.9% (2,922) |
| California: | 8.8% (1,280,443) |
10 to 14 minutes:
| Perris Valley: | 9.4% (4,603) |
| California: | 13.3% (1,930,263) |
15 to 19 minutes:
| Perris Valley: | 10.1% (4,986) |
| California: | 14.9% (2,157,970) |
20 to 24 minutes:
| Perris Valley: | 11.1% (5,467) |
| California: | 13.8% (2,004,060) |
25 to 29 minutes:
| Perris Valley: | 4.8% (2,360) |
| California: | 5.4% (782,241) |
30 to 34 minutes:
| Perris Valley: | 15.5% (7,613) |
| California: | 13.9% (2,025,657) |
35 to 39 minutes:
| Perris Valley: | 2.4% (1,185) |
| California: | 2.5% (366,487) |
40 to 44 minutes:
| Perris Valley: | 4.4% (2,175) |
| California: | 3.6% (528,043) |
45 to 59 minutes:
| Perris Valley: | 10.2% (5,030) |
| California: | 7.9% (1,151,598) |
60 to 89 minutes:
| Perris Valley: | 10.6% (5,207) |
| California: | 6.4% (933,123) |
90 or more minutes:
| Perris Valley: | 9.5% (4,668) |
| California: | 3.3% (483,698) |
Means of transportation to work
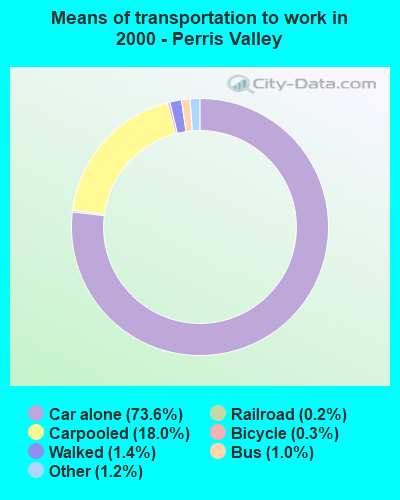

Drove car alone:
| Perris Valley: | 73.6% (36,207) |
| California: | 71.8% (10,432,462) |
Carpooled:
| Perris Valley: | 18.0% (8,865) |
| California: | 14.5% (2,113,313) |
Bus or trolley bus:
| Perris Valley: | 1.0% (476) |
| California: | 3.8% (549,425) |
Subway or elevated:
| Perris Valley: | 0.1% (28) |
| California: | 0.7% (107,711) |
Railroad:
| Perris Valley: | 0.2% (99) |
| California: | 0.3% (41,022) |
Ferryboat:
| Perris Valley: | 0.0% (9) |
| California: | 0.0% (6,831) |
Taxicab:
| Perris Valley: | 0.1% (27) |
| California: | 0.1% (9,890) |
Motorcycle:
| Perris Valley: | 0.1% (43) |
| California: | 0.2% (36,262) |
Bicycle:
| Perris Valley: | 0.3% (162) |
| California: | 0.8% (120,567) |
Walked:
| Perris Valley: | 1.4% (710) |
| California: | 2.9% (414,581) |
Other means:
| Perris Valley: | 1.2% (596) |
| California: | 0.8% (115,064) |
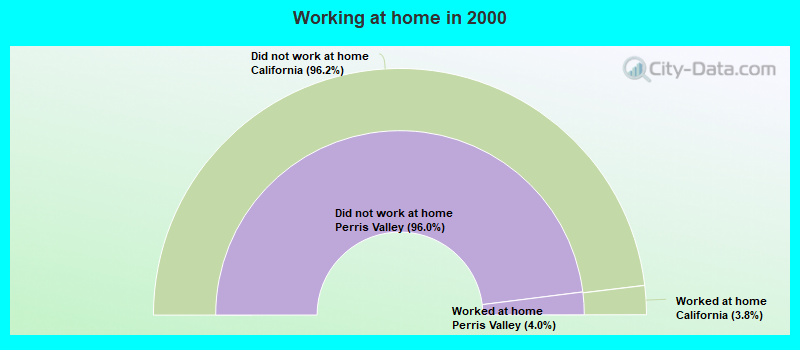
Private vehicle occupancy
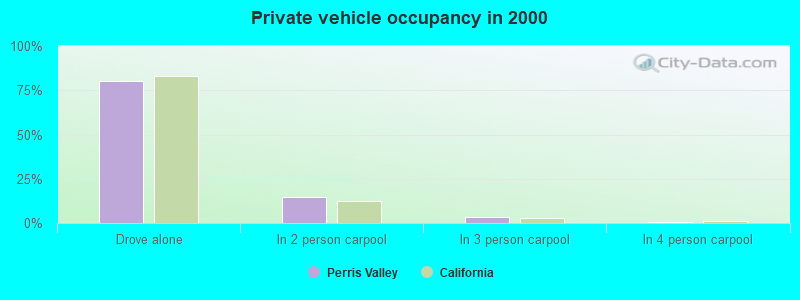
Drove alone:
| Perris Valley: | 80.3% (36,207) |
| California: | 83.2% (10,432,462) |
In 2 person carpool:
| Perris Valley: | 15.0% (6,747) |
| California: | 12.5% (1,564,905) |
In 3 person carpool:
| Perris Valley: | 3.1% (1,404) |
| California: | 2.6% (330,732) |
In 4 person carpool:
| Perris Valley: | 0.8% (342) |
| California: | 1.0% (119,364) |
In 5-6 person carpool:
| Perris Valley: | 0.5% (213) |
| California: | 0.5% (57,036) |
In 7+ person carpool:
| Perris Valley: | 0.4% (159) |
| California: | 0.3% (41,276) |
Class of workers
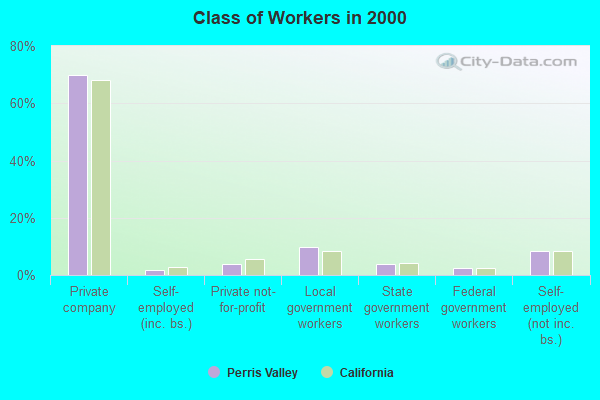
Employee of private company:
| Perris Valley: | 69.8% (35,176) |
| California: | 68.0% (10,009,465) |
Self-employed in own incorporated business:
| Perris Valley: | 1.8% (906) |
| California: | 2.7% (402,392) |
Private not-for-profit wage and salary workers:
| Perris Valley: | 3.7% (1,872) |
| California: | 5.7% (845,536) |
Local government workers:
| Perris Valley: | 9.8% (4,923) |
| California: | 8.3% (1,218,764) |
State government workers:
| Perris Valley: | 3.8% (1,900) |
| California: | 4.0% (594,953) |
Federal government workers:
| Perris Valley: | 2.3% (1,165) |
| California: | 2.3% (344,354) |
Self-employed workers in own not incorporated business:
| Perris Valley: | 8.5% (4,282) |
| California: | 8.5% (1,249,530) |
Unpaid family workers:
| Perris Valley: | 0.4% (195) |
| California: | 0.4% (53,934) |
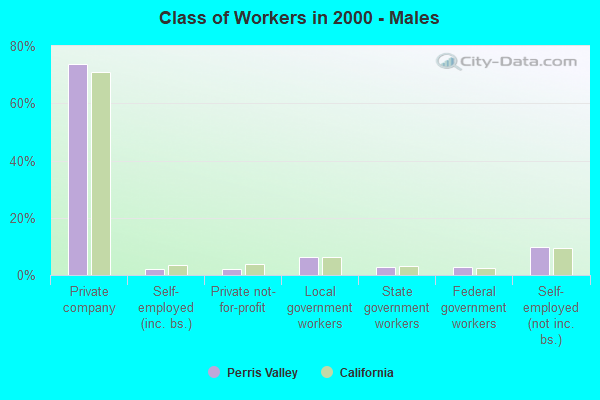
Employee of private company - Males:
| Perris Valley: | 73.6% (20,782) |
| California: | 71.1% (5,716,697) |
Self-employed in own incorporated business - Males:
| Perris Valley: | 2.2% (629) |
| California: | 3.6% (290,657) |
Private not-for-profit wage and salary workers - Males:
| Perris Valley: | 2.2% (628) |
| California: | 3.8% (303,997) |
Local government workers - Males:
| Perris Valley: | 6.3% (1,781) |
| California: | 6.2% (495,927) |
State government workers - Males:
| Perris Valley: | 2.9% (823) |
| California: | 3.2% (255,434) |
Federal government workers - Males:
| Perris Valley: | 2.7% (756) |
| California: | 2.5% (198,555) |
Self-employed workers in own not incorporated business - Males:
| Perris Valley: | 9.7% (2,743) |
| California: | 9.5% (760,853) |
Unpaid family workers - Males:
| Perris Valley: | 0.4% (110) |
| California: | 0.3% (23,230) |
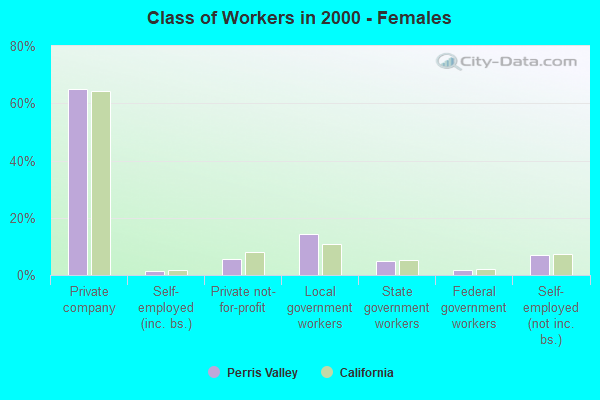
Employee of private company - Females:
| Perris Valley: | 64.9% (14,394) |
| California: | 64.3% (4,292,768) |
Self-employed in own incorporated business - Females:
| Perris Valley: | 1.2% (277) |
| California: | 1.7% (111,735) |
Private not-for-profit wage and salary workers - Females:
| Perris Valley: | 5.6% (1,244) |
| California: | 8.1% (541,539) |
Local government workers - Females:
| Perris Valley: | 14.2% (3,142) |
| California: | 10.8% (722,837) |
State government workers - Females:
| Perris Valley: | 4.9% (1,077) |
| California: | 5.1% (339,519) |
Federal government workers - Females:
| Perris Valley: | 1.8% (409) |
| California: | 2.2% (145,799) |
Self-employed workers in own not incorporated business - Females:
| Perris Valley: | 6.9% (1,539) |
| California: | 7.3% (488,677) |
Unpaid family workers - Females:
| Perris Valley: | 0.4% (85) |
| California: | 0.5% (30,704) |