Work and Jobs in Ravenna-Telephone, Texas (TX) Detailed Stats
Occupations, Industries, Unemployment, Workers, Commute
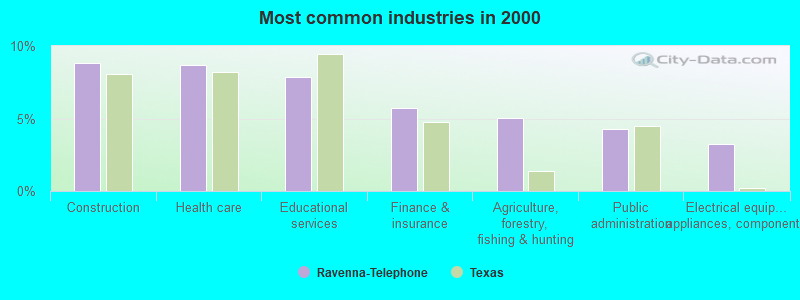
The most common industries in Ravenna-Telephone are: Construction (8.8% of civilian employees), Health care (8.7% of civilian employees), Educational services (7.9% of civilian employees). 63.7% of workers are employees of private companies, which is 9.2% less than the rate of 69.6% across the entire state of Texas.
Most common industries
Most common industries | |||
|---|---|---|---|
Industry | All | Males | Females |
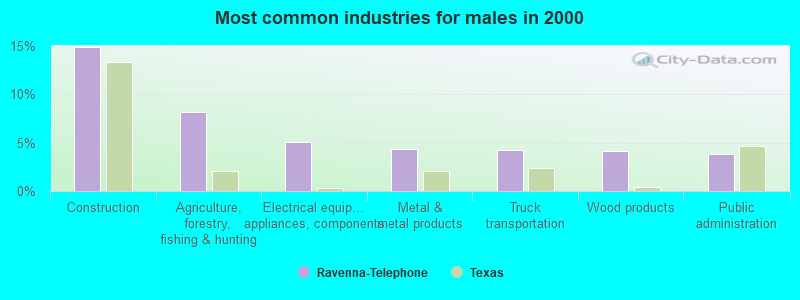
| Construction | 8.8% (162) | 14.9% (162) | 0.0% (0) |
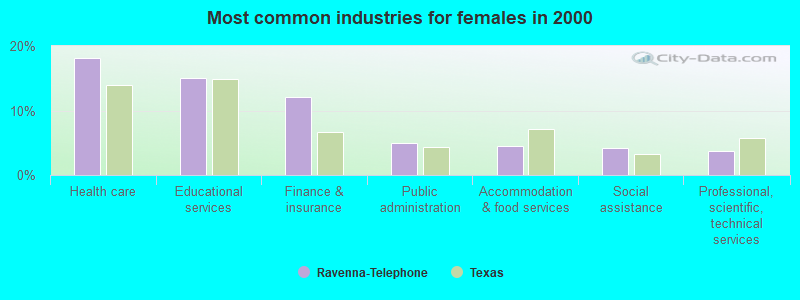
| Health care | 8.7% (159) | 2.1% (23) | 18.2% (136) |
| Educational services | 7.9% (144) | 2.9% (31) | 15.1% (113) |
| Finance and insurance | 5.7% (105) | 1.4% (15) | 12.0% (90) |
| Agriculture, forestry, fishing and hunting | 5.0% (92) | 8.2% (89) | 0.4% (3) |
| Public administration | 4.3% (78) | 3.8% (41) | 4.9% (37) |
| Electrical equipment, appliances, and components | 3.2% (59) | 5.1% (55) | 0.5% (4) |
| Metal and metal products | 3.1% (56) | 4.3% (47) | 1.2% (9) |
| Truck transportation | 2.8% (52) | 4.2% (46) | 0.8% (6) |
| Administrative and support and waste management services | 2.7% (49) | 3.0% (33) | 2.1% (16) |
| Wood products | 2.6% (48) | 4.1% (45) | 0.4% (3) |
| Professional, scientific, and technical services | 2.3% (42) | 1.3% (14) | 3.7% (28) |
| Accommodation and food services | 2.2% (40) | 0.6% (6) | 4.5% (34) |
| Utilities | 2.2% (40) | 3.3% (36) | 0.5% (4) |
| Department and other general merchandise stores | 2.1% (39) | 1.8% (19) | 2.7% (20) |
| Food and beverage stores | 2.0% (36) | 2.6% (28) | 1.1% (8) |
| Repair and maintenance | 1.9% (35) | 2.6% (28) | 0.9% (7) |
| Food | 1.7% (31) | 2.7% (29) | 0.3% (2) |
| Social assistance | 1.7% (31) | 0.0% (0) | 4.1% (31) |
| Mining, quarrying, and oil and gas extraction | 1.5% (28) | 2.4% (26) | 0.3% (2) |
| Building material and garden equipment and supplies dealers | 1.5% (28) | 2.3% (25) | 0.4% (3) |
| Plastics and rubber products | 1.4% (26) | 2.4% (26) | 0.0% (0) |
| Computer and electronic products | 1.4% (26) | 1.3% (14) | 1.6% (12) |
| Transportation equipment | 1.4% (26) | 1.5% (16) | 1.3% (10) |
| Nonmetallic mineral products | 1.3% (24) | 1.9% (21) | 0.4% (3) |
| Religious, grantmaking, civic, professional, and similar organizations | 1.1% (21) | 0.4% (4) | 2.3% (17) |
| Broadcasting and telecommunications | 1.1% (20) | 1.6% (17) | 0.4% (3) |
| Publishing, and motion picture and sound recording industries | 1.0% (19) | 0.0% (0) | 2.5% (19) |
| Paper | 1.0% (18) | 1.3% (14) | 0.5% (4) |
| Petroleum and petroleum products merchant wholesalers | 1.0% (18) | 1.7% (18) | 0.0% (0) |
| Motor vehicle and parts dealers | 0.9% (17) | 1.2% (13) | 0.5% (4) |
| Real estate and rental and leasing | 0.9% (17) | 0.3% (3) | 1.9% (14) |
| U. S. Postal service | 0.9% (16) | 0.8% (9) | 0.9% (7) |
| Chemicals | 0.9% (16) | 0.6% (6) | 1.3% (10) |
| Personal and laundry services | 0.9% (16) | 0.0% (0) | 2.1% (16) |
| Apparel | 0.8% (14) | 0.2% (2) | 1.6% (12) |
| Lumber and other construction materials merchant wholesalers | 0.8% (14) | 0.4% (4) | 1.3% (10) |
| Farm product raw materials merchant wholesalers | 0.7% (13) | 1.1% (12) | 0.1% (1) |
| Machinery | 0.7% (12) | 0.5% (5) | 0.9% (7) |
| Other transportation, and support activities, and couriers | 0.5% (10) | 0.8% (9) | 0.1% (1) |
| Clothing and accessories, including shoe, stores | 0.5% (9) | 0.0% (0) | 1.2% (9) |
| Miscellaneous nondurable goods merchant wholesalers | 0.5% (9) | 0.8% (9) | 0.0% (0) |
| Radio, TV, and computer stores | 0.4% (8) | 0.7% (8) | 0.0% (0) |
| Leather and allied products | 0.4% (7) | 0.6% (7) | 0.0% (0) |
| Petroleum and coal products | 0.4% (7) | 0.6% (7) | 0.0% (0) |
| Furniture and related product manufacturing | 0.4% (7) | 0.6% (7) | 0.0% (0) |
| Miscellaneous manufacturing | 0.4% (7) | 0.6% (6) | 0.1% (1) |
| Gasoline stations | 0.4% (7) | 0.0% (0) | 0.9% (7) |
| Data processing, libraries, and other information services | 0.3% (6) | 0.3% (3) | 0.4% (3) |
| Hardware, plumbing and heating equipment, and supplies merchant wholesalers | 0.3% (5) | 0.0% (0) | 0.7% (5) |
| Fuel dealers | 0.3% (5) | 0.5% (5) | 0.0% (0) |
| Pharmacies and drug stores | 0.3% (5) | 0.2% (2) | 0.4% (3) |
| Furniture and home furnishings, and household appliance stores | 0.3% (5) | 0.3% (3) | 0.3% (2) |
| Jewelry, luggage, and leather goods stores | 0.3% (5) | 0.3% (3) | 0.3% (2) |
| Printing and related support activities | 0.2% (4) | 0.2% (2) | 0.3% (2) |
| Recyclable material merchant wholesalers | 0.2% (4) | 0.4% (4) | 0.0% (0) |
| Machinery, equipment, and supplies merchant wholesalers | 0.2% (4) | 0.4% (4) | 0.0% (0) |
| Motor vehicles, parts and supplies merchant wholesalers | 0.2% (3) | 0.3% (3) | 0.0% (0) |
| Music stores | 0.2% (3) | 0.0% (0) | 0.4% (3) |
| Sporting goods, camera, and hobby and toy stores | 0.2% (3) | 0.3% (3) | 0.0% (0) |
| Private households | 0.2% (3) | 0.0% (0) | 0.4% (3) |
| Furniture and home furnishing merchant wholesalers | 0.1% (2) | 0.2% (2) | 0.0% (0) |
| Warehousing and storage | 0.1% (2) | 0.2% (2) | 0.0% (0) |
| Water transportation | 0.1% (2) | 0.2% (2) | 0.0% (0) |
| Retail florists | 0.1% (2) | 0.2% (2) | 0.0% (0) |
| Miscellaneous durable goods merchant wholesalers | 0.1% (2) | 0.2% (2) | 0.0% (0) |
| Rail transportation | 0.1% (2) | 0.2% (2) | 0.0% (0) |
| Arts, entertainment, and recreation | 0.1% (2) | 0.2% (2) | 0.0% (0) |
| Textile mills and textile products | 0.1% (2) | 0.2% (2) | 0.0% (0) |
| Alcoholic beverages merchant wholesalers | 0.1% (2) | 0.2% (2) | 0.0% (0) |
Unemployment in Ravenna-Telephone
- Unemployment by race in 2000
- Unemployment rate for White non-Hispanic residents
- 1.9%Males
- 5.0%Females
- Unemployment rate for Black residents
- 60.0%Males
- Unemployment rate for other race residents
- 2.9%Males
- Unemployment rate for Hispanic or Latino residents
- 6.2%Males
- 4.2%Females
Time leaving home to go to work
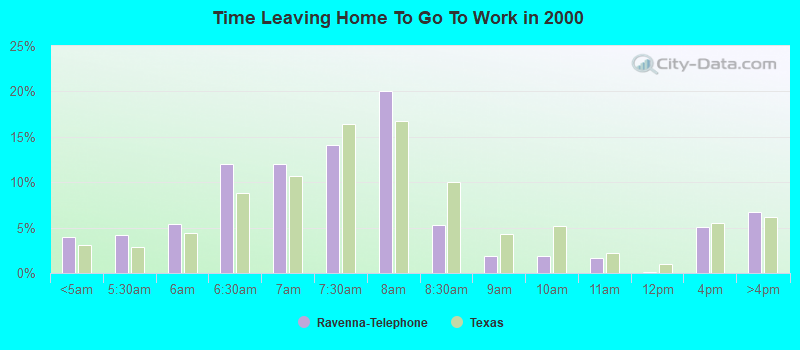
<5am:
| Ravenna-Telephone: | 4.0% (72) |
| Texas: | 3.1% (281,361) |
5:30am:
| Ravenna-Telephone: | 4.2% (76) |
| Texas: | 2.9% (262,060) |
6am:
| Ravenna-Telephone: | 5.4% (98) |
| Texas: | 4.4% (403,423) |
6:30am:
| Ravenna-Telephone: | 12.0% (218) |
| Texas: | 8.8% (808,876) |
7am:
| Ravenna-Telephone: | 12.0% (219) |
| Texas: | 10.7% (976,557) |
7:30am:
| Ravenna-Telephone: | 14.1% (257) |
| Texas: | 16.4% (1,500,904) |
8am:
| Ravenna-Telephone: | 20.0% (364) |
| Texas: | 16.8% (1,536,308) |
8:30am:
| Ravenna-Telephone: | 5.3% (96) |
| Texas: | 10.0% (913,601) |
9am:
| Ravenna-Telephone: | 1.8% (33) |
| Texas: | 4.4% (398,656) |
10am:
| Ravenna-Telephone: | 1.8% (33) |
| Texas: | 5.2% (472,592) |
11am:
| Ravenna-Telephone: | 1.6% (29) |
| Texas: | 2.2% (197,844) |
12pm:
| Ravenna-Telephone: | 0.1% (1) |
| Texas: | 0.9% (86,997) |
4pm:
| Ravenna-Telephone: | 5.1% (93) |
| Texas: | 5.5% (503,565) |
>4pm:
| Ravenna-Telephone: | 6.7% (122) |
| Texas: | 6.1% (563,107) |
Travel time to work
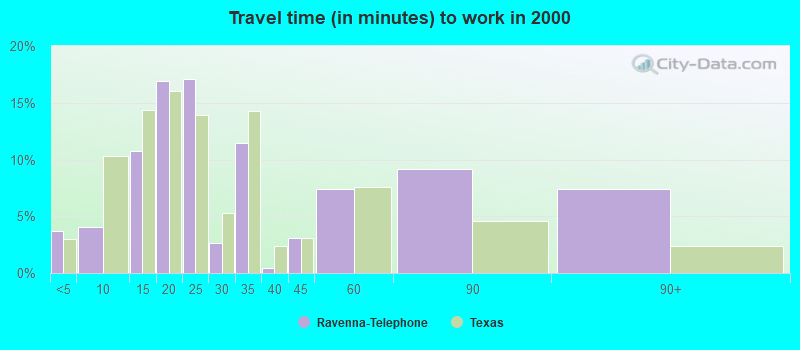
Less than 5 minutes:
| Ravenna-Telephone: | 3.7% (68) |
| Texas: | 3.0% (277,642) |
5 to 9 minutes:
| Ravenna-Telephone: | 4.1% (74) |
| Texas: | 10.3% (942,891) |
10 to 14 minutes:
| Ravenna-Telephone: | 10.7% (195) |
| Texas: | 14.4% (1,317,555) |
15 to 19 minutes:
| Ravenna-Telephone: | 16.9% (308) |
| Texas: | 16.0% (1,467,945) |
20 to 24 minutes:
| Ravenna-Telephone: | 17.1% (310) |
| Texas: | 13.9% (1,276,781) |
25 to 29 minutes:
| Ravenna-Telephone: | 2.6% (48) |
| Texas: | 5.3% (482,838) |
30 to 34 minutes:
| Ravenna-Telephone: | 11.5% (209) |
| Texas: | 14.3% (1,309,699) |
35 to 39 minutes:
| Ravenna-Telephone: | 0.4% (8) |
| Texas: | 2.4% (219,873) |
40 to 44 minutes:
| Ravenna-Telephone: | 3.1% (56) |
| Texas: | 3.1% (280,916) |
45 to 59 minutes:
| Ravenna-Telephone: | 7.4% (134) |
| Texas: | 7.6% (692,006) |
60 to 89 minutes:
| Ravenna-Telephone: | 9.2% (167) |
| Texas: | 4.6% (418,905) |
90 or more minutes:
| Ravenna-Telephone: | 7.4% (134) |
| Texas: | 2.4% (218,800) |
Means of transportation to work
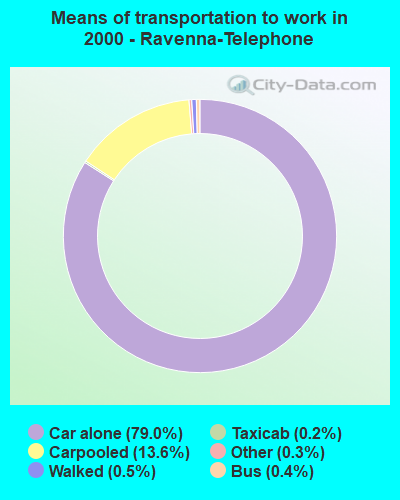

Drove car alone:
| Ravenna-Telephone: | 79.0% (1,436) |
| Texas: | 77.7% (7,115,590) |
Carpooled:
| Ravenna-Telephone: | 13.6% (248) |
| Texas: | 14.5% (1,326,012) |
Bus or trolley bus:
| Ravenna-Telephone: | 0.4% (8) |
| Texas: | 1.7% (157,014) |
Taxicab:
| Ravenna-Telephone: | 0.2% (3) |
| Texas: | 0.1% (6,102) |
Bicycle:
| Ravenna-Telephone: | 0.1% (1) |
| Texas: | 0.2% (21,551) |
Walked:
| Ravenna-Telephone: | 0.5% (9) |
| Texas: | 1.9% (173,670) |
Other means:
| Ravenna-Telephone: | 0.3% (6) |
| Texas: | 0.9% (86,692) |
Private vehicle occupancy
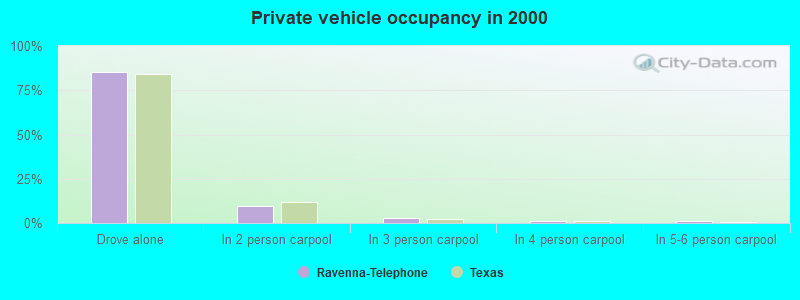
Drove alone:
| Ravenna-Telephone: | 85.3% (1,436) |
| Texas: | 84.3% (7,115,590) |
In 2 person carpool:
| Ravenna-Telephone: | 9.9% (166) |
| Texas: | 11.6% (982,994) |
In 3 person carpool:
| Ravenna-Telephone: | 2.6% (43) |
| Texas: | 2.4% (201,602) |
In 4 person carpool:
| Ravenna-Telephone: | 1.1% (19) |
| Texas: | 1.0% (83,518) |
In 5-6 person carpool:
| Ravenna-Telephone: | 1.2% (20) |
| Texas: | 0.5% (40,662) |
Class of workers
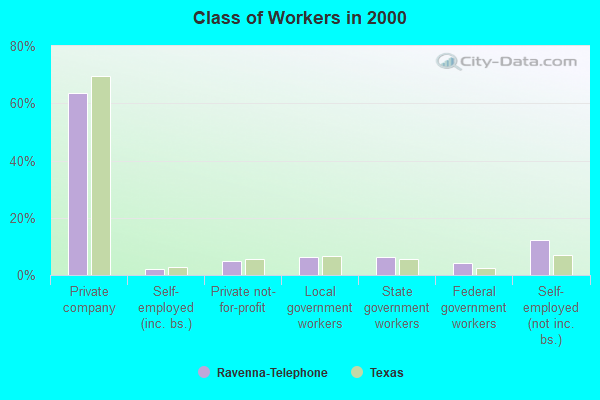
Employee of private company:
| Ravenna-Telephone: | 63.7% (1,168) |
| Texas: | 69.6% (6,425,274) |
Self-employed in own incorporated business:
| Ravenna-Telephone: | 2.0% (36) |
| Texas: | 2.7% (250,864) |
Private not-for-profit wage and salary workers:
| Ravenna-Telephone: | 5.0% (91) |
| Texas: | 5.7% (526,631) |
Local government workers:
| Ravenna-Telephone: | 6.3% (115) |
| Texas: | 6.6% (608,479) |
State government workers:
| Ravenna-Telephone: | 6.4% (117) |
| Texas: | 5.4% (501,082) |
Federal government workers:
| Ravenna-Telephone: | 4.4% (80) |
| Texas: | 2.6% (237,177) |
Self-employed workers in own not incorporated business:
| Ravenna-Telephone: | 12.2% (224) |
| Texas: | 7.1% (653,527) |
Unpaid family workers:
| Ravenna-Telephone: | 0.1% (2) |
| Texas: | 0.3% (31,338) |
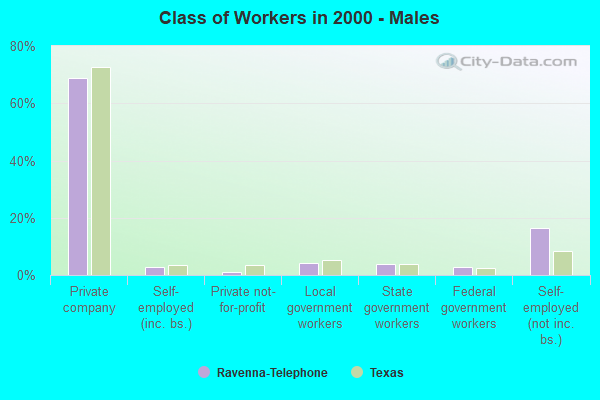
Employee of private company - Males:
| Ravenna-Telephone: | 68.9% (748) |
| Texas: | 72.7% (3,684,731) |
Self-employed in own incorporated business - Males:
| Ravenna-Telephone: | 2.8% (30) |
| Texas: | 3.6% (183,838) |
Private not-for-profit wage and salary workers - Males:
| Ravenna-Telephone: | 1.2% (13) |
| Texas: | 3.4% (173,484) |
Local government workers - Males:
| Ravenna-Telephone: | 4.1% (44) |
| Texas: | 5.1% (260,804) |
State government workers - Males:
| Ravenna-Telephone: | 4.0% (43) |
| Texas: | 3.8% (190,371) |
Federal government workers - Males:
| Ravenna-Telephone: | 2.8% (30) |
| Texas: | 2.6% (133,009) |
Self-employed workers in own not incorporated business - Males:
| Ravenna-Telephone: | 16.3% (177) |
| Texas: | 8.4% (428,111) |
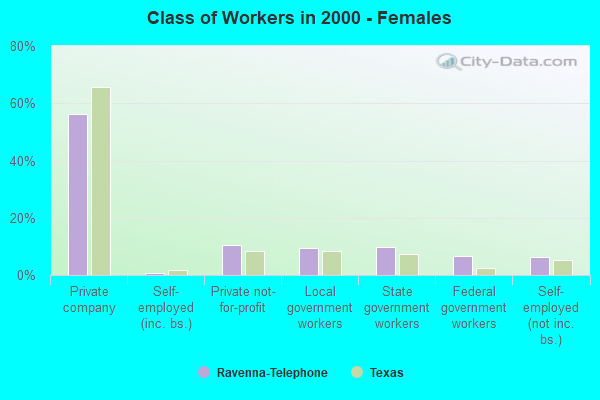
Employee of private company - Females:
| Ravenna-Telephone: | 56.1% (420) |
| Texas: | 65.8% (2,740,543) |
Self-employed in own incorporated business - Females:
| Ravenna-Telephone: | 0.8% (6) |
| Texas: | 1.6% (67,026) |
Private not-for-profit wage and salary workers - Females:
| Ravenna-Telephone: | 10.4% (78) |
| Texas: | 8.5% (353,147) |
Local government workers - Females:
| Ravenna-Telephone: | 9.5% (71) |
| Texas: | 8.3% (347,675) |
State government workers - Females:
| Ravenna-Telephone: | 9.9% (74) |
| Texas: | 7.5% (310,711) |
Federal government workers - Females:
| Ravenna-Telephone: | 6.7% (50) |
| Texas: | 2.5% (104,168) |
Self-employed workers in own not incorporated business - Females:
| Ravenna-Telephone: | 6.3% (47) |
| Texas: | 5.4% (225,416) |
Unpaid family workers - Females:
| Ravenna-Telephone: | 0.3% (2) |
| Texas: | 0.4% (17,000) |