Work and Jobs in Riverbend, Washington (WA) Detailed Stats
Occupations, Industries, Unemployment, Workers, Commute
Settings
X


Recent posts about work in Riverbend, Washington on our local forum with over 2,400,000 registered users:
 | Looking for mountains, community, hospital (26 replies) |
Latest news about work in Riverbend, WA collected exclusively by city-data.com from local newspapers, TV, and radio stations
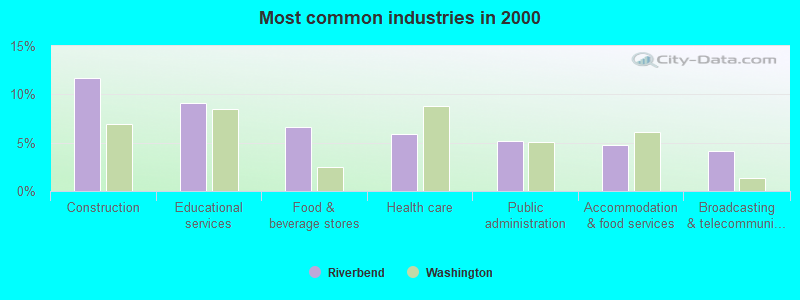
The most common industries in Riverbend are: Construction (11.7% of civilian employees), Educational services (9.1% of civilian employees), Food & beverage stores (6.7% of civilian employees). 100.0% of workers work in King County and 11.7% of all workers work at home. 63.9% of workers are employees of private companies, which is 3.3% less than the rate of 66.0% across the entire state of Washington.
Whole page based on the data from 2000 / 2022 when the population of Riverbend, Washington was 2,230 / 2,052
Whole page based on the data from 2000 / 2022 when the population of Riverbend, Washington was 2,230 / 2,052
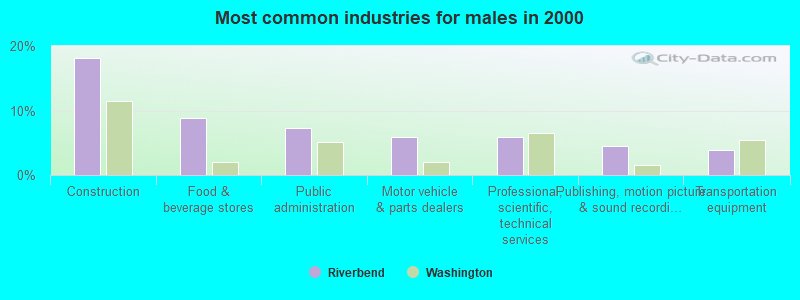
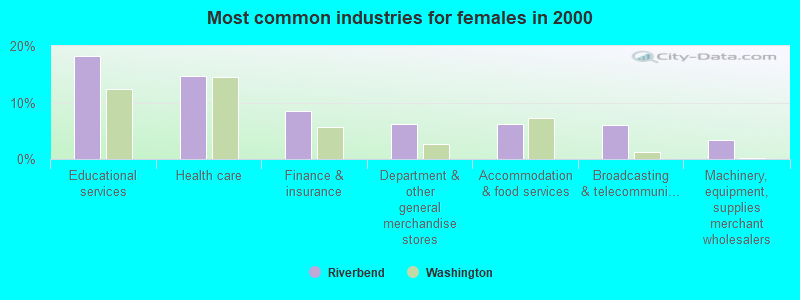
Most common industries
Most common industries | |||
|---|---|---|---|
Industry | All | Males | Females |
| Construction | 11.7% (137) | 18.1% (127) | 2.1% (10) |
| Educational services | 9.1% (106) | 3.0% (21) | 18.2% (85) |
| Food and beverage stores | 6.7% (78) | 8.8% (62) | 3.4% (16) |
| Health care | 5.9% (69) | 0.0% (0) | 14.8% (69) |
| Public administration | 5.2% (61) | 7.3% (51) | 2.1% (10) |
| Accommodation and food services | 4.8% (56) | 3.8% (27) | 6.2% (29) |
| Broadcasting and telecommunications | 4.2% (49) | 3.0% (21) | 6.0% (28) |
| Professional, scientific, and technical services | 3.9% (46) | 5.8% (41) | 1.1% (5) |
| Publishing, and motion picture and sound recording industries | 3.6% (42) | 4.6% (32) | 2.1% (10) |
| Motor vehicle and parts dealers | 3.5% (41) | 5.8% (41) | 0.0% (0) |
| Finance and insurance | 3.4% (40) | 0.0% (0) | 8.6% (40) |
| Transportation equipment | 2.9% (34) | 3.8% (27) | 1.5% (7) |
| Computer and electronic products | 2.6% (31) | 3.3% (23) | 1.7% (8) |
| Department and other general merchandise stores | 2.5% (29) | 0.0% (0) | 6.2% (29) |
| Data processing, libraries, and other information services | 2.1% (25) | 3.6% (25) | 0.0% (0) |
| Administrative and support and waste management services | 2.1% (24) | 3.4% (24) | 0.0% (0) |
| Clothing and accessories, including shoe, stores | 1.9% (22) | 3.1% (22) | 0.0% (0) |
| Miscellaneous manufacturing | 1.8% (21) | 3.0% (21) | 0.0% (0) |
| Social assistance | 1.8% (21) | 0.9% (6) | 3.2% (15) |
| Agriculture, forestry, fishing and hunting | 1.5% (18) | 0.9% (6) | 2.6% (12) |
| Food | 1.5% (18) | 2.6% (18) | 0.0% (0) |
| Machinery, equipment, and supplies merchant wholesalers | 1.4% (16) | 0.0% (0) | 3.4% (16) |
| Other direct selling establishments | 1.3% (15) | 2.1% (15) | 0.0% (0) |
| Printing and related support activities | 1.3% (15) | 2.1% (15) | 0.0% (0) |
| Religious, grantmaking, civic, professional, and similar organizations | 1.3% (15) | 2.1% (15) | 0.0% (0) |
| Metal and metal products | 1.1% (13) | 0.0% (0) | 2.8% (13) |
| Miscellaneous nondurable goods merchant wholesalers | 1.1% (13) | 1.8% (13) | 0.0% (0) |
| Other transportation, and support activities, and couriers | 0.9% (11) | 0.0% (0) | 2.4% (11) |
| Alcoholic beverages merchant wholesalers | 0.9% (11) | 1.6% (11) | 0.0% (0) |
| Vending machine operators | 0.9% (11) | 0.0% (0) | 2.4% (11) |
| Water transportation | 0.9% (10) | 1.4% (10) | 0.0% (0) |
| Arts, entertainment, and recreation | 0.9% (10) | 0.0% (0) | 2.1% (10) |
| Repair and maintenance | 0.8% (9) | 1.3% (9) | 0.0% (0) |
| Real estate and rental and leasing | 0.7% (8) | 1.1% (8) | 0.0% (0) |
| Pharmacies and drug stores | 0.6% (7) | 0.0% (0) | 1.5% (7) |
| Furniture and home furnishings, and household appliance stores | 0.6% (7) | 0.0% (0) | 1.5% (7) |
| Private households | 0.6% (7) | 0.0% (0) | 1.5% (7) |
| Electrical and electronic goods merchant wholesalers | 0.5% (6) | 0.9% (6) | 0.0% (0) |
| Textile mills and textile products | 0.5% (6) | 0.0% (0) | 1.3% (6) |
| Rail transportation | 0.5% (6) | 0.9% (6) | 0.0% (0) |
| U. S. Postal service | 0.5% (6) | 0.0% (0) | 1.3% (6) |
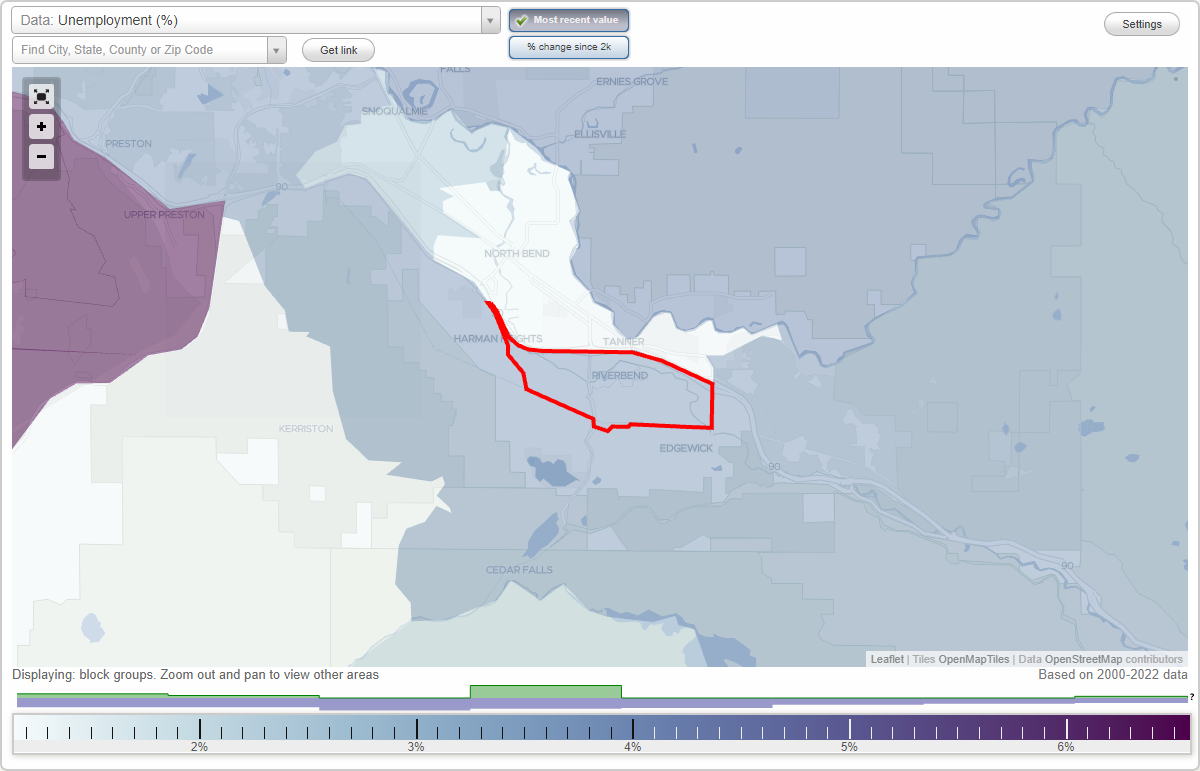
Unemployment in Riverbend
- Unemployment by race in 2022
- Unemployment rate for White non-Hispanic residents
- 2.5%Males
- Unemployment by race in 2000
- Unemployment rate for White non-Hispanic residents
- 4.3%Males
- 3.8%Females
- Unemployment rate for Asian residents
- 54.5%Females
Time leaving home to go to work
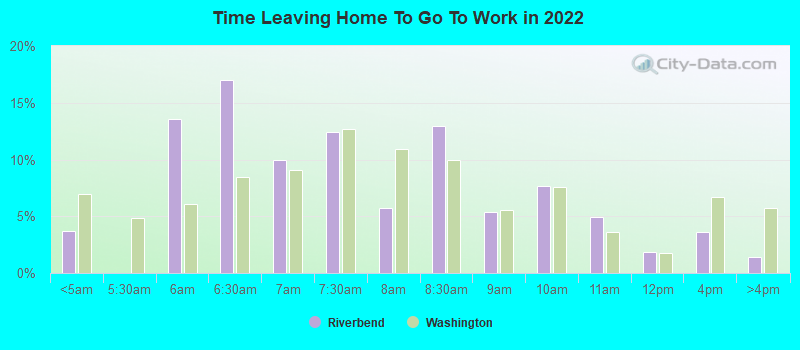
12:00 a.m. to 4:59 a.m.:
| Riverbend: | 3.7% (36) |
| Washington: | 7.0% (213,920) |
5:30 a.m. to 5:59 a.m.:
| Riverbend: | 13.5% (130) |
| Washington: | 6.1% (185,330) |
6:00 a.m. to 6:29 a.m.:
| Riverbend: | 17.0% (163) |
| Washington: | 8.4% (257,617) |
6:30 a.m. to 6:59 a.m.:
| Riverbend: | 9.9% (95) |
| Washington: | 9.1% (277,560) |
7:00 a.m. to 7:29 a.m.:
| Riverbend: | 12.4% (119) |
| Washington: | 12.7% (387,691) |
7:30 a.m. to 7:59 a.m.:
| Riverbend: | 5.8% (55) |
| Washington: | 11.0% (335,322) |
8:00 a.m. to 8:29 a.m.:
| Riverbend: | 13.0% (125) |
| Washington: | 10.0% (304,814) |
8:30 a.m. to 8:59 a.m.:
| Riverbend: | 5.4% (52) |
| Washington: | 5.5% (169,492) |
9:00 a.m. to 9:59 a.m.:
| Riverbend: | 7.7% (74) |
| Washington: | 7.6% (231,053) |
10:00 a.m. to 10:59 a.m.:
| Riverbend: | 4.9% (47) |
| Washington: | 3.7% (111,784) |
11:00 a.m. to 11:59 a.m.:
| Riverbend: | 1.8% (18) |
| Washington: | 1.8% (55,138) |
12:00 p.m. to 3:59 p.m.:
| Riverbend: | 3.6% (34) |
| Washington: | 6.7% (205,284) |
4:00 p.m. to 11:59 p.m.:
| Riverbend: | 1.4% (13) |
| Washington: | 5.7% (174,677) |
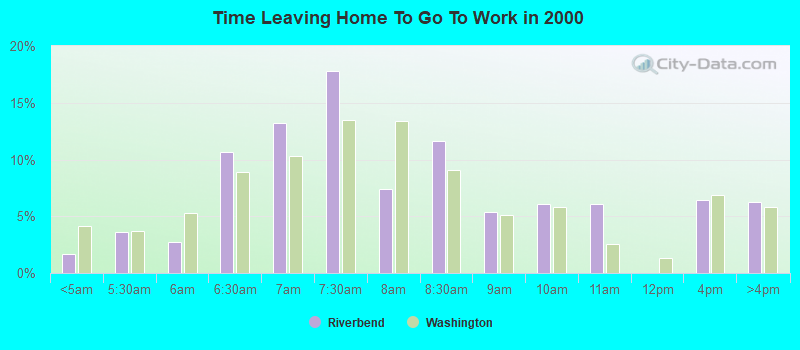
<5am:
| Riverbend: | 1.7% (19) |
| Washington: | 4.2% (115,997) |
5:30am:
| Riverbend: | 3.6% (41) |
| Washington: | 3.7% (102,868) |
6am:
| Riverbend: | 2.7% (31) |
| Washington: | 5.3% (147,812) |
6:30am:
| Riverbend: | 10.6% (121) |
| Washington: | 8.9% (248,462) |
7am:
| Riverbend: | 13.2% (150) |
| Washington: | 10.3% (288,005) |
7:30am:
| Riverbend: | 17.8% (202) |
| Washington: | 13.5% (375,030) |
8am:
| Riverbend: | 7.4% (84) |
| Washington: | 13.4% (372,576) |
8:30am:
| Riverbend: | 11.6% (132) |
| Washington: | 9.0% (252,058) |
9am:
| Riverbend: | 5.4% (61) |
| Washington: | 5.1% (141,936) |
10am:
| Riverbend: | 6.1% (69) |
| Washington: | 5.8% (161,204) |
11am:
| Riverbend: | 6.1% (69) |
| Washington: | 2.5% (70,123) |
4pm:
| Riverbend: | 6.4% (73) |
| Washington: | 6.8% (190,565) |
>4pm:
| Riverbend: | 6.2% (71) |
| Washington: | 5.8% (162,401) |
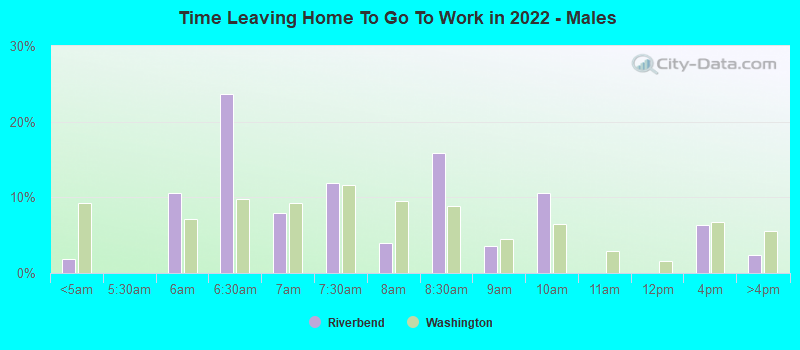
12:00 a.m. to 4:59 a.m. - Males:
| Riverbend: | 1.8% (10) |
| Washington: | 9.3% (158,516) |
5:30 a.m. to 5:59 a.m. - Males:
| Riverbend: | 10.5% (59) |
| Washington: | 7.1% (120,772) |
6:00 a.m. to 6:29 a.m. - Males:
| Riverbend: | 23.7% (133) |
| Washington: | 9.8% (166,050) |
6:30 a.m. to 6:59 a.m. - Males:
| Riverbend: | 7.9% (45) |
| Washington: | 9.3% (158,128) |
7:00 a.m. to 7:29 a.m. - Males:
| Riverbend: | 11.8% (66) |
| Washington: | 11.7% (198,720) |
7:30 a.m. to 7:59 a.m. - Males:
| Riverbend: | 4.0% (23) |
| Washington: | 9.6% (162,900) |
8:00 a.m. to 8:29 a.m. - Males:
| Riverbend: | 15.8% (89) |
| Washington: | 8.8% (149,907) |
8:30 a.m. to 8:59 a.m. - Males:
| Riverbend: | 3.5% (20) |
| Washington: | 4.5% (76,772) |
9:00 a.m. to 9:59 a.m. - Males:
| Riverbend: | 10.6% (60) |
| Washington: | 6.5% (111,251) |
12:00 p.m. to 3:59 p.m. - Males:
| Riverbend: | 6.3% (35) |
| Washington: | 6.8% (115,643) |
4:00 p.m. to 11:59 p.m. - Males:
| Riverbend: | 2.3% (13) |
| Washington: | 5.6% (95,440) |
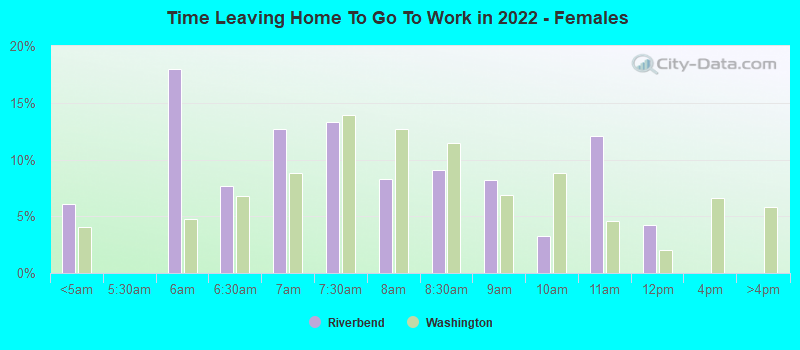
12:00 a.m. to 4:59 a.m. - Females:
| Riverbend: | 6.1% (24) |
| Washington: | 4.1% (55,404) |
5:30 a.m. to 5:59 a.m. - Females:
| Riverbend: | 18.0% (72) |
| Washington: | 4.8% (64,558) |
6:00 a.m. to 6:29 a.m. - Females:
| Riverbend: | 7.7% (31) |
| Washington: | 6.8% (91,567) |
6:30 a.m. to 6:59 a.m. - Females:
| Riverbend: | 12.7% (51) |
| Washington: | 8.8% (119,432) |
7:00 a.m. to 7:29 a.m. - Females:
| Riverbend: | 13.3% (53) |
| Washington: | 13.9% (188,971) |
7:30 a.m. to 7:59 a.m. - Females:
| Riverbend: | 8.3% (33) |
| Washington: | 12.7% (172,422) |
8:00 a.m. to 8:29 a.m. - Females:
| Riverbend: | 9.0% (36) |
| Washington: | 11.4% (154,907) |
8:30 a.m. to 8:59 a.m. - Females:
| Riverbend: | 8.2% (33) |
| Washington: | 6.8% (92,720) |
9:00 a.m. to 9:59 a.m. - Females:
| Riverbend: | 3.3% (13) |
| Washington: | 8.8% (119,802) |
10:00 a.m. to 10:59 a.m. - Females:
| Riverbend: | 12.1% (48) |
| Washington: | 4.6% (61,816) |
11:00 a.m. to 11:59 a.m. - Females:
| Riverbend: | 4.2% (17) |
| Washington: | 2.0% (27,550) |
Travel time to work
Percentage of workers working in this county: 100.0%
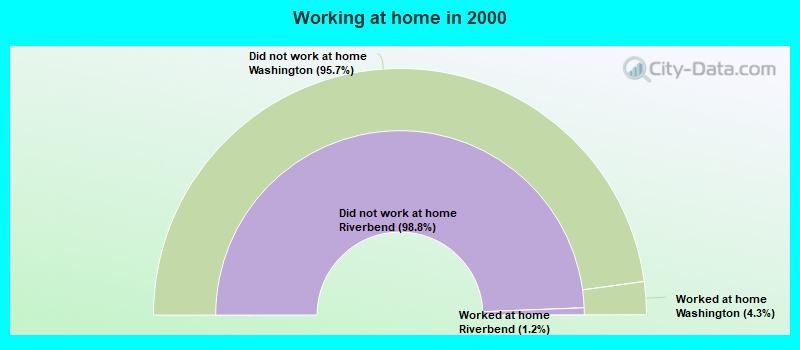
Number of people working at home: 142 (11.7% of all workers)
Number of people working at home: 142 (11.7% of all workers)
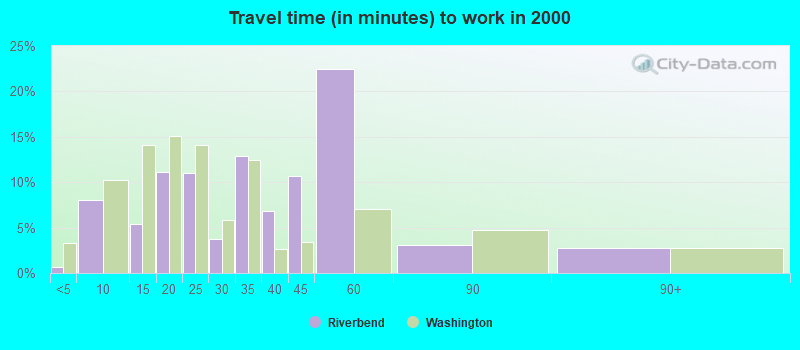
Less than 5 minutes:
| Riverbend: | 0.7% (8) |
| Washington: | 3.3% (91,132) |
5 to 9 minutes:
| Riverbend: | 8.1% (92) |
| Washington: | 10.3% (286,517) |
10 to 14 minutes:
| Riverbend: | 5.5% (62) |
| Washington: | 14.1% (391,606) |
15 to 19 minutes:
| Riverbend: | 11.1% (126) |
| Washington: | 15.0% (418,990) |
20 to 24 minutes:
| Riverbend: | 11.0% (125) |
| Washington: | 14.2% (394,209) |
25 to 29 minutes:
| Riverbend: | 3.7% (42) |
| Washington: | 5.8% (162,590) |
30 to 34 minutes:
| Riverbend: | 12.9% (147) |
| Washington: | 12.5% (348,311) |
35 to 39 minutes:
| Riverbend: | 6.9% (78) |
| Washington: | 2.6% (73,592) |
40 to 44 minutes:
| Riverbend: | 10.7% (122) |
| Washington: | 3.4% (95,182) |
45 to 59 minutes:
| Riverbend: | 22.4% (255) |
| Washington: | 7.0% (195,343) |
60 to 89 minutes:
| Riverbend: | 3.1% (35) |
| Washington: | 4.7% (131,691) |
90 or more minutes:
| Riverbend: | 2.7% (31) |
| Washington: | 2.7% (75,486) |
Means of transportation to work
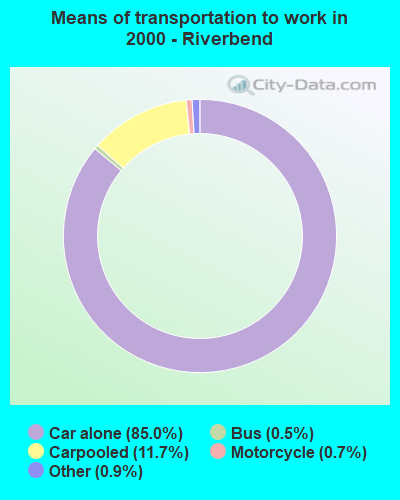

Drove car alone:
| Riverbend: | 85.0% (966) |
| Washington: | 73.3% (2,040,833) |
Carpooled:
| Riverbend: | 11.7% (133) |
| Washington: | 12.8% (357,742) |
Bus or trolley bus:
| Riverbend: | 0.5% (6) |
| Washington: | 4.5% (124,450) |
Motorcycle:
| Riverbend: | 0.7% (8) |
| Washington: | 0.2% (4,353) |
Other means:
| Riverbend: | 0.9% (10) |
| Washington: | 0.7% (19,499) |
Private vehicle occupancy
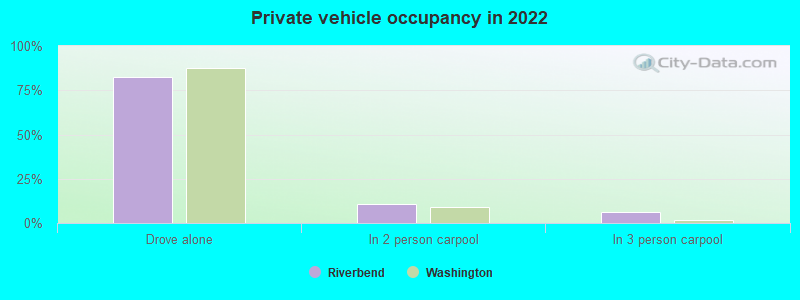
Drove alone:
| Riverbend: | 82.7% (769) |
| Washington: | 87.8% (2,415,775) |
In 2 person carpool:
| Riverbend: | 10.9% (102) |
| Washington: | 9.2% (252,715) |
In 3 person carpool:
| Riverbend: | 6.4% (59) |
| Washington: | 1.6% (44,943) |
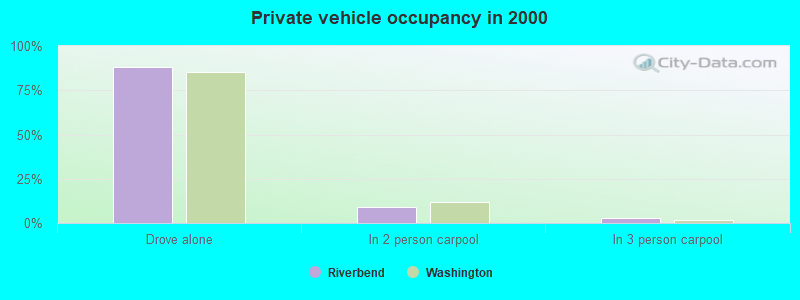
Drove alone:
| Riverbend: | 87.9% (966) |
| Washington: | 85.1% (2,040,833) |
In 2 person carpool:
| Riverbend: | 9.3% (102) |
| Washington: | 11.8% (282,638) |
In 3 person carpool:
| Riverbend: | 2.8% (31) |
| Washington: | 1.9% (44,791) |
Class of workers
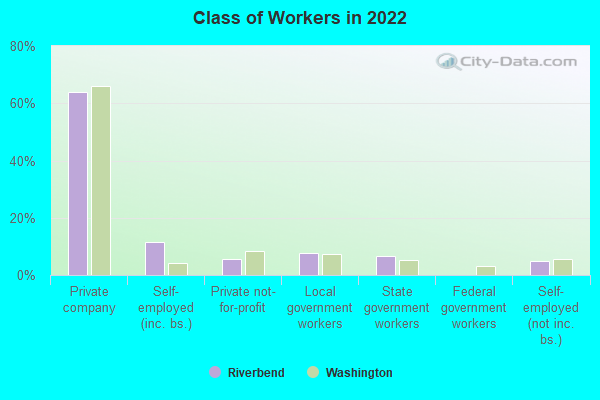
Employee of private company:
| Riverbend: | 63.9% (773) |
| Washington: | 66.0% (2,552,907) |
Self-employed in own incorporated business:
| Riverbend: | 11.5% (139) |
| Washington: | 4.2% (161,426) |
Private not-for-profit wage and salary workers:
| Riverbend: | 5.6% (67) |
| Washington: | 8.6% (330,637) |
Local government workers:
| Riverbend: | 7.5% (91) |
| Washington: | 7.3% (281,034) |
State government workers:
| Riverbend: | 6.5% (79) |
| Washington: | 5.2% (201,670) |
Self-employed workers in own not incorporated business:
| Riverbend: | 5.0% (60) |
| Washington: | 5.5% (212,937) |
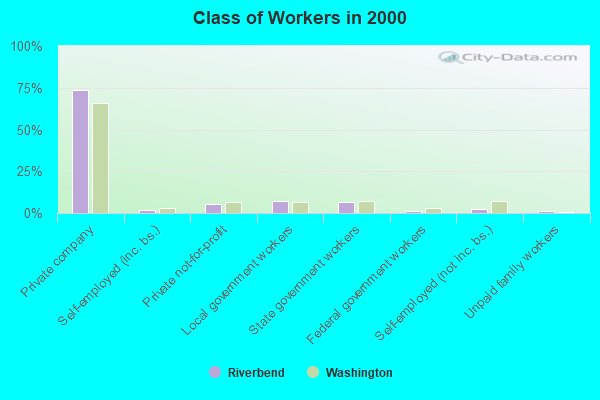
Employee of private company:
| Riverbend: | 73.7% (862) |
| Washington: | 66.0% (1,843,000) |
Self-employed in own incorporated business:
| Riverbend: | 1.9% (22) |
| Washington: | 3.2% (90,102) |
Private not-for-profit wage and salary workers:
| Riverbend: | 5.6% (66) |
| Washington: | 6.9% (191,927) |
Local government workers:
| Riverbend: | 7.3% (85) |
| Washington: | 6.4% (178,161) |
State government workers:
| Riverbend: | 6.8% (79) |
| Washington: | 6.9% (192,408) |
Federal government workers:
| Riverbend: | 1.4% (16) |
| Washington: | 3.2% (89,153) |
Self-employed workers in own not incorporated business:
| Riverbend: | 2.5% (29) |
| Washington: | 7.2% (199,827) |
Unpaid family workers:
| Riverbend: | 0.9% (11) |
| Washington: | 0.3% (9,144) |
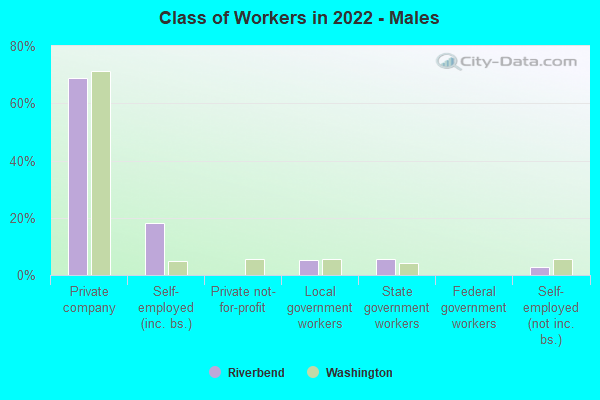
Employee of private company - Males:
| Riverbend: | 68.7% (470) |
| Washington: | 71.1% (1,491,511) |
Self-employed in own incorporated business - Males:
| Riverbend: | 18.1% (124) |
| Washington: | 4.9% (103,049) |
Local government workers - Males:
| Riverbend: | 5.1% (35) |
| Washington: | 5.4% (114,033) |
State government workers - Males:
| Riverbend: | 5.5% (38) |
| Washington: | 4.1% (84,969) |
Self-employed workers in own not incorporated business - Males:
| Riverbend: | 2.7% (18) |
| Washington: | 5.4% (113,810) |
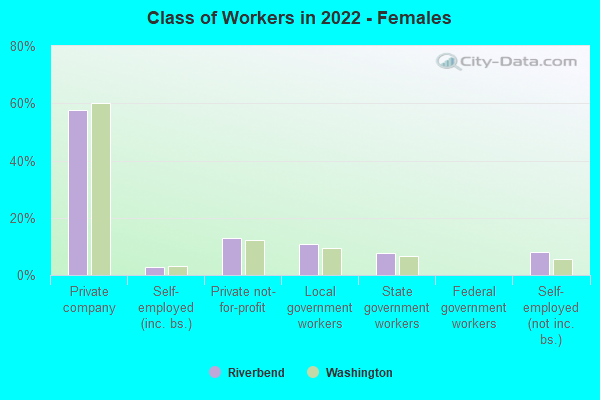
Employee of private company - Females:
| Riverbend: | 57.8% (303) |
| Washington: | 60.0% (1,061,396) |
Self-employed in own incorporated business - Females:
| Riverbend: | 2.9% (15) |
| Washington: | 3.3% (58,377) |
Private not-for-profit wage and salary workers - Females:
| Riverbend: | 12.8% (67) |
| Washington: | 12.1% (214,263) |
Local government workers - Females:
| Riverbend: | 10.7% (56) |
| Washington: | 9.4% (167,001) |
State government workers - Females:
| Riverbend: | 7.8% (41) |
| Washington: | 6.6% (116,701) |
Self-employed workers in own not incorporated business - Females:
| Riverbend: | 8.0% (42) |
| Washington: | 5.6% (99,127) |