Work and Jobs in Salina, New York (NY) Detailed Stats
Occupations, Industries, Unemployment, Workers, Commute
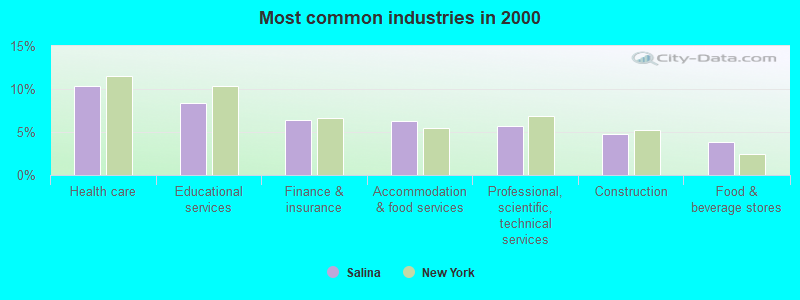
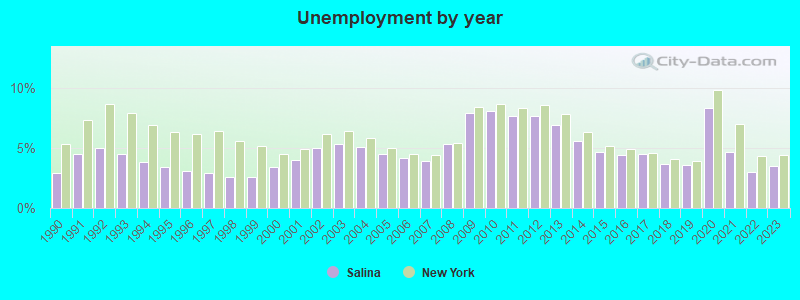
The unemployment rate in 2023 in Salina, NY was 3.5%, which was 25.7% less than the unemployment rate of 4.4% across the entire state of New York. Compared to the unemployment rate of 6.9% in 2013, this represents a decrease of 97.1%. The most common industries in Salina are: Health care (10.4% of civilian employees), Educational services (8.4% of civilian employees), Finance & insurance (6.4% of civilian employees). 70.2% of workers are employees of private companies, which is 9.3% greater than the rate of 63.7% across the entire state of New York.
Most common industries
Most common industries | |||
|---|---|---|---|
Industry | All | Males | Females |
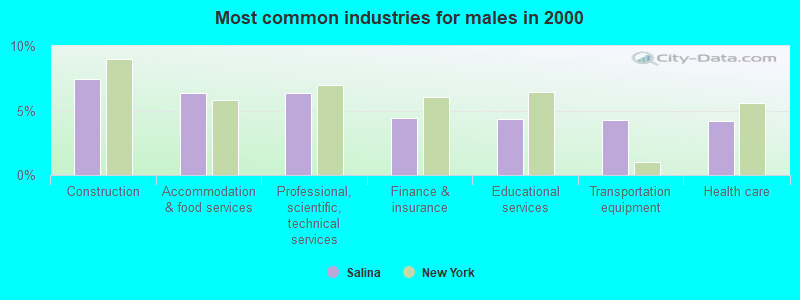
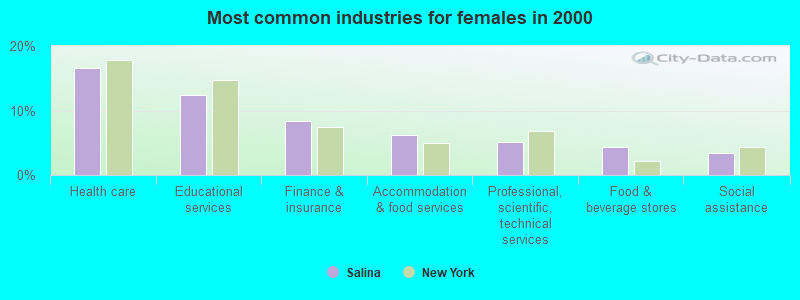
| Health care | 10.4% (1,748) | 4.2% (361) | 16.7% (1,387) |
| Educational services | 8.4% (1,411) | 4.4% (374) | 12.5% (1,037) |
| Finance and insurance | 6.4% (1,080) | 4.5% (381) | 8.4% (699) |
| Accommodation and food services | 6.3% (1,061) | 6.4% (544) | 6.2% (517) |
| Professional, scientific, and technical services | 5.7% (968) | 6.3% (542) | 5.1% (426) |
| Construction | 4.8% (806) | 7.4% (635) | 2.1% (171) |
| Food and beverage stores | 3.8% (646) | 3.3% (283) | 4.4% (363) |
| Public administration | 3.4% (570) | 3.3% (286) | 3.4% (284) |
| Transportation equipment | 2.5% (420) | 4.3% (367) | 0.6% (53) |
| Administrative and support and waste management services | 2.4% (397) | 2.5% (216) | 2.2% (181) |
| Machinery | 2.1% (346) | 3.2% (273) | 0.9% (73) |
| Metal and metal products | 2.0% (337) | 3.1% (262) | 0.9% (75) |
| Department and other general merchandise stores | 2.0% (331) | 1.2% (99) | 2.8% (232) |
| Social assistance | 1.8% (297) | 0.1% (8) | 3.5% (289) |
| Broadcasting and telecommunications | 1.7% (293) | 1.9% (161) | 1.6% (132) |
| Religious, grantmaking, civic, professional, and similar organizations | 1.7% (283) | 1.4% (120) | 2.0% (163) |
| Personal and laundry services | 1.6% (274) | 0.9% (74) | 2.4% (200) |
| Arts, entertainment, and recreation | 1.6% (264) | 1.3% (108) | 1.9% (156) |
| Other transportation, and support activities, and couriers | 1.6% (262) | 2.4% (202) | 0.7% (60) |
| Utilities | 1.5% (260) | 2.6% (223) | 0.4% (37) |
| Computer and electronic products | 1.4% (230) | 1.3% (108) | 1.5% (122) |
| Repair and maintenance | 1.4% (229) | 2.1% (181) | 0.6% (48) |
| Groceries and related products merchant wholesalers | 1.4% (228) | 1.7% (149) | 0.9% (79) |
| Real estate and rental and leasing | 1.3% (227) | 1.8% (155) | 0.9% (72) |
| U. S. Postal service | 1.3% (226) | 1.8% (156) | 0.8% (70) |
| Miscellaneous manufacturing | 1.3% (221) | 1.4% (123) | 1.2% (98) |
| Motor vehicle and parts dealers | 1.3% (211) | 2.2% (192) | 0.2% (19) |
| Building material and garden equipment and supplies dealers | 1.1% (180) | 1.3% (108) | 0.9% (72) |
| Publishing, and motion picture and sound recording industries | 1.0% (174) | 1.0% (86) | 1.1% (88) |
| Electrical equipment, appliances, and components | 1.0% (162) | 1.1% (94) | 0.8% (68) |
| Pharmacies and drug stores | 1.0% (161) | 0.8% (70) | 1.1% (91) |
| Clothing and accessories, including shoe, stores | 0.9% (148) | 0.6% (48) | 1.2% (100) |
| Truck transportation | 0.9% (147) | 1.6% (136) | 0.1% (11) |
| Machinery, equipment, and supplies merchant wholesalers | 0.9% (145) | 1.4% (117) | 0.3% (28) |
| Printing and related support activities | 0.8% (142) | 0.8% (69) | 0.9% (73) |
| Used merchandise, gift, novelty, and souvenir, and other miscellaneous stores | 0.6% (106) | 0.5% (42) | 0.8% (64) |
| Data processing, libraries, and other information services | 0.6% (105) | 0.4% (34) | 0.9% (71) |
| Chemicals | 0.6% (102) | 0.6% (53) | 0.6% (49) |
| Air transportation | 0.6% (99) | 0.7% (59) | 0.5% (40) |
| Food | 0.6% (97) | 1.0% (83) | 0.2% (14) |
| Plastics and rubber products | 0.5% (90) | 0.7% (63) | 0.3% (27) |
| Radio, TV, and computer stores | 0.5% (86) | 0.8% (65) | 0.3% (21) |
| Nonmetallic mineral products | 0.5% (82) | 0.4% (31) | 0.6% (51) |
| Other direct selling establishments | 0.5% (78) | 0.5% (45) | 0.4% (33) |
| Warehousing and storage | 0.5% (77) | 0.7% (56) | 0.3% (21) |
| Furniture and home furnishings, and household appliance stores | 0.4% (73) | 0.5% (46) | 0.3% (27) |
| Beverage and tobacco products | 0.4% (67) | 0.7% (61) | 0.1% (6) |
| Electrical and electronic goods merchant wholesalers | 0.4% (61) | 0.3% (26) | 0.4% (35) |
| Hardware, plumbing and heating equipment, and supplies merchant wholesalers | 0.3% (58) | 0.4% (35) | 0.3% (23) |
| Gasoline stations | 0.3% (53) | 0.4% (30) | 0.3% (23) |
| Professional and commercial equipment and supplies merchant wholesalers | 0.3% (52) | 0.5% (46) | 0.1% (6) |
| Drugs, sundries, and chemical and allied products merchant wholesalers | 0.3% (51) | 0.3% (23) | 0.3% (28) |
| Furniture and related product manufacturing | 0.3% (51) | 0.6% (51) | 0.0% (0) |
| Motor vehicles, parts and supplies merchant wholesalers | 0.3% (50) | 0.5% (45) | 0.1% (5) |
| Miscellaneous nondurable goods merchant wholesalers | 0.3% (48) | 0.4% (35) | 0.2% (13) |
| Sporting goods, camera, and hobby and toy stores | 0.3% (48) | 0.4% (30) | 0.2% (18) |
| Paper | 0.3% (47) | 0.5% (40) | 0.1% (7) |
| Office supplies and stationery stores | 0.2% (35) | 0.2% (17) | 0.2% (18) |
| Alcoholic beverages merchant wholesalers | 0.2% (32) | 0.4% (32) | 0.0% (0) |
| Music stores | 0.2% (29) | 0.3% (24) | 0.1% (5) |
| Book stores and news dealers | 0.2% (27) | 0.3% (27) | 0.0% (0) |
| Vending machine operators | 0.2% (26) | 0.2% (20) | 0.1% (6) |
| Lumber and other construction materials merchant wholesalers | 0.2% (26) | 0.1% (9) | 0.2% (17) |
| Private households | 0.1% (25) | 0.0% (0) | 0.3% (25) |
| Health and personal care, except drug, stores | 0.1% (23) | 0.1% (7) | 0.2% (16) |
| Sewing, needlework, and piece goods stores | 0.1% (21) | 0.0% (0) | 0.3% (21) |
| Textile mills and textile products | 0.1% (20) | 0.1% (5) | 0.2% (15) |
| Rail transportation | 0.1% (20) | 0.2% (20) | 0.0% (0) |
| Retail florists | 0.1% (20) | 0.0% (0) | 0.2% (20) |
| Wood products | 0.1% (17) | 0.2% (17) | 0.0% (0) |
| Apparel | 0.1% (17) | 0.0% (3) | 0.2% (14) |
| Petroleum and petroleum products merchant wholesalers | 0.1% (14) | 0.2% (14) | 0.0% (0) |
| Paper and paper products merchant wholesalers | 0.1% (12) | 0.1% (12) | 0.0% (0) |
Unemployment in Salina
- Unemployment by race in 2000
- Unemployment rate for White non-Hispanic residents
- 4.7%Males
- 3.2%Females
- Unemployment rate for Black residents
- 16.1%Males
- 4.3%Females
- Unemployment rate for Asian residents
- 4.5%Males
- 15.7%Females
- Unemployment rate for other race residents
- 31.0%Females
- Unemployment rate for two or more race residents
- 14.5%Males
- 9.2%Females
- Unemployment rate for Hispanic or Latino residents
- 8.4%Males
- 8.2%Females
Unemployment in 2023:
| Salina: | 3.5% |
| New York: | 4.4% |
Unemployment in 2022:
| Salina: | 3.0% |
| New York: | 4.3% |
Unemployment in 2021:
| Salina: | 4.7% |
| New York: | 7.0% |
Unemployment in 2020:
| Salina: | 8.3% |
| New York: | 9.8% |
Unemployment in 2019:
| Salina: | 3.6% |
| New York: | 3.9% |
Unemployment in 2018:
| Salina: | 3.7% |
| New York: | 4.1% |
Unemployment in 2017:
| Salina: | 4.5% |
| New York: | 4.6% |
Unemployment in 2016:
| Salina: | 4.4% |
| New York: | 4.9% |
Unemployment in 2015:
| Salina: | 4.7% |
| New York: | 5.2% |
Unemployment in 2014:
| Salina: | 5.6% |
| New York: | 6.3% |
Unemployment in 2013:
| Salina: | 6.9% |
| New York: | 7.8% |
Unemployment in 2012:
| Salina: | 7.7% |
| New York: | 8.6% |
Unemployment in 2011:
| Salina: | 7.7% |
| New York: | 8.3% |
Unemployment in 2010:
| Salina: | 8.1% |
| New York: | 8.7% |
Unemployment in 2009:
| Salina: | 7.9% |
| New York: | 8.4% |
Unemployment in 2008:
| Salina: | 5.3% |
| New York: | 5.4% |
Unemployment in 2007:
| Salina: | 3.9% |
| New York: | 4.4% |
Unemployment in 2006:
| Salina: | 4.2% |
| New York: | 4.5% |
Unemployment in 2005:
| Salina: | 4.5% |
| New York: | 5.0% |
Unemployment in 2004:
| Salina: | 5.1% |
| New York: | 5.8% |
Unemployment in 2003:
| Salina: | 5.3% |
| New York: | 6.4% |
Unemployment in 2002:
| Salina: | 5.0% |
| New York: | 6.2% |
Unemployment in 2001:
| Salina: | 4.0% |
| New York: | 4.9% |
Unemployment in 2000:
| Salina: | 3.4% |
| New York: | 4.5% |
Unemployment in 1999:
| Salina: | 2.6% |
| New York: | 5.2% |
Unemployment in 1998:
| Salina: | 2.6% |
| New York: | 5.6% |
Unemployment in 1997:
| Salina: | 2.9% |
| New York: | 6.4% |
Unemployment in 1996:
| Salina: | 3.1% |
| New York: | 6.2% |
Unemployment in 1995:
| Salina: | 3.4% |
| New York: | 6.3% |
Unemployment in 1994:
| Salina: | 3.8% |
| New York: | 6.9% |
Unemployment in 1993:
| Salina: | 4.5% |
| New York: | 7.9% |
Unemployment in 1992:
| Salina: | 5.0% |
| New York: | 8.7% |
Unemployment in 1991:
| Salina: | 4.5% |
| New York: | 7.3% |
Unemployment in 1990:
| Salina: | 2.9% |
| New York: | 5.3% |
Time leaving home to go to work
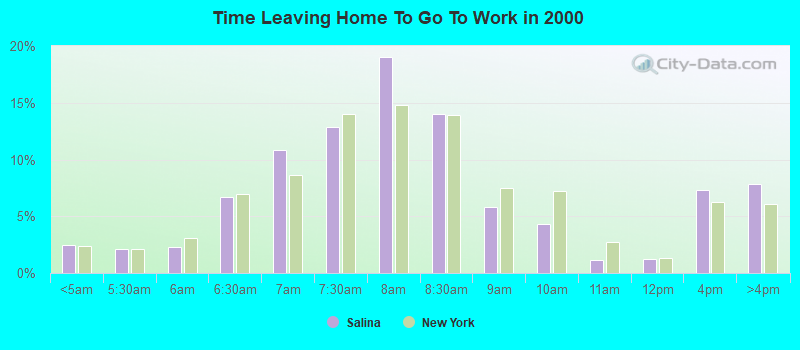
<5am:
| Salina: | 2.5% (405) |
| New York: | 2.4% (194,562) |
5:30am:
| Salina: | 2.1% (342) |
| New York: | 2.1% (174,328) |
6am:
| Salina: | 2.3% (379) |
| New York: | 3.1% (253,826) |
6:30am:
| Salina: | 6.7% (1,109) |
| New York: | 7.0% (573,349) |
7am:
| Salina: | 10.8% (1,784) |
| New York: | 8.6% (706,982) |
7:30am:
| Salina: | 12.8% (2,117) |
| New York: | 14.0% (1,147,579) |
8am:
| Salina: | 19.0% (3,141) |
| New York: | 14.8% (1,213,706) |
8:30am:
| Salina: | 14.0% (2,308) |
| New York: | 13.9% (1,144,298) |
9am:
| Salina: | 5.8% (962) |
| New York: | 7.5% (614,475) |
10am:
| Salina: | 4.3% (707) |
| New York: | 7.2% (593,377) |
11am:
| Salina: | 1.2% (196) |
| New York: | 2.7% (224,011) |
12pm:
| Salina: | 1.2% (205) |
| New York: | 1.3% (105,049) |
4pm:
| Salina: | 7.3% (1,200) |
| New York: | 6.3% (517,309) |
>4pm:
| Salina: | 7.9% (1,295) |
| New York: | 6.1% (501,196) |
Travel time to work
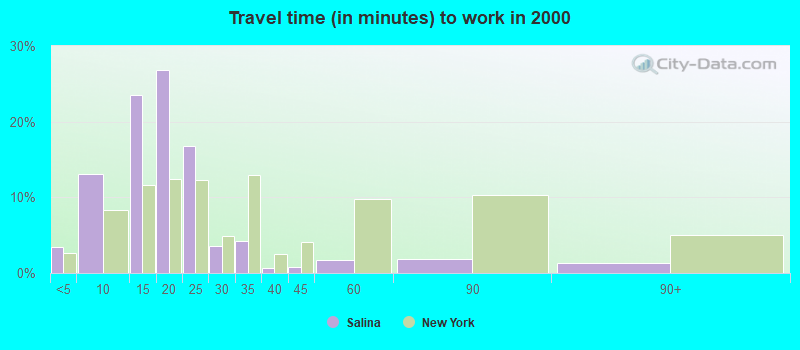
Less than 5 minutes:
| Salina: | 3.5% (575) |
| New York: | 2.7% (219,036) |
5 to 9 minutes:
| Salina: | 13.1% (2,156) |
| New York: | 8.3% (680,270) |
10 to 14 minutes:
| Salina: | 23.6% (3,889) |
| New York: | 11.6% (956,590) |
15 to 19 minutes:
| Salina: | 26.9% (4,435) |
| New York: | 12.4% (1,020,084) |
20 to 24 minutes:
| Salina: | 16.8% (2,776) |
| New York: | 12.3% (1,013,757) |
25 to 29 minutes:
| Salina: | 3.5% (581) |
| New York: | 4.9% (399,384) |
30 to 34 minutes:
| Salina: | 4.3% (704) |
| New York: | 12.9% (1,058,688) |
35 to 39 minutes:
| Salina: | 0.6% (102) |
| New York: | 2.5% (203,722) |
40 to 44 minutes:
| Salina: | 0.8% (128) |
| New York: | 4.1% (340,311) |
45 to 59 minutes:
| Salina: | 1.7% (277) |
| New York: | 9.8% (806,556) |
60 to 89 minutes:
| Salina: | 1.9% (311) |
| New York: | 10.3% (848,185) |
90 or more minutes:
| Salina: | 1.3% (216) |
| New York: | 5.1% (417,464) |
Means of transportation to work
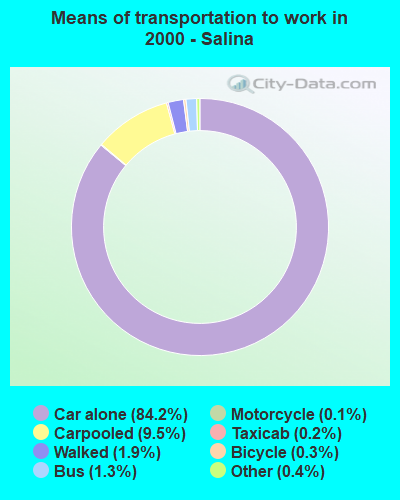

Drove car alone:
| Salina: | 84.2% (13,891) |
| New York: | 56.3% (4,620,178) |
Carpooled:
| Salina: | 9.5% (1,561) |
| New York: | 9.2% (756,918) |
Bus or trolley bus:
| Salina: | 1.3% (212) |
| New York: | 5.8% (475,389) |
Railroad:
| Salina: | 0.0% (6) |
| New York: | 2.8% (228,215) |
Taxicab:
| Salina: | 0.2% (25) |
| New York: | 0.8% (67,897) |
Motorcycle:
| Salina: | 0.1% (23) |
| New York: | 0.0% (3,625) |
Bicycle:
| Salina: | 0.3% (57) |
| New York: | 0.3% (25,036) |
Walked:
| Salina: | 1.9% (317) |
| New York: | 6.2% (511,721) |
Other means:
| Salina: | 0.4% (58) |
| New York: | 0.5% (40,375) |
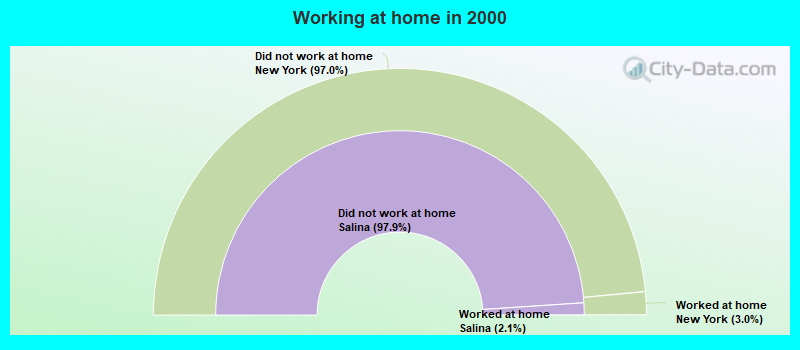
Private vehicle occupancy
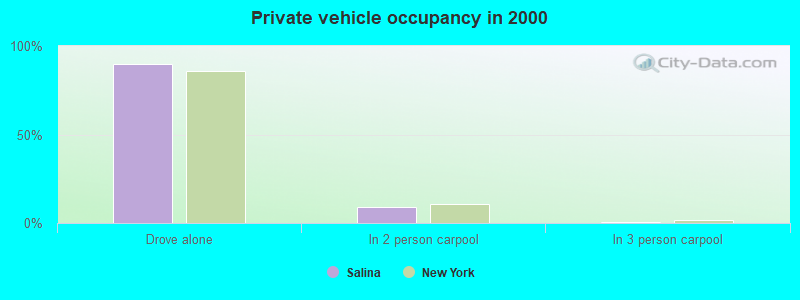
Drove alone:
| Salina: | 89.9% (13,891) |
| New York: | 85.9% (4,620,178) |
In 2 person carpool:
| Salina: | 9.0% (1,392) |
| New York: | 11.0% (590,255) |
In 3 person carpool:
| Salina: | 0.8% (129) |
| New York: | 1.8% (96,470) |
In 4 person carpool:
| Salina: | 0.2% (35) |
| New York: | 0.7% (36,112) |
In 5-6 person carpool:
| Salina: | 0.0% (5) |
| New York: | 0.3% (16,644) |
Class of workers
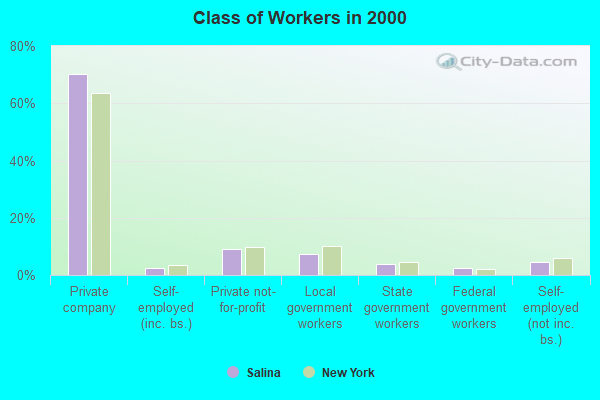
Employee of private company:
| Salina: | 70.2% (11,844) |
| New York: | 63.7% (5,340,134) |
Self-employed in own incorporated business:
| Salina: | 2.3% (394) |
| New York: | 3.4% (283,619) |
Private not-for-profit wage and salary workers:
| Salina: | 9.1% (1,531) |
| New York: | 9.7% (810,356) |
Local government workers:
| Salina: | 7.3% (1,238) |
| New York: | 10.2% (858,120) |
State government workers:
| Salina: | 3.9% (660) |
| New York: | 4.6% (383,673) |
Federal government workers:
| Salina: | 2.4% (409) |
| New York: | 2.2% (185,100) |
Self-employed workers in own not incorporated business:
| Salina: | 4.7% (790) |
| New York: | 6.0% (501,068) |
Unpaid family workers:
| Salina: | 0.0% (6) |
| New York: | 0.2% (20,918) |
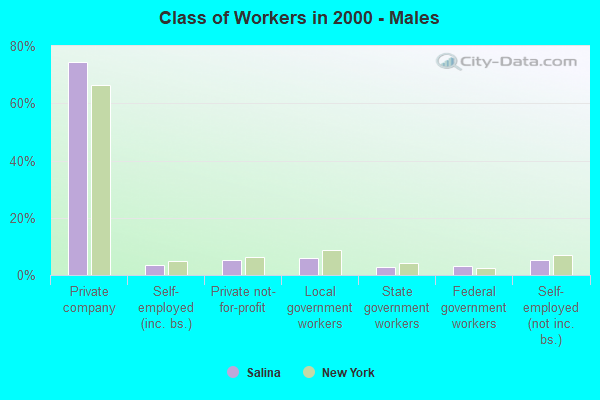
Employee of private company - Males:
| Salina: | 74.4% (6,359) |
| New York: | 66.2% (2,902,064) |
Self-employed in own incorporated business - Males:
| Salina: | 3.4% (292) |
| New York: | 4.9% (215,651) |
Private not-for-profit wage and salary workers - Males:
| Salina: | 5.3% (450) |
| New York: | 6.3% (277,787) |
Local government workers - Males:
| Salina: | 5.9% (503) |
| New York: | 8.7% (380,426) |
State government workers - Males:
| Salina: | 2.7% (227) |
| New York: | 4.1% (181,784) |
Federal government workers - Males:
| Salina: | 3.1% (262) |
| New York: | 2.3% (102,647) |
Self-employed workers in own not incorporated business - Males:
| Salina: | 5.3% (452) |
| New York: | 7.1% (312,497) |
Unpaid family workers - Males:
| Salina: | 0.0% (3) |
| New York: | 0.2% (9,470) |
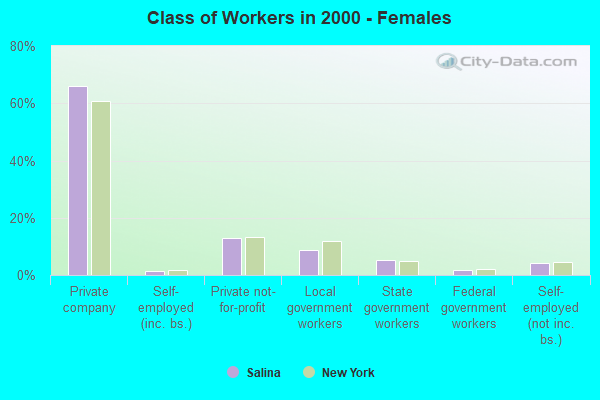
Employee of private company - Females:
| Salina: | 65.9% (5,485) |
| New York: | 60.9% (2,438,070) |
Self-employed in own incorporated business - Females:
| Salina: | 1.2% (102) |
| New York: | 1.7% (67,968) |
Private not-for-profit wage and salary workers - Females:
| Salina: | 13.0% (1,081) |
| New York: | 13.3% (532,569) |
Local government workers - Females:
| Salina: | 8.8% (735) |
| New York: | 11.9% (477,694) |
State government workers - Females:
| Salina: | 5.2% (433) |
| New York: | 5.0% (201,889) |
Federal government workers - Females:
| Salina: | 1.8% (147) |
| New York: | 2.1% (82,453) |
Self-employed workers in own not incorporated business - Females:
| Salina: | 4.1% (338) |
| New York: | 4.7% (188,571) |
Unpaid family workers - Females:
| Salina: | 0.0% (3) |
| New York: | 0.3% (11,448) |