Work and Jobs in Seagoville, Texas (TX) Detailed Stats
Occupations, Industries, Unemployment, Workers, Commute
Settings
X


Recent posts about work in Seagoville, Texas on our local forum with over 2,400,000 registered users:
 | What is the transition like moving from Phoenix, AZ to the DFW, TX? (48 replies) |
| Best suburbs drivable to Big Baylor Hospital... (28 replies) |
| Which location is best to buy a home in the Dallas area? (9 replies) |
| Coronavirus in DFW - News & Discussion (3109 replies) |
| Working in Seagoville, where to live? (5 replies) |
| What are some gay friendly towns near dallas texas? (30 replies) |
Latest news about work in Seagoville, TX collected exclusively by city-data.com from local newspapers, TV, and radio stations
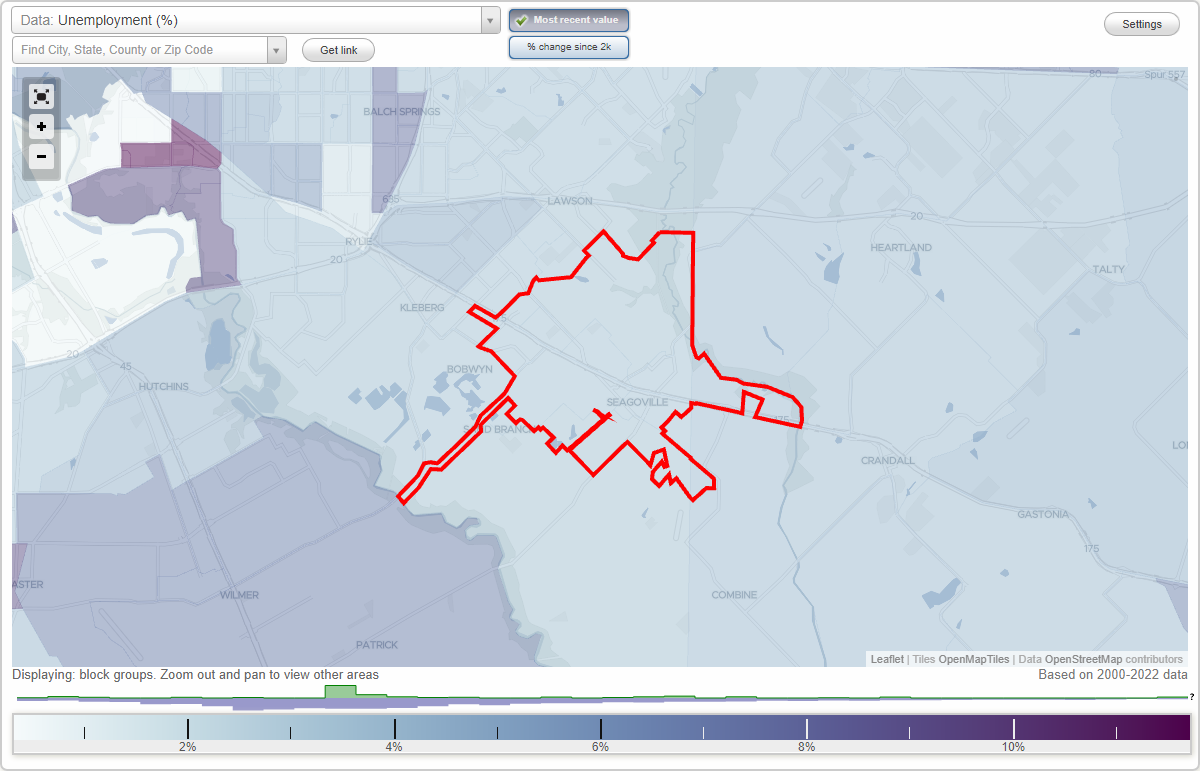
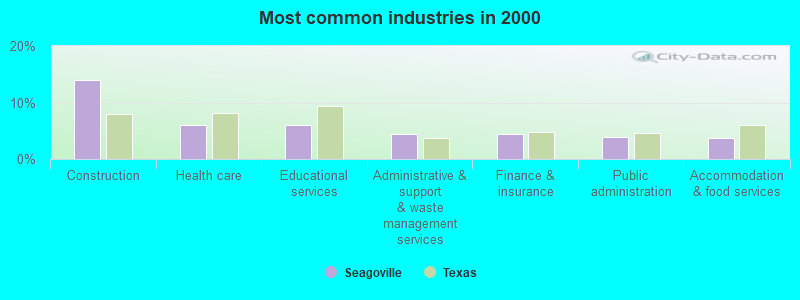
The most common industries in Seagoville are: Construction (14.0% of civilian employees), Health care (6.0% of civilian employees), Educational services (6.0% of civilian employees). 81.7% of workers work in Dallas County and 8.7% of all workers work at home. 74.9% of workers are employees of private companies, which is 7.1% greater than the rate of 69.6% across the entire state of Texas.
Whole page based on the data from 2000 / 2022 when the population of Seagoville, Texas was 10,823 / 18,635
Whole page based on the data from 2000 / 2022 when the population of Seagoville, Texas was 10,823 / 18,635
Most common industries
Most common industries | |||
|---|---|---|---|
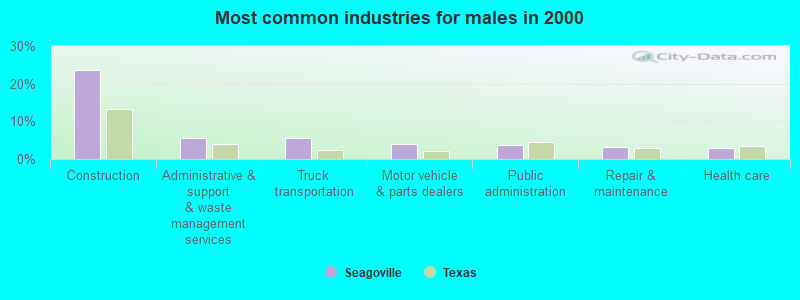
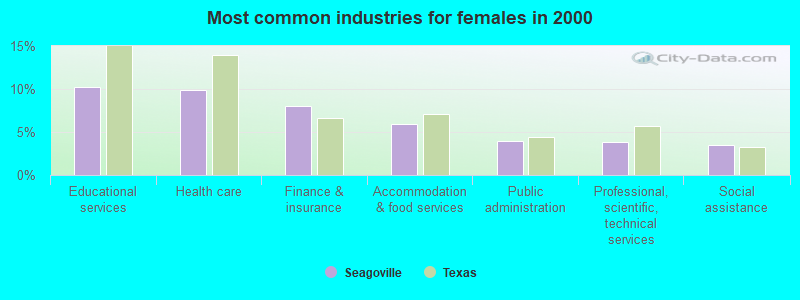
Industry | All | Males | Females |
| Construction | 14.0% (574) | 23.5% (531) | 2.3% (43) |
| Health care | 6.0% (247) | 2.9% (66) | 9.9% (181) |
| Educational services | 6.0% (247) | 2.6% (59) | 10.2% (188) |
| Administrative and support and waste management services | 4.5% (183) | 5.6% (126) | 3.1% (57) |
| Finance and insurance | 4.4% (179) | 1.4% (32) | 8.0% (147) |
| Public administration | 3.8% (156) | 3.7% (83) | 4.0% (73) |
| Accommodation and food services | 3.7% (151) | 1.9% (43) | 5.9% (108) |
| Truck transportation | 3.6% (146) | 5.5% (124) | 1.2% (22) |
| Professional, scientific, and technical services | 3.3% (137) | 2.9% (66) | 3.9% (71) |
| Broadcasting and telecommunications | 2.7% (109) | 2.6% (59) | 2.7% (50) |
| Motor vehicle and parts dealers | 2.5% (104) | 3.9% (87) | 0.9% (17) |
| Repair and maintenance | 2.1% (87) | 3.2% (72) | 0.8% (15) |
| Nonmetallic mineral products | 2.1% (87) | 1.7% (38) | 2.7% (49) |
| Food and beverage stores | 2.1% (85) | 1.7% (39) | 2.5% (46) |
| Religious, grantmaking, civic, professional, and similar organizations | 2.0% (81) | 1.7% (38) | 2.3% (43) |
| Department and other general merchandise stores | 1.9% (77) | 1.6% (37) | 2.2% (40) |
| Computer and electronic products | 1.9% (76) | 1.9% (44) | 1.7% (32) |
| Social assistance | 1.8% (74) | 0.4% (10) | 3.5% (64) |
| Utilities | 1.8% (74) | 2.4% (54) | 1.1% (20) |
| Other transportation, and support activities, and couriers | 1.7% (68) | 1.7% (38) | 1.6% (30) |
| Metal and metal products | 1.4% (58) | 2.3% (51) | 0.4% (7) |
| Lumber and other construction materials merchant wholesalers | 1.4% (57) | 1.1% (24) | 1.8% (33) |
| Air transportation | 1.4% (57) | 2.0% (45) | 0.7% (12) |
| Building material and garden equipment and supplies dealers | 1.3% (55) | 1.0% (22) | 1.8% (33) |
| Personal and laundry services | 1.2% (50) | 1.2% (27) | 1.3% (23) |
| Used merchandise, gift, novelty, and souvenir, and other miscellaneous stores | 1.0% (42) | 0.6% (13) | 1.6% (29) |
| Real estate and rental and leasing | 1.0% (41) | 0.8% (18) | 1.3% (23) |
| Groceries and related products merchant wholesalers | 1.0% (40) | 0.4% (9) | 1.7% (31) |
| Printing and related support activities | 1.0% (40) | 0.9% (21) | 1.0% (19) |
| Private households | 1.0% (39) | 0.0% (0) | 2.1% (39) |
| Radio, TV, and computer stores | 0.9% (37) | 0.5% (12) | 1.4% (25) |
| Arts, entertainment, and recreation | 0.9% (35) | 0.0% (0) | 1.9% (35) |
| Beverage and tobacco products | 0.8% (31) | 1.4% (31) | 0.0% (0) |
| Textile mills and textile products | 0.8% (31) | 0.0% (0) | 1.7% (31) |
| Furniture and home furnishings, and household appliance stores | 0.8% (31) | 0.7% (16) | 0.8% (15) |
| Drugs, sundries, and chemical and allied products merchant wholesalers | 0.8% (31) | 1.4% (31) | 0.0% (0) |
| U. S. Postal service | 0.7% (29) | 0.5% (12) | 0.9% (17) |
| Miscellaneous durable goods merchant wholesalers | 0.6% (25) | 0.4% (10) | 0.8% (15) |
| Miscellaneous manufacturing | 0.6% (25) | 1.1% (25) | 0.0% (0) |
| Machinery | 0.6% (24) | 0.5% (11) | 0.7% (13) |
| Clothing and accessories, including shoe, stores | 0.6% (24) | 0.7% (16) | 0.4% (8) |
| Metals and minerals, except petroleum, merchant wholesalers | 0.6% (23) | 0.7% (15) | 0.4% (8) |
| Jewelry, luggage, and leather goods stores | 0.5% (22) | 1.0% (22) | 0.0% (0) |
| Motor vehicles, parts and supplies merchant wholesalers | 0.5% (21) | 0.9% (21) | 0.0% (0) |
| Publishing, and motion picture and sound recording industries | 0.5% (19) | 0.8% (19) | 0.0% (0) |
| Furniture and related product manufacturing | 0.4% (18) | 0.8% (18) | 0.0% (0) |
| Machinery, equipment, and supplies merchant wholesalers | 0.4% (17) | 0.4% (9) | 0.4% (8) |
| Gasoline stations | 0.4% (16) | 0.4% (9) | 0.4% (7) |
| Food | 0.4% (15) | 0.3% (6) | 0.5% (9) |
| Wood products | 0.4% (15) | 0.4% (9) | 0.3% (6) |
| Chemicals | 0.4% (15) | 0.7% (15) | 0.0% (0) |
| Plastics and rubber products | 0.4% (15) | 0.0% (0) | 0.8% (15) |
| Transportation equipment | 0.4% (15) | 0.7% (15) | 0.0% (0) |
| Professional and commercial equipment and supplies merchant wholesalers | 0.3% (14) | 0.6% (14) | 0.0% (0) |
| Miscellaneous nondurable goods merchant wholesalers | 0.3% (14) | 0.6% (14) | 0.0% (0) |
| Data processing, libraries, and other information services | 0.3% (13) | 0.0% (0) | 0.7% (13) |
| Agriculture, forestry, fishing and hunting | 0.3% (11) | 0.5% (11) | 0.0% (0) |
| Other direct selling establishments | 0.2% (10) | 0.0% (0) | 0.5% (10) |
| Retail florists | 0.2% (10) | 0.0% (0) | 0.5% (10) |
| Water transportation | 0.2% (9) | 0.0% (0) | 0.5% (9) |
| Health and personal care, except drug, stores | 0.2% (9) | 0.0% (0) | 0.5% (9) |
| Pharmacies and drug stores | 0.2% (8) | 0.0% (0) | 0.4% (8) |
| Recyclable material merchant wholesalers | 0.2% (8) | 0.0% (0) | 0.4% (8) |
| Sewing, needlework, and piece goods stores | 0.2% (7) | 0.3% (7) | 0.0% (0) |
| Paper | 0.2% (7) | 0.3% (7) | 0.0% (0) |
| Electrical equipment, appliances, and components | 0.2% (7) | 0.0% (0) | 0.4% (7) |
| Electrical and electronic goods merchant wholesalers | 0.1% (6) | 0.0% (0) | 0.3% (6) |
| Alcoholic beverages merchant wholesalers | 0.1% (4) | 0.2% (4) | 0.0% (0) |
Unemployment in Seagoville
- Unemployment by race in 2022
- Unemployment rate for White non-Hispanic residents
- 7.6%Males
- Unemployment rate for Black residents
- 20.4%Males
- 8.0%Females
- Unemployment rate for other race residents
- 12.4%Males
- 13.5%Females
- Unemployment rate for Hispanic or Latino residents
- 4.5%Males
- 3.8%Females
- Unemployment by race in 2000
- Unemployment rate for White non-Hispanic residents
- 8.2%Males
- 7.8%Females
- Unemployment rate for Black residents
- 10.0%Males
- Unemployment rate for American Indian and Alaska Native residents
- 12.5%Males
- Unemployment rate for other race residents
- 11.4%Females
- Unemployment rate for two or more race residents
- 83.3%Males
- Unemployment rate for Hispanic or Latino residents
- 7.6%Females
Time leaving home to go to work
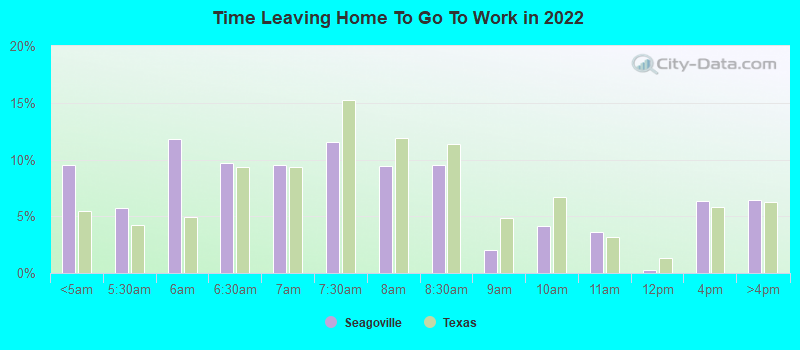
12:00 a.m. to 4:59 a.m.:
| Seagoville: | 9.6% (589) |
| Texas: | 5.5% (678,264) |
5:00 a.m. to 5:29 a.m.:
| Seagoville: | 5.8% (354) |
| Texas: | 4.3% (525,841) |
5:30 a.m. to 5:59 a.m.:
| Seagoville: | 11.8% (730) |
| Texas: | 4.9% (603,953) |
6:00 a.m. to 6:29 a.m.:
| Seagoville: | 9.7% (595) |
| Texas: | 9.4% (1,155,020) |
6:30 a.m. to 6:59 a.m.:
| Seagoville: | 9.5% (585) |
| Texas: | 9.3% (1,152,822) |
7:00 a.m. to 7:29 a.m.:
| Seagoville: | 11.6% (712) |
| Texas: | 15.3% (1,885,477) |
7:30 a.m. to 7:59 a.m.:
| Seagoville: | 9.4% (582) |
| Texas: | 11.9% (1,469,628) |
8:00 a.m. to 8:29 a.m.:
| Seagoville: | 9.5% (586) |
| Texas: | 11.3% (1,400,175) |
8:30 a.m. to 8:59 a.m.:
| Seagoville: | 2.0% (123) |
| Texas: | 4.9% (599,574) |
9:00 a.m. to 9:59 a.m.:
| Seagoville: | 4.1% (254) |
| Texas: | 6.7% (829,367) |
10:00 a.m. to 10:59 a.m.:
| Seagoville: | 3.6% (223) |
| Texas: | 3.2% (390,354) |
11:00 a.m. to 11:59 a.m.:
| Seagoville: | 0.2% (15) |
| Texas: | 1.3% (162,330) |
12:00 p.m. to 3:59 p.m.:
| Seagoville: | 6.3% (390) |
| Texas: | 5.8% (720,594) |
4:00 p.m. to 11:59 p.m.:
| Seagoville: | 6.4% (396) |
| Texas: | 6.3% (777,072) |
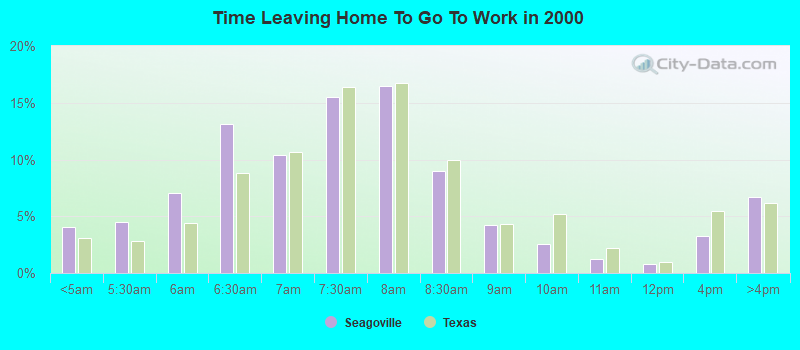
<5am:
| Seagoville: | 4.1% (162) |
| Texas: | 3.1% (281,361) |
5:30am:
| Seagoville: | 4.5% (179) |
| Texas: | 2.9% (262,060) |
6am:
| Seagoville: | 7.0% (278) |
| Texas: | 4.4% (403,423) |
6:30am:
| Seagoville: | 13.1% (520) |
| Texas: | 8.8% (808,876) |
7am:
| Seagoville: | 10.4% (412) |
| Texas: | 10.7% (976,557) |
7:30am:
| Seagoville: | 15.5% (615) |
| Texas: | 16.4% (1,500,904) |
8am:
| Seagoville: | 16.5% (653) |
| Texas: | 16.8% (1,536,308) |
8:30am:
| Seagoville: | 9.0% (357) |
| Texas: | 10.0% (913,601) |
9am:
| Seagoville: | 4.2% (167) |
| Texas: | 4.4% (398,656) |
10am:
| Seagoville: | 2.6% (102) |
| Texas: | 5.2% (472,592) |
11am:
| Seagoville: | 1.3% (50) |
| Texas: | 2.2% (197,844) |
12pm:
| Seagoville: | 0.8% (30) |
| Texas: | 0.9% (86,997) |
4pm:
| Seagoville: | 3.2% (128) |
| Texas: | 5.5% (503,565) |
>4pm:
| Seagoville: | 6.7% (267) |
| Texas: | 6.1% (563,107) |
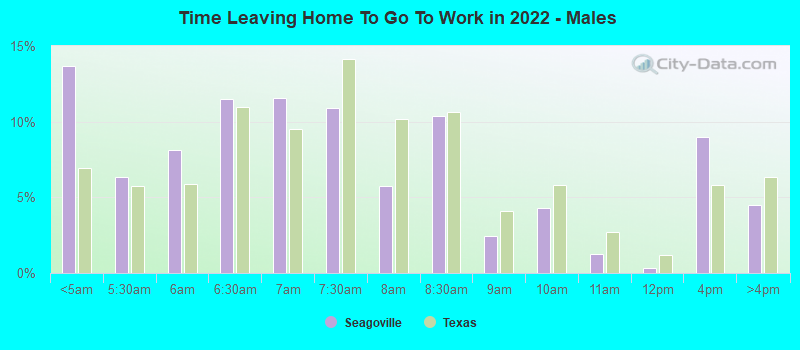
12:00 a.m. to 4:59 a.m. - Males:
| Seagoville: | 13.7% (535) |
| Texas: | 7.0% (477,284) |
5:00 a.m. to 5:29 a.m. - Males:
| Seagoville: | 6.3% (247) |
| Texas: | 5.8% (394,876) |
5:30 a.m. to 5:59 a.m. - Males:
| Seagoville: | 8.1% (317) |
| Texas: | 5.9% (402,788) |
6:00 a.m. to 6:29 a.m. - Males:
| Seagoville: | 11.5% (450) |
| Texas: | 10.9% (751,118) |
6:30 a.m. to 6:59 a.m. - Males:
| Seagoville: | 11.5% (451) |
| Texas: | 9.5% (652,306) |
7:00 a.m. to 7:29 a.m. - Males:
| Seagoville: | 10.9% (425) |
| Texas: | 14.1% (970,598) |
7:30 a.m. to 7:59 a.m. - Males:
| Seagoville: | 5.8% (225) |
| Texas: | 10.2% (696,429) |
8:00 a.m. to 8:29 a.m. - Males:
| Seagoville: | 10.4% (406) |
| Texas: | 10.6% (729,041) |
8:30 a.m. to 8:59 a.m. - Males:
| Seagoville: | 2.5% (96) |
| Texas: | 4.1% (281,762) |
9:00 a.m. to 9:59 a.m. - Males:
| Seagoville: | 4.3% (167) |
| Texas: | 5.8% (401,071) |
10:00 a.m. to 10:59 a.m. - Males:
| Seagoville: | 1.2% (48) |
| Texas: | 2.7% (186,469) |
11:00 a.m. to 11:59 a.m. - Males:
| Seagoville: | 0.3% (13) |
| Texas: | 1.2% (82,242) |
12:00 p.m. to 3:59 p.m. - Males:
| Seagoville: | 9.0% (351) |
| Texas: | 5.8% (397,795) |
4:00 p.m. to 11:59 p.m. - Males:
| Seagoville: | 4.5% (176) |
| Texas: | 6.4% (435,950) |
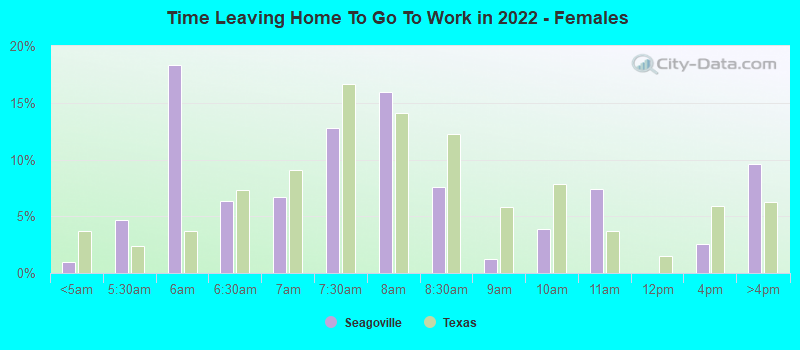
12:00 a.m. to 4:59 a.m. - Females:
| Seagoville: | 1.0% (23) |
| Texas: | 3.7% (200,980) |
5:00 a.m. to 5:29 a.m. - Females:
| Seagoville: | 4.7% (105) |
| Texas: | 2.4% (130,965) |
5:30 a.m. to 5:59 a.m. - Females:
| Seagoville: | 18.3% (414) |
| Texas: | 3.7% (201,165) |
6:00 a.m. to 6:29 a.m. - Females:
| Seagoville: | 6.3% (143) |
| Texas: | 7.4% (403,902) |
6:30 a.m. to 6:59 a.m. - Females:
| Seagoville: | 6.7% (151) |
| Texas: | 9.1% (500,516) |
7:00 a.m. to 7:29 a.m. - Females:
| Seagoville: | 12.7% (288) |
| Texas: | 16.7% (914,879) |
7:30 a.m. to 7:59 a.m. - Females:
| Seagoville: | 16.0% (360) |
| Texas: | 14.1% (773,199) |
8:00 a.m. to 8:29 a.m. - Females:
| Seagoville: | 7.6% (171) |
| Texas: | 12.2% (671,134) |
8:30 a.m. to 8:59 a.m. - Females:
| Seagoville: | 1.2% (28) |
| Texas: | 5.8% (317,812) |
9:00 a.m. to 9:59 a.m. - Females:
| Seagoville: | 3.9% (88) |
| Texas: | 7.8% (428,296) |
10:00 a.m. to 10:59 a.m. - Females:
| Seagoville: | 7.4% (167) |
| Texas: | 3.7% (203,885) |
12:00 p.m. to 3:59 p.m. - Females:
| Seagoville: | 2.5% (57) |
| Texas: | 5.9% (322,799) |
4:00 p.m. to 11:59 p.m. - Females:
| Seagoville: | 9.6% (218) |
| Texas: | 6.2% (341,122) |
Travel time to work
Percentage of workers working in this county: 81.7%
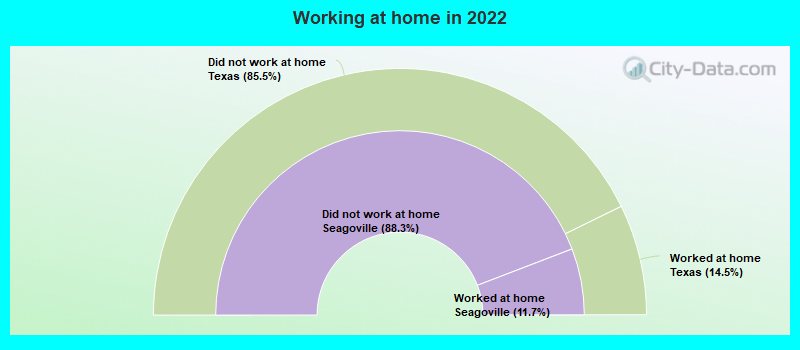
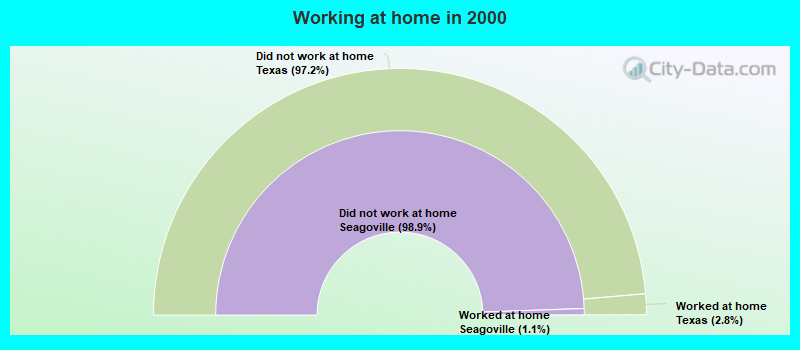
Number of people working at home: 613 (8.7% of all workers)
Daytime population change due to commuting: -1,352 (-12.5%)
Workers who live and work in this city: 607 (15.3%)
Number of people working at home: 613 (8.7% of all workers)
Daytime population change due to commuting: -1,352 (-12.5%)
Workers who live and work in this city: 607 (15.3%)
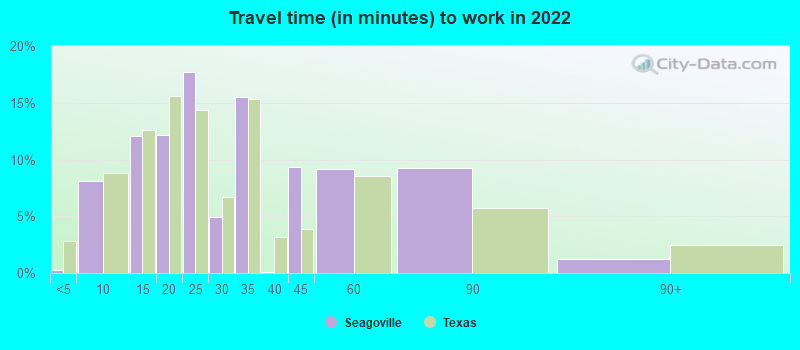
Less than 5 minutes:
| Seagoville: | 0.3% (11) |
| Texas: | 2.8% (350,462) |
5 to 9 minutes:
| Seagoville: | 8.1% (297) |
| Texas: | 8.8% (1,087,762) |
10 to 14 minutes:
| Seagoville: | 12.1% (444) |
| Texas: | 12.6% (1,550,271) |
15 to 19 minutes:
| Seagoville: | 12.1% (445) |
| Texas: | 15.6% (1,918,353) |
20 to 24 minutes:
| Seagoville: | 17.7% (649) |
| Texas: | 14.4% (1,772,079) |
25 to 29 minutes:
| Seagoville: | 4.9% (180) |
| Texas: | 6.7% (827,833) |
30 to 34 minutes:
| Seagoville: | 15.5% (570) |
| Texas: | 15.3% (1,887,878) |
35 to 39 minutes:
| Seagoville: | 0.1% (3) |
| Texas: | 3.2% (394,170) |
40 to 44 minutes:
| Seagoville: | 9.3% (343) |
| Texas: | 3.9% (476,118) |
45 to 59 minutes:
| Seagoville: | 9.1% (335) |
| Texas: | 8.6% (1,058,376) |
60 to 89 minutes:
| Seagoville: | 9.2% (339) |
| Texas: | 5.7% (706,002) |
90 or more minutes:
| Seagoville: | 1.3% (46) |
| Texas: | 2.4% (299,884) |
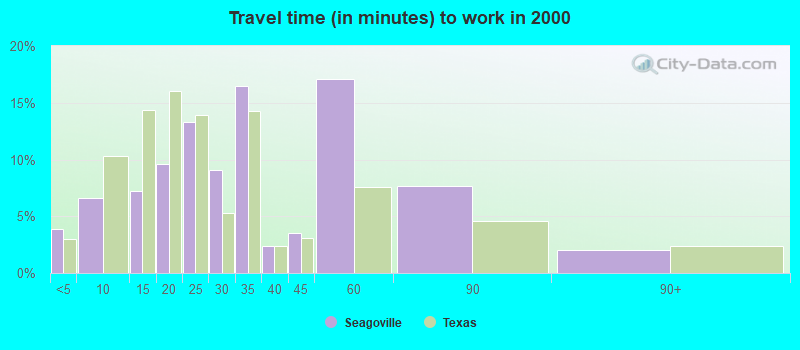
Less than 5 minutes:
| Seagoville: | 3.9% (153) |
| Texas: | 3.0% (277,642) |
5 to 9 minutes:
| Seagoville: | 6.6% (262) |
| Texas: | 10.3% (942,891) |
10 to 14 minutes:
| Seagoville: | 7.2% (285) |
| Texas: | 14.4% (1,317,555) |
15 to 19 minutes:
| Seagoville: | 9.6% (381) |
| Texas: | 16.0% (1,467,945) |
20 to 24 minutes:
| Seagoville: | 13.3% (529) |
| Texas: | 13.9% (1,276,781) |
25 to 29 minutes:
| Seagoville: | 9.1% (360) |
| Texas: | 5.3% (482,838) |
30 to 34 minutes:
| Seagoville: | 16.5% (653) |
| Texas: | 14.3% (1,309,699) |
35 to 39 minutes:
| Seagoville: | 2.4% (96) |
| Texas: | 2.4% (219,873) |
40 to 44 minutes:
| Seagoville: | 3.5% (140) |
| Texas: | 3.1% (280,916) |
45 to 59 minutes:
| Seagoville: | 17.1% (676) |
| Texas: | 7.6% (692,006) |
60 to 89 minutes:
| Seagoville: | 7.7% (305) |
| Texas: | 4.6% (418,905) |
90 or more minutes:
| Seagoville: | 2.0% (80) |
| Texas: | 2.4% (218,800) |
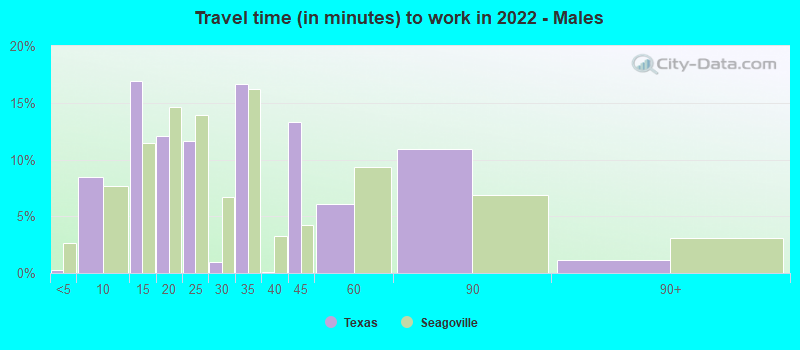
Less than 5 minutes - Males:
| Seagoville: | 0.3% (7) |
| Texas: | 2.7% (181,937) |
5 to 9 minutes - Males:
| Seagoville: | 8.5% (209) |
| Texas: | 7.6% (522,166) |
10 to 14 minutes - Males:
| Seagoville: | 16.9% (416) |
| Texas: | 11.5% (785,572) |
15 to 19 minutes - Males:
| Seagoville: | 12.1% (298) |
| Texas: | 14.6% (1,001,179) |
20 to 24 minutes - Males:
| Seagoville: | 11.6% (286) |
| Texas: | 13.9% (950,043) |
25 to 29 minutes - Males:
| Seagoville: | 1.0% (25) |
| Texas: | 6.7% (457,259) |
30 to 34 minutes - Males:
| Seagoville: | 16.6% (409) |
| Texas: | 16.2% (1,110,357) |
35 to 39 minutes - Males:
| Seagoville: | 0.1% (3) |
| Texas: | 3.3% (223,512) |
40 to 44 minutes - Males:
| Seagoville: | 13.3% (327) |
| Texas: | 4.2% (289,434) |
45 to 59 minutes - Males:
| Seagoville: | 6.0% (149) |
| Texas: | 9.3% (639,122) |
60 to 89 minutes - Males:
| Seagoville: | 10.9% (269) |
| Texas: | 6.8% (467,154) |
90 or more minutes - Males:
| Seagoville: | 1.2% (29) |
| Texas: | 3.1% (211,313) |
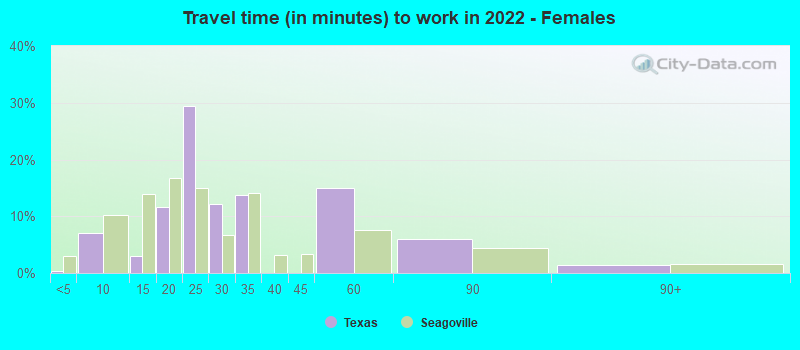
Less than 5 minutes - Females:
| Seagoville: | 0.4% (4) |
| Texas: | 3.1% (168,525) |
5 to 9 minutes - Females:
| Seagoville: | 7.0% (86) |
| Texas: | 10.3% (565,596) |
10 to 14 minutes - Females:
| Seagoville: | 3.1% (38) |
| Texas: | 13.9% (764,699) |
15 to 19 minutes - Females:
| Seagoville: | 11.6% (143) |
| Texas: | 16.7% (917,174) |
20 to 24 minutes - Females:
| Seagoville: | 29.4% (360) |
| Texas: | 15.0% (822,036) |
25 to 29 minutes - Females:
| Seagoville: | 12.2% (150) |
| Texas: | 6.7% (370,574) |
30 to 34 minutes - Females:
| Seagoville: | 13.7% (168) |
| Texas: | 14.2% (777,521) |
45 to 59 minutes - Females:
| Seagoville: | 15.0% (184) |
| Texas: | 7.6% (419,254) |
60 to 89 minutes - Females:
| Seagoville: | 5.9% (73) |
| Texas: | 4.4% (238,848) |
90 or more minutes - Females:
| Seagoville: | 1.3% (17) |
| Texas: | 1.6% (88,571) |
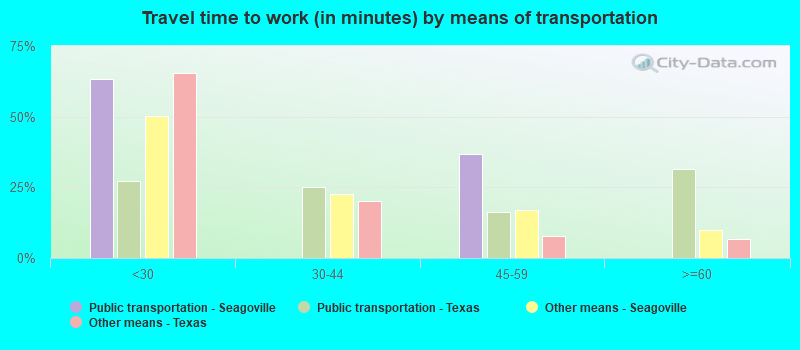
Means of transportation to work
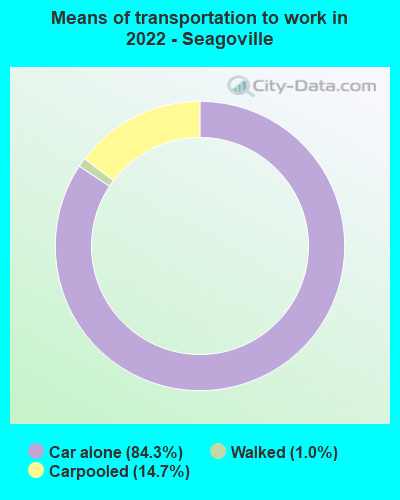

Drove car alone:
| Seagoville: | 84.3% (3,207) |
| Texas: | 83.3% (4,557,023) |
Carpooled:
| Seagoville: | 14.7% (560) |
| Texas: | 11.7% (674,818) |
Walked:
| Seagoville: | 1.0% (37) |
| Texas: | 1.7% (99,911) |
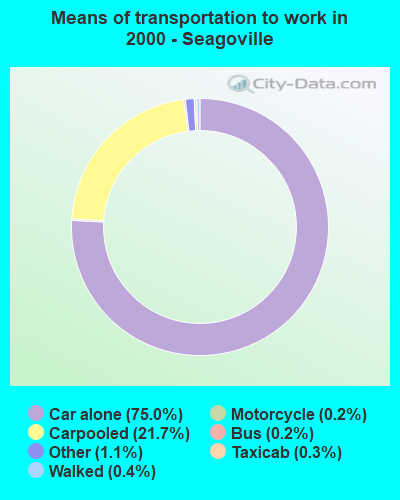

Drove car alone:
| Seagoville: | 75.0% (2,974) |
| Texas: | 77.7% (7,115,590) |
Carpooled:
| Seagoville: | 21.7% (860) |
| Texas: | 14.5% (1,326,012) |
Bus or trolley bus:
| Seagoville: | 0.2% (7) |
| Texas: | 1.7% (157,014) |
Taxicab:
| Seagoville: | 0.3% (12) |
| Texas: | 0.1% (6,102) |
Motorcycle:
| Seagoville: | 0.2% (6) |
| Texas: | 0.1% (12,068) |
Walked:
| Seagoville: | 0.4% (17) |
| Texas: | 1.9% (173,670) |
Other means:
| Seagoville: | 1.1% (44) |
| Texas: | 0.9% (86,692) |
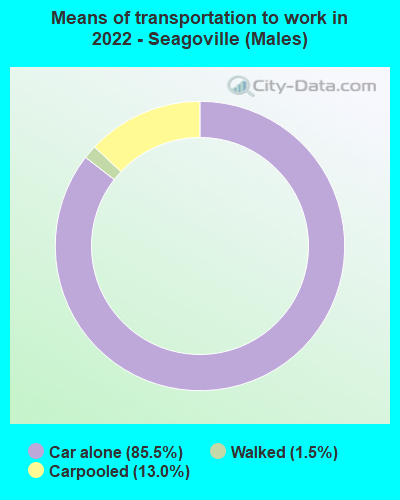

Drove car alone - Males:
| Seagoville: | 85.5% (2,163) |
| Texas: | 83.6% (4,557,023) |
Carpooled - Males:
| Seagoville: | 13.0% (329) |
| Texas: | 11.2% (674,818) |
Walked - Males:
| Seagoville: | 1.5% (37) |
| Texas: | 1.7% (99,911) |
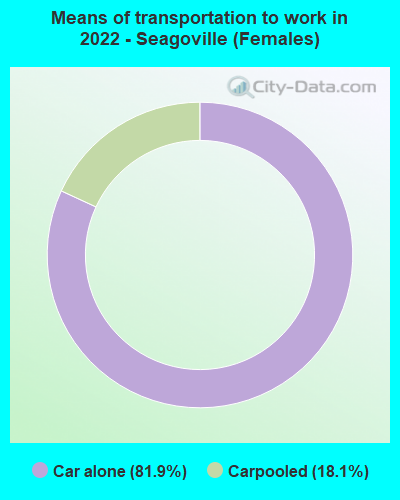

Drove car alone - Females:
| Seagoville: | 81.9% (1,051) |
| Texas: | 83.0% (4,557,023) |
Carpooled - Females:
| Seagoville: | 18.1% (232) |
| Texas: | 12.3% (674,818) |
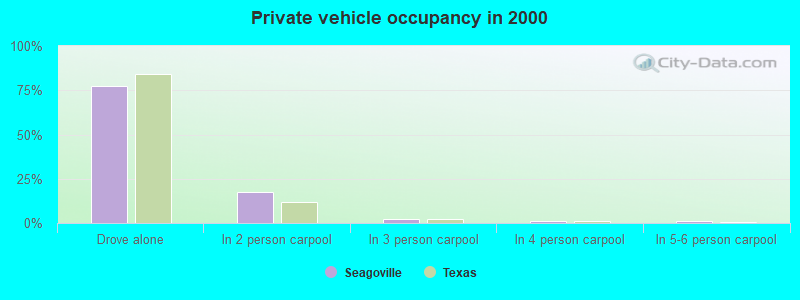
Private vehicle occupancy
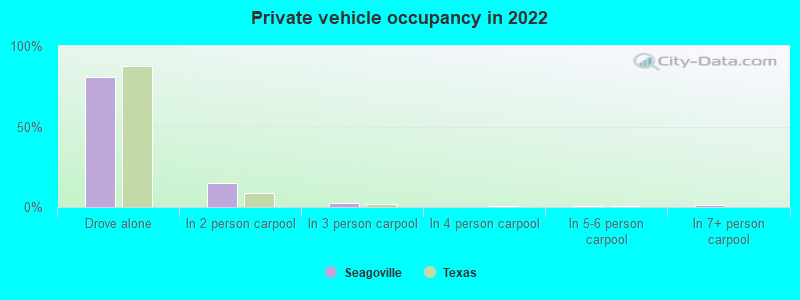
Drove alone:
| Seagoville: | 80.9% (4,912) |
| Texas: | 87.6% (10,283,021) |
In 2 person carpool:
| Seagoville: | 14.9% (904) |
| Texas: | 9.0% (1,052,595) |
In 3 person carpool:
| Seagoville: | 2.7% (162) |
| Texas: | 2.1% (244,139) |
In 5-6 person carpool:
| Seagoville: | 0.5% (32) |
| Texas: | 0.4% (44,947) |
In 7+ person carpool:
| Seagoville: | 1.0% (59) |
| Texas: | 0.1% (16,725) |
Drove alone:
| Seagoville: | 77.6% (2,974) |
| Texas: | 84.3% (7,115,590) |
In 2 person carpool:
| Seagoville: | 17.7% (678) |
| Texas: | 11.6% (982,994) |
In 3 person carpool:
| Seagoville: | 2.5% (94) |
| Texas: | 2.4% (201,602) |
In 4 person carpool:
| Seagoville: | 1.4% (54) |
| Texas: | 1.0% (83,518) |
In 5-6 person carpool:
| Seagoville: | 0.9% (34) |
| Texas: | 0.5% (40,662) |
Class of workers
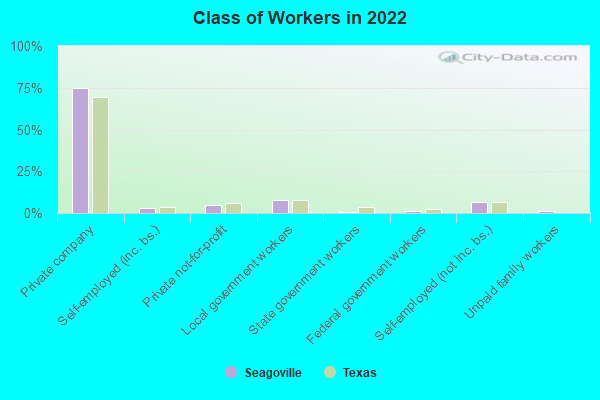
Employee of private company:
| Seagoville: | 74.9% (5,481) |
| Texas: | 69.6% (10,139,666) |
Self-employed in own incorporated business:
| Seagoville: | 2.9% (212) |
| Texas: | 3.5% (516,446) |
Private not-for-profit wage and salary workers:
| Seagoville: | 4.7% (342) |
| Texas: | 6.0% (870,454) |
Local government workers:
| Seagoville: | 7.7% (567) |
| Texas: | 7.6% (1,109,799) |
State government workers:
| Seagoville: | 0.7% (52) |
| Texas: | 3.8% (558,618) |
Federal government workers:
| Seagoville: | 1.1% (81) |
| Texas: | 2.5% (357,298) |
Self-employed workers in own not incorporated business:
| Seagoville: | 6.7% (488) |
| Texas: | 6.8% (998,270) |
Unpaid family workers:
| Seagoville: | 1.4% (99) |
| Texas: | 0.2% (27,882) |
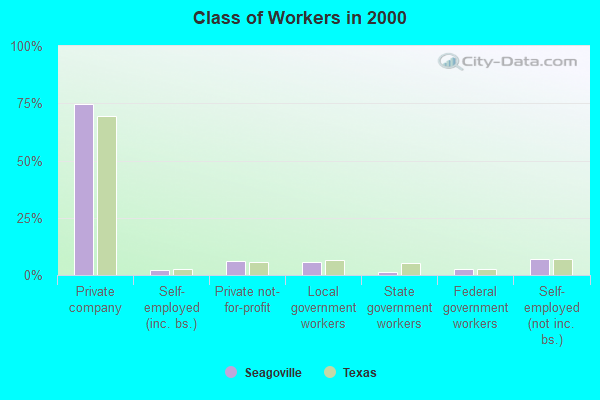
Employee of private company:
| Seagoville: | 74.7% (3,059) |
| Texas: | 69.6% (6,425,274) |
Self-employed in own incorporated business:
| Seagoville: | 2.4% (97) |
| Texas: | 2.7% (250,864) |
Private not-for-profit wage and salary workers:
| Seagoville: | 6.0% (244) |
| Texas: | 5.7% (526,631) |
Local government workers:
| Seagoville: | 5.9% (240) |
| Texas: | 6.6% (608,479) |
State government workers:
| Seagoville: | 1.4% (57) |
| Texas: | 5.4% (501,082) |
Federal government workers:
| Seagoville: | 2.5% (103) |
| Texas: | 2.6% (237,177) |
Self-employed workers in own not incorporated business:
| Seagoville: | 7.0% (285) |
| Texas: | 7.1% (653,527) |
Unpaid family workers:
| Seagoville: | 0.2% (9) |
| Texas: | 0.3% (31,338) |
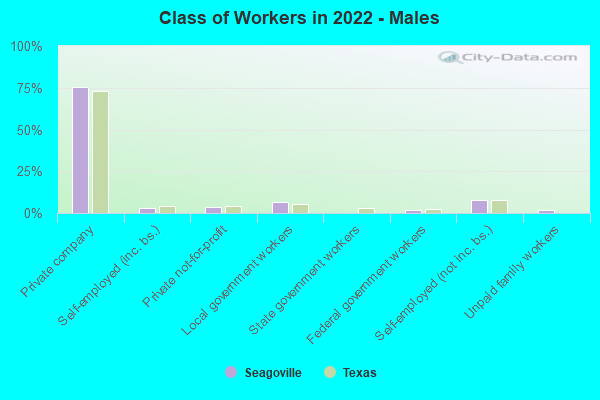
Employee of private company - Males:
| Seagoville: | 75.6% (3,297) |
| Texas: | 73.1% (5,788,450) |
Self-employed in own incorporated business - Males:
| Seagoville: | 2.8% (122) |
| Texas: | 4.2% (332,655) |
Private not-for-profit wage and salary workers - Males:
| Seagoville: | 3.9% (169) |
| Texas: | 4.1% (323,476) |
Local government workers - Males:
| Seagoville: | 6.3% (276) |
| Texas: | 5.1% (405,467) |
Federal government workers - Males:
| Seagoville: | 1.9% (81) |
| Texas: | 2.7% (211,629) |
Self-employed workers in own not incorporated business - Males:
| Seagoville: | 7.9% (345) |
| Texas: | 7.7% (609,246) |
Unpaid family workers - Males:
| Seagoville: | 1.6% (72) |
| Texas: | 0.2% (12,606) |
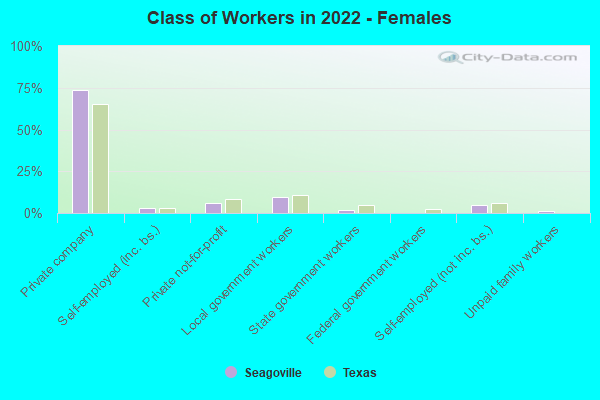
Employee of private company - Females:
| Seagoville: | 73.8% (2,184) |
| Texas: | 65.4% (4,351,216) |
Self-employed in own incorporated business - Females:
| Seagoville: | 3.0% (90) |
| Texas: | 2.8% (183,791) |
Private not-for-profit wage and salary workers - Females:
| Seagoville: | 5.8% (173) |
| Texas: | 8.2% (546,978) |
Local government workers - Females:
| Seagoville: | 9.8% (291) |
| Texas: | 10.6% (704,332) |
State government workers - Females:
| Seagoville: | 1.8% (52) |
| Texas: | 4.8% (321,912) |
Self-employed workers in own not incorporated business - Females:
| Seagoville: | 4.8% (143) |
| Texas: | 5.8% (389,024) |
Unpaid family workers - Females:
| Seagoville: | 0.9% (28) |
| Texas: | 0.2% (15,276) |