Work and Jobs in Shamrock, Texas (TX) Detailed Stats
Data:
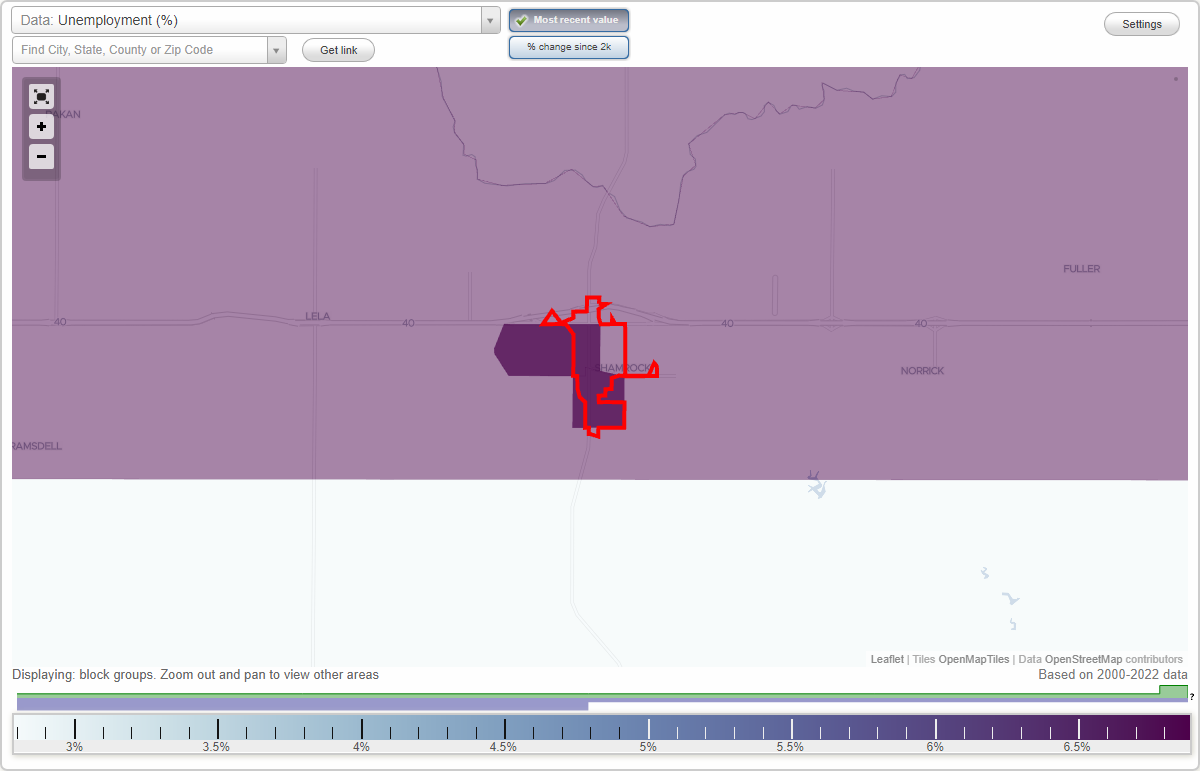
Unemployment (%)
Unemployment (% change since 2000)
Unemployment (%) - White
Unemployment (% change since 2000) - White
Unemployment (%) - Black or African American
Unemployment (% change since 2000) - Black or African American
Unemployment (%) - Asian
Unemployment (% change since 2000) - Asian
Unemployment (%) - Hispanic or Latino
Unemployment (% change since 2000) - Hispanic or Latino
Unemployment (%) - American Indian and Alaska Native
Unemployment (% change since 2000) - American Indian and Alaska Native
Unemployment (%) - Multirace
Unemployment (% change since 2000) - Multirace
Unemployment (%) - Other Race
Unemployment (% change since 2000) - Other Race
Industry diversity
Most Common Industries - Agriculture, forestry, fishing and hunting, and mining (%)
Most Common Industries - Agriculture, forestry, fishing and hunting (%)
Most Common Industries - Mining, quarrying, and oil and gas extraction (%)
Most Common Industries - Construction (%)
Most Common Industries - Manufacturing (%)
Most Common Industries - Wholesale trade (%)
Most Common Industries - Retail trade (%)
Most Common Industries - Transportation and warehousing, and utilities (%)
Most Common Industries - Transportation and warehousing (%)
Most Common Industries - Utilities (%)
Most Common Industries - Information (%)
Most Common Industries - Finance and insurance, and real estate and rental and leasing (%)
Most Common Industries - Finance and insurance (%)
Most Common Industries - Real estate and rental and leasing (%)
Most Common Industries - Professional, scientific, and management, and administrative and waste management services (%)
Most Common Industries - Professional, scientific, and technical services (%)
Most Common Industries - Management of companies and enterprises (%)
Most Common Industries - Administrative and support and waste management services (%)
Most Common Industries - Educational services, and health care and social assistance (%)
Most Common Industries - Educational services (%)
Most Common Industries - Health care and social assistance (%)
Most Common Industries - Arts, entertainment, and recreation, and accommodation and food services (%)
Most Common Industries - Arts, entertainment, and recreation (%)
Most Common Industries - Accommodation and food services (%)
Most Common Industries - Other services, except public administration (%)
Most Common Industries - Public administration (%)
Occupation diversity
Most Common Occupations - Management, business, science, and arts occupations (%)
Most Common Occupations - Management, business, and financial occupations (%)
Most Common Occupations - Management occupations (%)
Most Common Occupations - Business and financial operations occupations (%)
Most Common Occupations - Computer, engineering, and science occupations (%)
Most Common Occupations - Computer and mathematical occupations (%)
Most Common Occupations - Architecture and engineering occupations (%)
Most Common Occupations - Life, physical, and social science occupations (%)
Most Common Occupations - Education, legal, community service, arts, and media occupations (%)
Most Common Occupations - Community and social service occupations (%)
Most Common Occupations - Legal occupations (%)
Most Common Occupations - Education, training, and library occupations (%)
Most Common Occupations - Arts, design, entertainment, sports, and media occupations (%)
Most Common Occupations - Healthcare practitioners and technical occupations (%)
Most Common Occupations - Health diagnosing and treating practitioners and other technical occupations (%)
Most Common Occupations - Health technologists and technicians (%)
Most Common Occupations - Service occupations (%)
Most Common Occupations - Healthcare support occupations (%)
Most Common Occupations - Protective service occupations (%)
Most Common Occupations - Fire fighting and prevention, and other protective service workers including supervisors (%)
Most Common Occupations - Law enforcement workers including supervisors (%)
Most Common Occupations - Food preparation and serving related occupations (%)
Most Common Occupations - Building and grounds cleaning and maintenance occupations (%)
Most Common Occupations - Personal care and service occupations (%)
Most Common Occupations - Sales and office occupations (%)
Most Common Occupations - Sales and related occupations (%)
Most Common Occupations - Office and administrative support occupations (%)
Most Common Occupations - Natural resources, construction, and maintenance occupations (%)
Most Common Occupations - Farming, fishing, and forestry occupations (%)
Most Common Occupations - Construction and extraction occupations (%)
Most Common Occupations - Installation, maintenance, and repair occupations (%)
Most Common Occupations - Production, transportation, and material moving occupations (%)
Most Common Occupations - Production occupations (%)
Most Common Occupations - Transportation occupations (%)
Most Common Occupations - Material moving occupations (%)
Private vehicle occupancy - Drove alone (% change since 2000)
Private vehicle occupancy - Carpooled (%)
Private vehicle occupancy - Carpooled (% change since 2000)
Private vehicle occupancy - In 2-person carpool (%)
Private vehicle occupancy - In 2-person carpool (% change since 2000)
Private vehicle occupancy - In 3-person carpool (%)
Private vehicle occupancy - In 3-person carpool (% change since 2000)
Private vehicle occupancy - In 4-person carpool (%)
Private vehicle occupancy - In 4-person carpool (% change since 2000)
Private vehicle occupancy - In 5- or 6-person carpool (%)
Private vehicle occupancy - In 5- or 6-person carpool (% change since 2000)
Private vehicle occupancy - In 7-or-more-person carpool (%)
Private vehicle occupancy - In 7-or-more-person carpool (% change since 2000)
Time Leaving Home To Go To Work - 12:00 a.m. to 4:59 a.m. (%)
Time Leaving Home To Go To Work - 12:00 a.m. to 4:59 a.m. (% change since 2000)
Time Leaving Home To Go To Work - 5:00 a.m. to 5:59 a.m. (%)
Time Leaving Home To Go To Work - 5:00 a.m. to 5:59 a.m. (% change since 2000)
Time Leaving Home To Go To Work - 6:00 a.m. to 6:59 a.m. (%)
Time Leaving Home To Go To Work - 6:00 a.m. to 6:59 a.m. (% change since 2000)
Time Leaving Home To Go To Work - 7:00 a.m. to 7:59 a.m. (%)
Time Leaving Home To Go To Work - 7:00 a.m. to 7:59 a.m. (% change since 2000)
Time Leaving Home To Go To Work - 8:00 a.m. to 8:59 a.m. (%)
Time Leaving Home To Go To Work - 8:00 a.m. to 8:59 a.m. (% change since 2000)
Time Leaving Home To Go To Work - 9:00 a.m. to 9:59 a.m. (%)
Time Leaving Home To Go To Work - 9:00 a.m. to 9:59 a.m. (% change since 2000)
Time Leaving Home To Go To Work - 10:00 a.m. to 10:59 a.m. (%)
Time Leaving Home To Go To Work - 10:00 a.m. to 10:59 a.m. (% change since 2000)
Time Leaving Home To Go To Work - 11:00 a.m. to 11:59 a.m. (%)
Time Leaving Home To Go To Work - 11:00 a.m. to 11:59 a.m. (% change since 2000)
Time Leaving Home To Go To Work - 12:00 p.m. to 3:59 p.m. (%)
Time Leaving Home To Go To Work - 12:00 p.m. to 3:59 p.m. (% change since 2000)
Time Leaving Home To Go To Work - 4:00 p.m. to 11:59 p.m. (%)
Time Leaving Home To Go To Work - 4:00 p.m. to 11:59 p.m. (% change since 2000)
Class of Workers - Employee of private company (%)
Class of Workers - Employee of private company (% change since 2000)
Class of Workers - Self-employed in own incorporated business (%)
Class of Workers - Self-employed in own incorporated business (% change since 2000)
Class of Workers - Private not-for-profit wage and salary workers (%)
Class of Workers - Private not-for-profit wage and salary workers (% change since 2000)
Class of Workers - Local government workers (%)
Class of Workers - Local government workers (% change since 2000)
Class of Workers - State government workers (%)
Class of Workers - State government workers (% change since 2000)
Class of Workers - Federal government workers (%)
Class of Workers - Federal government workers (% change since 2000)
Class of Workers - Self-employed workers in own not incorporated business and Unpaid family workers (%)
Class of Workers - Self-employed workers in own not incorporated business and Unpaid family workers (% change since 2000)
Means of transportation to work - Drove car alone (%)
Means of transportation to work - Drove car alone (% change since 2000)
Means of transportation to work - Carpooled (%)
Means of transportation to work - Carpooled (% change since 2000)
Means of transportation to work - Public transportation (%)
Means of transportation to work - Public transportation (% change since 2000)
Means of transportation to work - Bus or trolley bus (%)
Means of transportation to work - Bus or trolley bus (% change since 2000)
Means of transportation to work - Streetcar or trolley car (%)
Means of transportation to work - Streetcar or trolley car (% change since 2000)
Means of transportation to work - Subway or elevated (%)
Means of transportation to work - Subway or elevated (% change since 2000)
Means of transportation to work - Railroad (%)
Means of transportation to work - Railroad (% change since 2000)
Means of transportation to work - Ferryboat (%)
Means of transportation to work - Ferryboat (% change since 2000)
Means of transportation to work - Taxicab (%)
Means of transportation to work - Taxicab (% change since 2000)
Means of transportation to work - Motorcycle (%)
Means of transportation to work - Motorcycle (% change since 2000)
Means of transportation to work - Bicycle (%)
Means of transportation to work - Bicycle (% change since 2000)
Means of transportation to work - Walked (%)
Means of transportation to work - Walked (% change since 2000)
Means of transportation to work - Other means (%)
Means of transportation to work - Other means (% change since 2000)
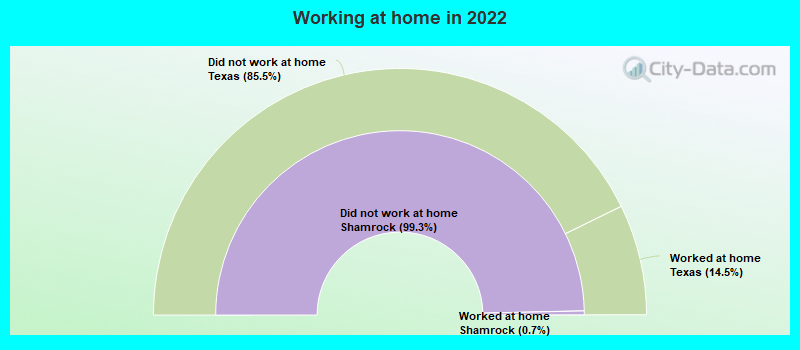
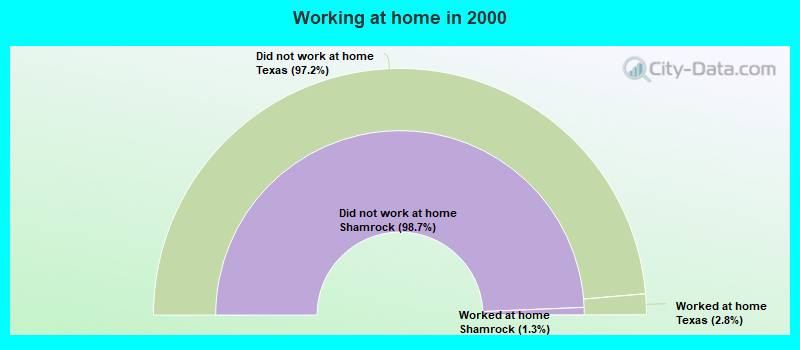
Working at home (%)
Working at home (% change since 2000)
Travel time to work - Less than 5 minutes (%)
Travel time to work - Less than 5 minutes (% change since 2000)
Travel time to work - 5 to 9 minutes (%)
Travel time to work - 5 to 9 minutes (% change since 2000)
Travel time to work - 10 to 19 minutes (%)
Travel time to work - 10 to 19 minutes (% change since 2000)
Travel time to work - 20 to 29 minutes (%)
Travel time to work - 20 to 29 minutes (% change since 2000)
Travel time to work - 30 to 39 minutes (%)
Travel time to work - 30 to 39 minutes (% change since 2000)
Travel time to work - 40 to 59 minutes (%)
Travel time to work - 40 to 59 minutes (% change since 2000)
Travel time to work - 60 to 89 minutes (%)
Travel time to work - 60 to 89 minutes (% change since 2000)
Travel time to work - 90 or more minutes (%)
Travel time to work - 90 or more minutes (% change since 2000)
Latest news about work in Shamrock, TX collected exclusively by city-data.com from local newspapers, TV, and radio stations
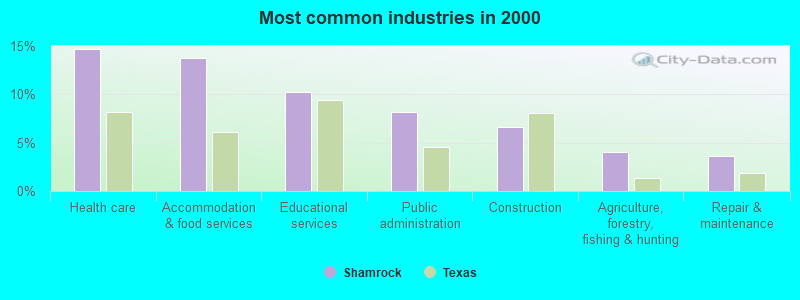
The most common industries in Shamrock are: Health care (14.7% of civilian employees), Accommodation & food services (13.7% of civilian employees), Educational services (10.2% of civilian employees). 80.4% of workers work in Wheeler County and 0.5% of all workers work at home. 62.1% of workers are employees of private companies, which is 11.9% less than the rate of 69.6% across the entire state of Texas.
Whole page based on the data from 2000 / 2022 when the population of Shamrock, Texas was 2,029 / 2,054
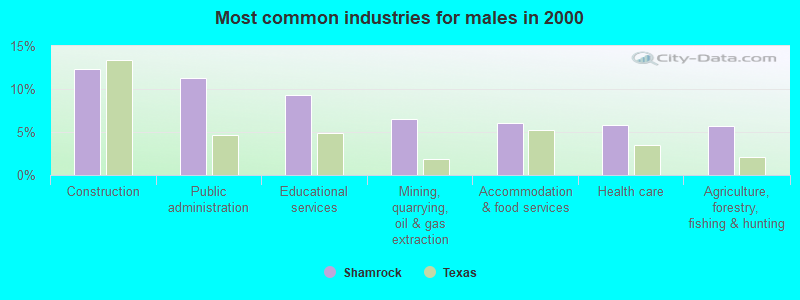
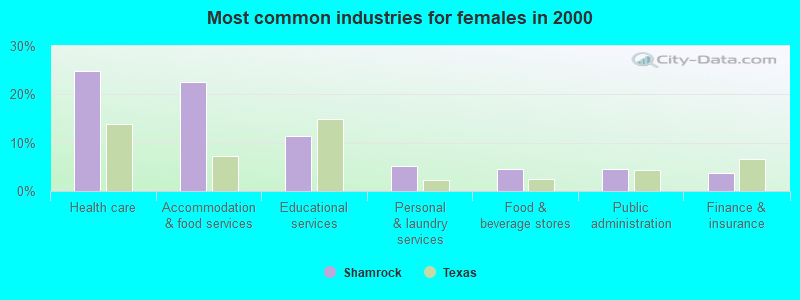
Most common industries
Most common industries Industry All Males Females
Health care 14.7% 5.9% 24.8% Accommodation and food services 13.7% 6.1% 22.6% Educational services 10.2% 9.3% 11.3% Public administration 8.1% 11.3% 4.5% Construction 6.6% 12.4% 0.0% Agriculture, forestry, fishing and hunting 4.1% 5.6% 2.3% Repair and maintenance 3.6% 5.0% 2.0% Mining, quarrying, and oil and gas extraction 3.5% 6.5% 0.0% Food and beverage stores 3.3% 2.2% 4.5% Farm supplies merchant wholesalers 2.8% 4.3% 1.0% Administrative and support and waste management services 2.6% 4.8% 0.0% Building material and garden equipment and supplies dealers 2.4% 4.6% 0.0% Broadcasting and telecommunications 2.4% 3.5% 1.3% Personal and laundry services 2.4% 0.0% 5.3% Finance and insurance 2.2% 0.9% 3.8% Gasoline stations 1.6% 2.4% 0.8% Social assistance 1.5% 0.0% 3.3% U. S. Postal service 1.5% 1.1% 2.0% Professional, scientific, and technical services 1.4% 1.3% 1.5% Farm product raw materials merchant wholesalers 1.3% 2.4% 0.0% Department and other general merchandise stores 0.9% 0.9% 1.0% Data processing, libraries, and other information services 0.9% 0.0% 2.0% Used merchandise, gift, novelty, and souvenir, and other miscellaneous stores 0.9% 0.0% 2.0% Food 0.7% 1.3% 0.0% Metal and metal products 0.7% 1.3% 0.0% Petroleum and petroleum products merchant wholesalers 0.6% 1.1% 0.0% Truck transportation 0.6% 1.1% 0.0% Chemicals 0.6% 1.1% 0.0% Other transportation, and support activities, and couriers 0.6% 0.0% 1.3% Apparel, fabrics, and notions merchant wholesalers 0.6% 1.1% 0.0% Jewelry, luggage, and leather goods stores 0.5% 0.0% 1.0% Sporting goods, camera, and hobby and toy stores 0.5% 0.0% 1.0% Machinery, equipment, and supplies merchant wholesalers 0.5% 0.9% 0.0% Arts, entertainment, and recreation 0.5% 0.0% 1.0% Miscellaneous nondurable goods merchant wholesalers 0.3% 0.7% 0.0% Miscellaneous manufacturing 0.2% 0.4% 0.0% Leather and allied products 0.2% 0.4% 0.0% Utilities 0.2% 0.4% 0.0%
Unemployment in Shamrock Unemployment by race in 2022
Unemployment rate for White non-Hispanic residents 3.2% FemalesUnemployment rate for Black residents 20.6% FemalesUnemployment rate for two or more race residents 37.1% MalesUnemployment rate for Hispanic or Latino residents 23.2% MalesUnemployment by race in 2000
Unemployment rate for White non-Hispanic residents 2.7% Males3.5% FemalesUnemployment rate for other race residents 7.3% MalesUnemployment rate for Hispanic or Latino residents 4.3% Males
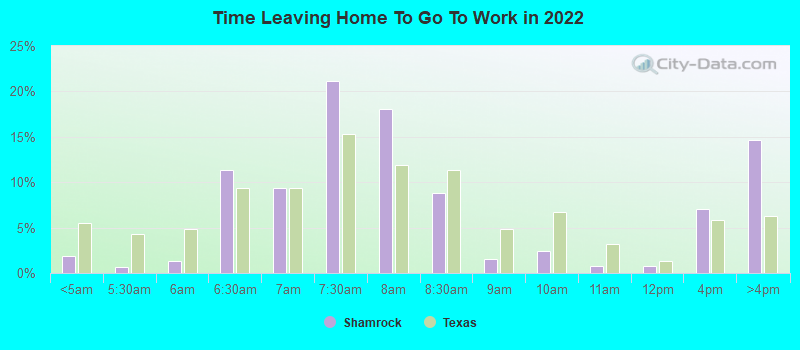
Time leaving home to go to work 12:00 a.m. to 4:59 a.m.: Shamrock:
1.9% (18)Texas:
5.5% (678,264)
5:00 a.m. to 5:29 a.m.: Shamrock:
0.6% (6)Texas:
4.3% (525,841)
5:30 a.m. to 5:59 a.m.: Shamrock:
1.3% (13)Texas:
4.9% (603,953)
6:00 a.m. to 6:29 a.m.: Shamrock:
11.3% (108)Texas:
9.4% (1,155,020)
6:30 a.m. to 6:59 a.m.: Shamrock:
9.4% (90)Texas:
9.3% (1,152,822)
7:00 a.m. to 7:29 a.m.: Shamrock:
21.1% (202)Texas:
15.3% (1,885,477)
7:30 a.m. to 7:59 a.m.: Shamrock:
18.0% (172)Texas:
11.9% (1,469,628)
8:00 a.m. to 8:29 a.m.: Shamrock:
8.8% (84)Texas:
11.3% (1,400,175)
8:30 a.m. to 8:59 a.m.: Shamrock:
1.5% (14)Texas:
4.9% (599,574)
9:00 a.m. to 9:59 a.m.: Shamrock:
2.4% (23)Texas:
6.7% (829,367)
10:00 a.m. to 10:59 a.m.: Shamrock:
0.8% (8)Texas:
3.2% (390,354)
11:00 a.m. to 11:59 a.m.: Shamrock:
0.7% (7)Texas:
1.3% (162,330)
12:00 p.m. to 3:59 p.m.: Shamrock:
7.0% (67)Texas:
5.8% (720,594)
4:00 p.m. to 11:59 p.m.: Shamrock:
14.7% (141)Texas:
6.3% (777,072)
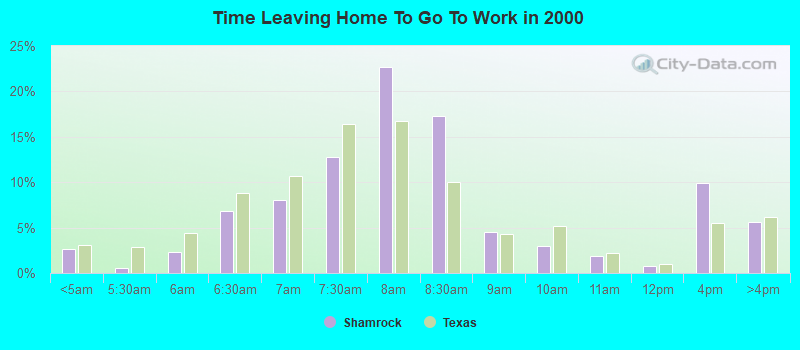
<5am: Shamrock:
2.6% (22)Texas:
3.1% (281,361)
5:30am: Shamrock:
0.6% (5)Texas:
2.9% (262,060)
6am: Shamrock:
2.4% (20)Texas:
4.4% (403,423)
6:30am: Shamrock:
6.8% (58)Texas:
8.8% (808,876)
7am: Shamrock:
8.0% (68)Texas:
10.7% (976,557)
7:30am: Shamrock:
12.8% (109)Texas:
16.4% (1,500,904)
8am: Shamrock:
22.7% (193)Texas:
16.8% (1,536,308)
8:30am: Shamrock:
17.3% (147)Texas:
10.0% (913,601)
9am: Shamrock:
4.5% (38)Texas:
4.4% (398,656)
10am: Shamrock:
2.9% (25)Texas:
5.2% (472,592)
11am: Shamrock:
1.9% (16)Texas:
2.2% (197,844)
12pm: Shamrock:
0.8% (7)Texas:
0.9% (86,997)
4pm: Shamrock:
9.9% (84)Texas:
5.5% (503,565)
>4pm: Shamrock:
5.6% (48)Texas:
6.1% (563,107)
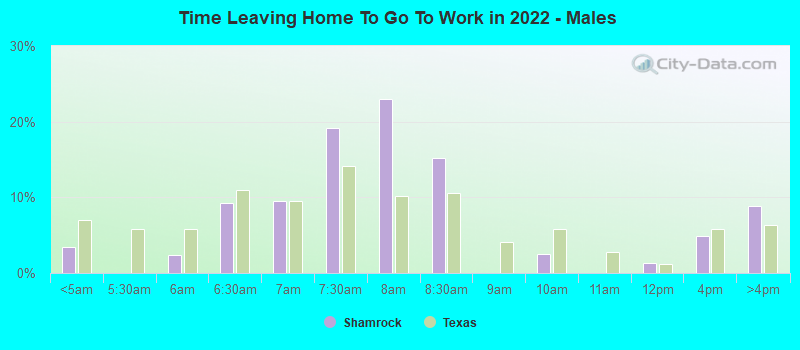
12:00 a.m. to 4:59 a.m. - Males: Shamrock:
3.4% (18)Texas:
7.0% (477,284)
5:30 a.m. to 5:59 a.m. - Males: Shamrock:
2.4% (13)Texas:
5.9% (402,788)
6:00 a.m. to 6:29 a.m. - Males: Shamrock:
9.2% (48)Texas:
10.9% (751,118)
6:30 a.m. to 6:59 a.m. - Males: Shamrock:
9.5% (50)Texas:
9.5% (652,306)
7:00 a.m. to 7:29 a.m. - Males: Shamrock:
19.1% (100)Texas:
14.1% (970,598)
7:30 a.m. to 7:59 a.m. - Males: Shamrock:
23.0% (121)Texas:
10.2% (696,429)
8:00 a.m. to 8:29 a.m. - Males: Shamrock:
15.1% (79)Texas:
10.6% (729,041)
9:00 a.m. to 9:59 a.m. - Males: Shamrock:
2.5% (13)Texas:
5.8% (401,071)
11:00 a.m. to 11:59 a.m. - Males: Shamrock:
1.4% (7)Texas:
1.2% (82,242)
12:00 p.m. to 3:59 p.m. - Males: Shamrock:
4.9% (26)Texas:
5.8% (397,795)
4:00 p.m. to 11:59 p.m. - Males: Shamrock:
8.9% (47)Texas:
6.4% (435,950)
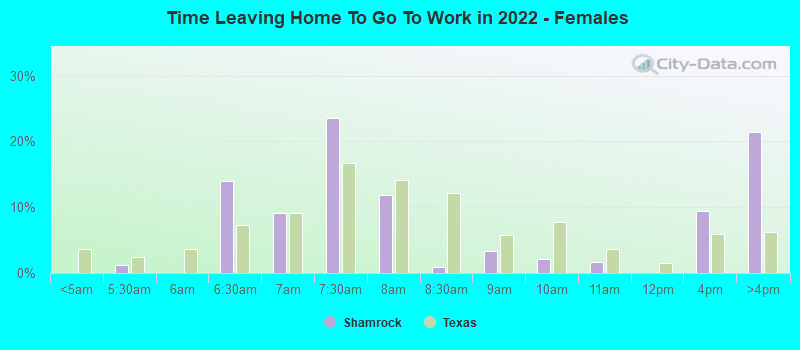
5:00 a.m. to 5:29 a.m. - Females: Shamrock:
1.3% (6)Texas:
2.4% (130,965)
6:00 a.m. to 6:29 a.m. - Females: Shamrock:
13.9% (60)Texas:
7.4% (403,902)
6:30 a.m. to 6:59 a.m. - Females: Shamrock:
9.2% (40)Texas:
9.1% (500,516)
7:00 a.m. to 7:29 a.m. - Females: Shamrock:
23.6% (102)Texas:
16.7% (914,879)
7:30 a.m. to 7:59 a.m. - Females: Shamrock:
11.9% (51)Texas:
14.1% (773,199)
8:00 a.m. to 8:29 a.m. - Females: Shamrock:
1.0% (4)Texas:
12.2% (671,134)
8:30 a.m. to 8:59 a.m. - Females: Shamrock:
3.3% (14)Texas:
5.8% (317,812)
9:00 a.m. to 9:59 a.m. - Females: Shamrock:
2.2% (9)Texas:
7.8% (428,296)
10:00 a.m. to 10:59 a.m. - Females: Shamrock:
1.7% (7)Texas:
3.7% (203,885)
12:00 p.m. to 3:59 p.m. - Females: Shamrock:
9.4% (41)Texas:
5.9% (322,799)
4:00 p.m. to 11:59 p.m. - Females: Shamrock:
21.4% (93)Texas:
6.2% (341,122)
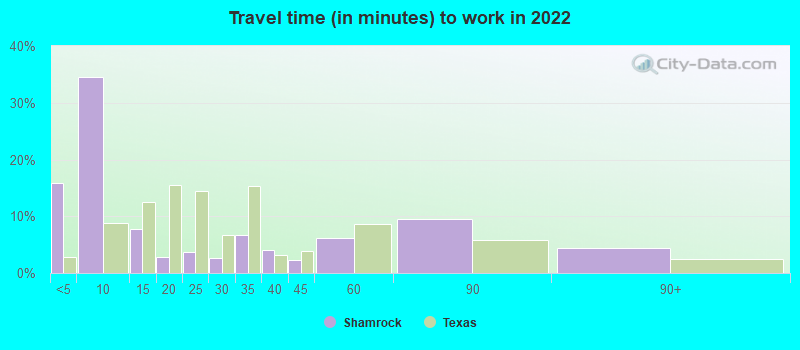
Travel time to work Percentage of workers working in this county: 80.4%Number of people working at home: 5 (0.5% of all workers )
Less than 5 minutes: Shamrock:
15.9% (110)Texas:
2.8% (350,462)
5 to 9 minutes: Shamrock:
34.5% (238)Texas:
8.8% (1,087,762)
10 to 14 minutes: Shamrock:
7.7% (54)Texas:
12.6% (1,550,271)
15 to 19 minutes: Shamrock:
2.8% (19)Texas:
15.6% (1,918,353)
20 to 24 minutes: Shamrock:
3.6% (25)Texas:
14.4% (1,772,079)
25 to 29 minutes: Shamrock:
2.7% (19)Texas:
6.7% (827,833)
30 to 34 minutes: Shamrock:
6.7% (46)Texas:
15.3% (1,887,878)
35 to 39 minutes: Shamrock:
4.0% (28)Texas:
3.2% (394,170)
40 to 44 minutes: Shamrock:
2.3% (16)Texas:
3.9% (476,118)
45 to 59 minutes: Shamrock:
6.2% (43)Texas:
8.6% (1,058,376)
60 to 89 minutes: Shamrock:
9.5% (66)Texas:
5.7% (706,002)
90 or more minutes: Shamrock:
4.4% (30)Texas:
2.4% (299,884)
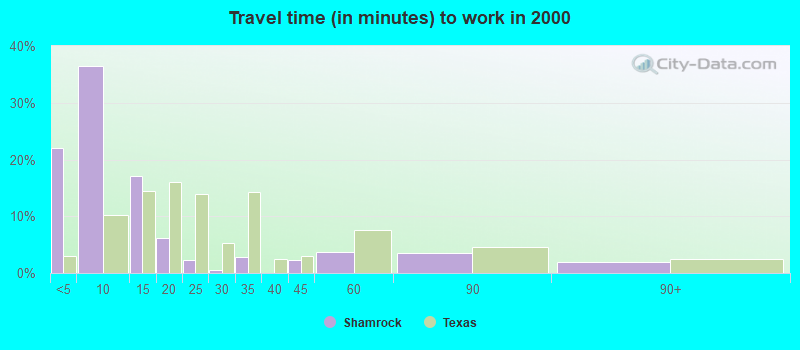
Less than 5 minutes: Shamrock:
22.1% (188)Texas:
3.0% (277,642)
5 to 9 minutes: Shamrock:
36.5% (311)Texas:
10.3% (942,891)
10 to 14 minutes: Shamrock:
17.0% (145)Texas:
14.4% (1,317,555)
15 to 19 minutes: Shamrock:
6.1% (52)Texas:
16.0% (1,467,945)
20 to 24 minutes: Shamrock:
2.4% (20)Texas:
13.9% (1,276,781)
25 to 29 minutes: Shamrock:
0.5% (4)Texas:
5.3% (482,838)
30 to 34 minutes: Shamrock:
2.8% (24)Texas:
14.3% (1,309,699)
40 to 44 minutes: Shamrock:
2.2% (19)Texas:
3.1% (280,916)
45 to 59 minutes: Shamrock:
3.6% (31)Texas:
7.6% (692,006)
60 to 89 minutes: Shamrock:
3.5% (30)Texas:
4.6% (418,905)
90 or more minutes: Shamrock:
1.9% (16)Texas:
2.4% (218,800)
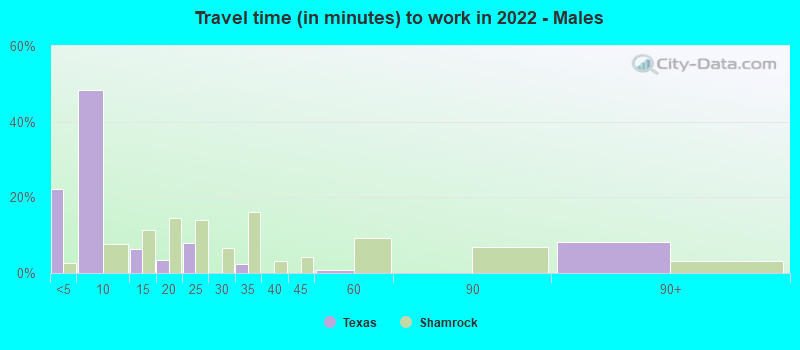
Less than 5 minutes - Males: Shamrock:
22.2% (64)Texas:
2.7% (181,937)
5 to 9 minutes - Males: Shamrock:
48.3% (139)Texas:
7.6% (522,166)
10 to 14 minutes - Males: Shamrock:
6.4% (18)Texas:
11.5% (785,572)
15 to 19 minutes - Males: Shamrock:
3.5% (10)Texas:
14.6% (1,001,179)
20 to 24 minutes - Males: Shamrock:
8.0% (23)Texas:
13.9% (950,043)
30 to 34 minutes - Males: Shamrock:
2.5% (7)Texas:
16.2% (1,110,357)
45 to 59 minutes - Males: Shamrock:
0.7% (2)Texas:
9.3% (639,122)
90 or more minutes - Males: Shamrock:
8.2% (24)Texas:
3.1% (211,313)
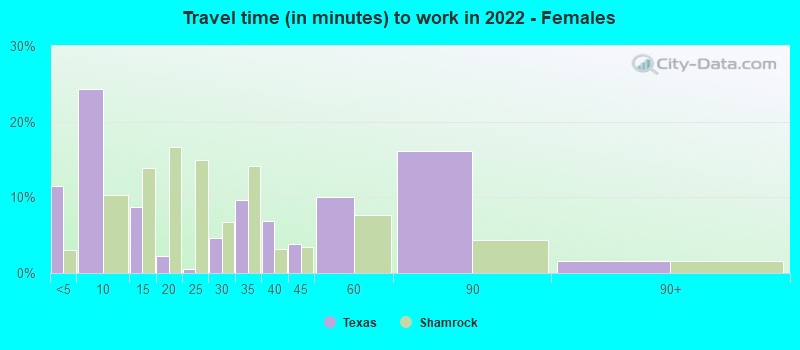
Less than 5 minutes - Females: Shamrock:
11.5% (47)Texas:
3.1% (168,525)
5 to 9 minutes - Females: Shamrock:
24.3% (98)Texas:
10.3% (565,596)
10 to 14 minutes - Females: Shamrock:
8.7% (35)Texas:
13.9% (764,699)
15 to 19 minutes - Females: Shamrock:
2.2% (9)Texas:
16.7% (917,174)
20 to 24 minutes - Females: Shamrock:
0.5% (2)Texas:
15.0% (822,036)
25 to 29 minutes - Females: Shamrock:
4.6% (19)Texas:
6.7% (370,574)
30 to 34 minutes - Females: Shamrock:
9.6% (39)Texas:
14.2% (777,521)
35 to 39 minutes - Females: Shamrock:
6.9% (28)Texas:
3.1% (170,658)
40 to 44 minutes - Females: Shamrock:
3.8% (15)Texas:
3.4% (186,684)
45 to 59 minutes - Females: Shamrock:
10.0% (41)Texas:
7.6% (419,254)
60 to 89 minutes - Females: Shamrock:
16.2% (65)Texas:
4.4% (238,848)
90 or more minutes - Females: Shamrock:
1.6% (6)Texas:
1.6% (88,571)
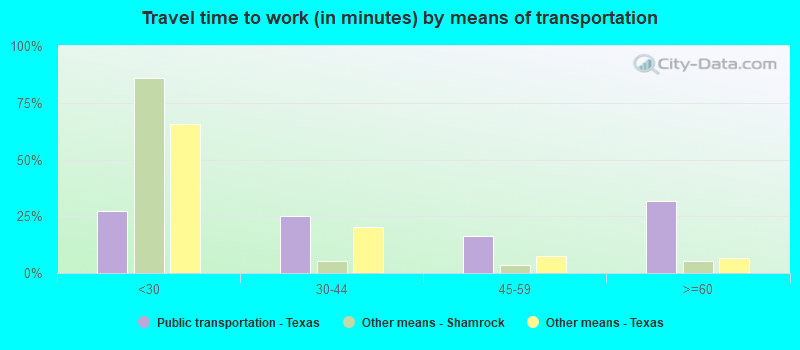
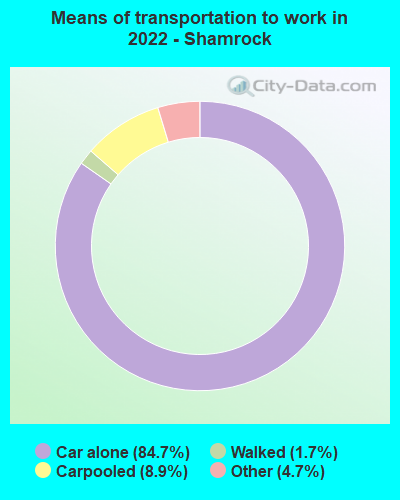
Means of transportation to work Drove car alone: Shamrock:
84.7% (610)Texas:
83.3% (4,557,023)
Carpooled: Shamrock:
8.9% (64)Texas:
11.7% (674,818)
Walked: Shamrock:
1.7% (13)Texas:
1.7% (99,911)
Other means: Shamrock:
4.7% (34)Texas:
2.0% (95,481)
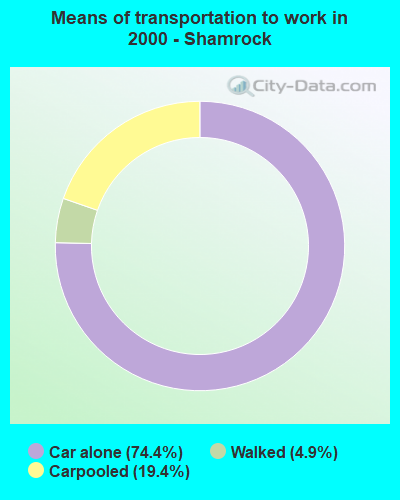
Drove car alone: Shamrock:
74.4% (633)Texas:
77.7% (7,115,590)
Carpooled: Shamrock:
19.4% (165)Texas:
14.5% (1,326,012)
Walked: Shamrock:
4.9% (42)Texas:
1.9% (173,670)
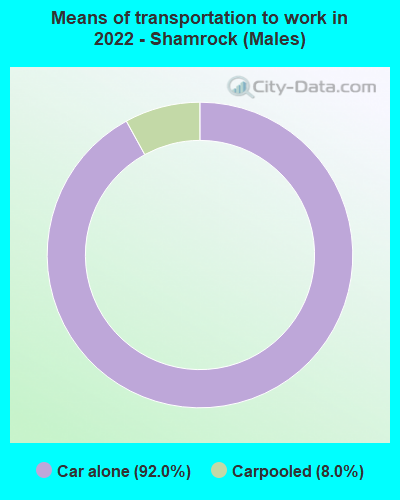
Drove car alone - Males: Shamrock:
92.0% (275)Texas:
83.6% (4,557,023)
Carpooled - Males: Shamrock:
8.0% (24)Texas:
11.2% (674,818)
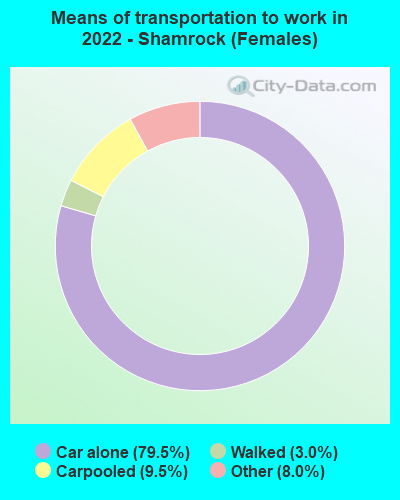
Drove car alone - Females: Shamrock:
79.5% (336)Texas:
83.0% (4,557,023)
Carpooled - Females: Shamrock:
9.5% (40)Texas:
12.3% (674,818)
Walked - Females: Shamrock:
3.0% (13)Texas:
1.8% (99,911)
Other means - Females: Shamrock:
8.0% (34)Texas:
1.7% (95,481)
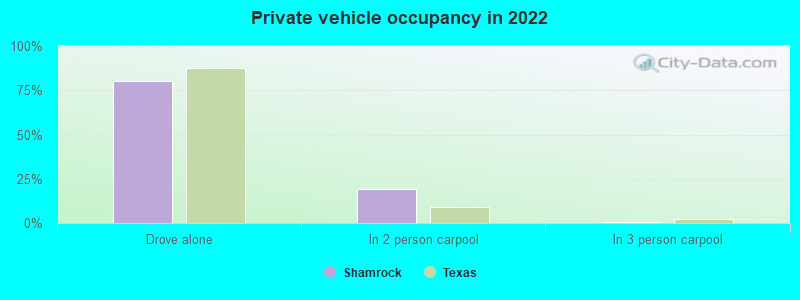
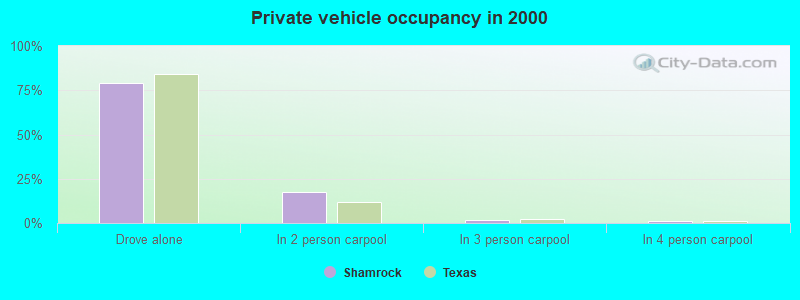
Private vehicle occupancy Drove alone: Shamrock:
80.2% (760)Texas:
87.6% (10,283,021)
In 2 person carpool: Shamrock:
18.9% (179)Texas:
9.0% (1,052,595)
In 3 person carpool: Shamrock:
0.4% (3)Texas:
2.1% (244,139)
In 7+ person carpool: Shamrock:
0.5% (4)Texas:
0.1% (16,725)
Drove alone: Shamrock:
79.3% (633)Texas:
84.3% (7,115,590)
In 2 person carpool: Shamrock:
17.8% (142)Texas:
11.6% (982,994)
In 3 person carpool: Shamrock:
1.8% (14)Texas:
2.4% (201,602)
In 4 person carpool: Shamrock:
1.1% (9)Texas:
1.0% (83,518)
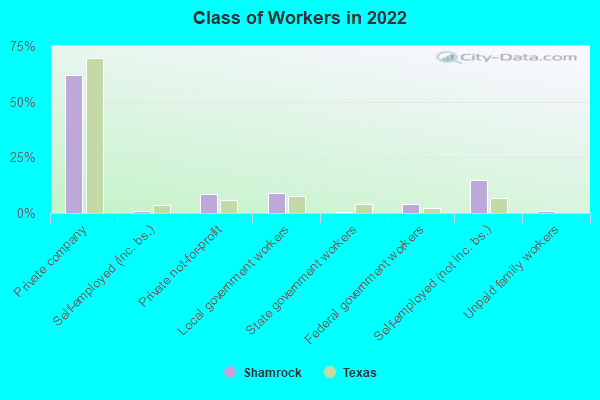
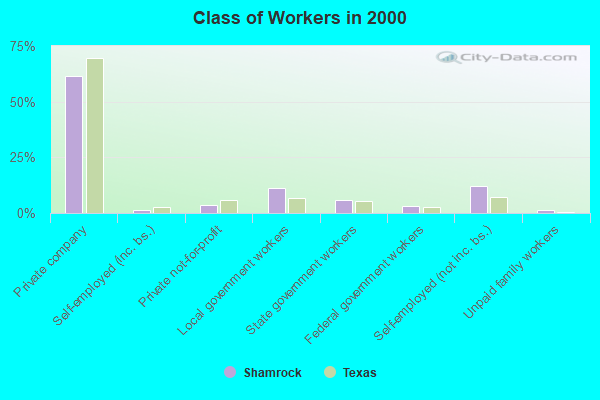
Class of workers
Employee of private company: Shamrock:
62.1% (623)Texas:
69.6% (10,139,666)
Self-employed in own incorporated business: Shamrock:
1.0% (10)Texas:
3.5% (516,446)
Private not-for-profit wage and salary workers: Shamrock:
8.4% (84)Texas:
6.0% (870,454)
Local government workers: Shamrock:
8.8% (88)Texas:
7.6% (1,109,799)
State government workers: Shamrock:
0.3% (3)Texas:
3.8% (558,618)
Federal government workers: Shamrock:
3.9% (39)Texas:
2.5% (357,298)
Self-employed workers in own not incorporated business: Shamrock:
14.7% (148)Texas:
6.8% (998,270)
Unpaid family workers: Shamrock:
0.7% (7)Texas:
0.2% (27,882)
Employee of private company: Shamrock:
61.5% (529)Texas:
69.6% (6,425,274)
Self-employed in own incorporated business: Shamrock:
1.2% (10)Texas:
2.7% (250,864)
Private not-for-profit wage and salary workers: Shamrock:
3.7% (32)Texas:
5.7% (526,631)
Local government workers: Shamrock:
11.2% (96)Texas:
6.6% (608,479)
State government workers: Shamrock:
5.9% (51)Texas:
5.4% (501,082)
Federal government workers: Shamrock:
3.0% (26)Texas:
2.6% (237,177)
Self-employed workers in own not incorporated business: Shamrock:
12.0% (103)Texas:
7.1% (653,527)
Unpaid family workers: Shamrock:
1.5% (13)Texas:
0.3% (31,338)
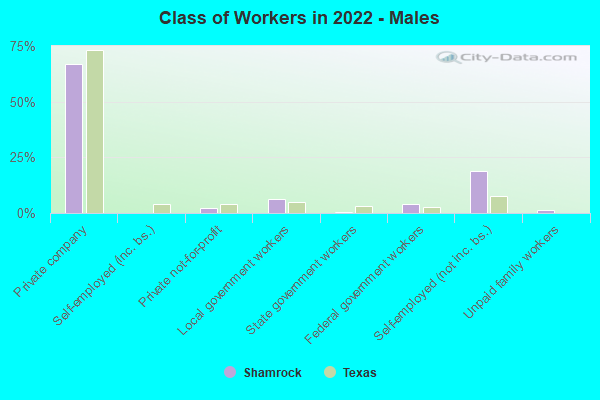
Employee of private company - Males: Shamrock:
67.1% (366)Texas:
73.1% (5,788,450)
Private not-for-profit wage and salary workers - Males: Shamrock:
2.1% (12)Texas:
4.1% (323,476)
Local government workers - Males: Shamrock:
6.2% (34)Texas:
5.1% (405,467)
State government workers - Males: Shamrock:
0.6% (3)Texas:
3.0% (236,706)
Federal government workers - Males: Shamrock:
3.8% (21)Texas:
2.7% (211,629)
Self-employed workers in own not incorporated business - Males: Shamrock:
18.8% (103)Texas:
7.7% (609,246)
Unpaid family workers - Males: Shamrock:
1.3% (7)Texas:
0.2% (12,606)
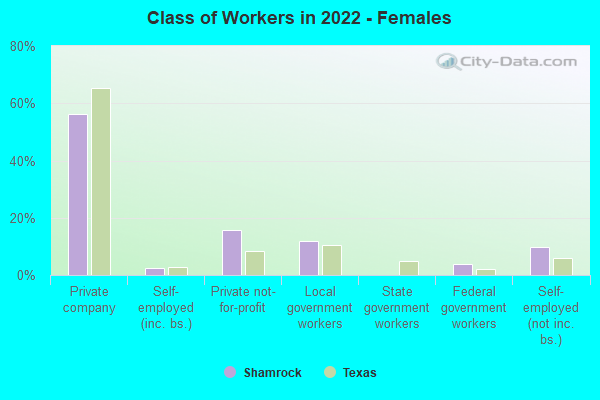
Employee of private company - Females: Shamrock:
56.2% (257)Texas:
65.4% (4,351,216)
Self-employed in own incorporated business - Females: Shamrock:
2.3% (10)Texas:
2.8% (183,791)
Private not-for-profit wage and salary workers - Females: Shamrock:
15.8% (72)Texas:
8.2% (546,978)
Local government workers - Females: Shamrock:
11.9% (55)Texas:
10.6% (704,332)
Federal government workers - Females: Shamrock:
3.9% (18)Texas:
2.2% (145,669)
Self-employed workers in own not incorporated business - Females: Shamrock:
9.9% (45)Texas:
5.8% (389,024)