Work and Jobs in Ship Bottom, New Jersey (NJ) Detailed Stats
Occupations, Industries, Unemployment, Workers, Commute
Settings
X


Recent posts about work in Ship Bottom, New Jersey on our local forum with over 2,400,000 registered users:
 | Is Cherry Hill still as appealing as decades ago? (29 replies) |
| Summer fun in North Jersey! (8 replies) |
| Moving to the shore. (19 replies) |
| Best NJ restaurant for Thanksgiving dinner? (43 replies) |
| Something to share with my Jersey People (38 replies) |
| window in bedroom (26 replies) |
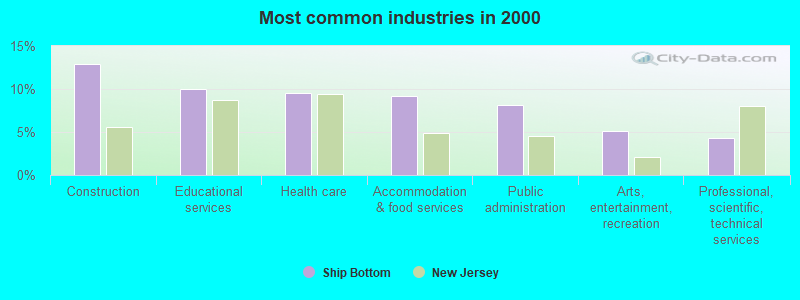
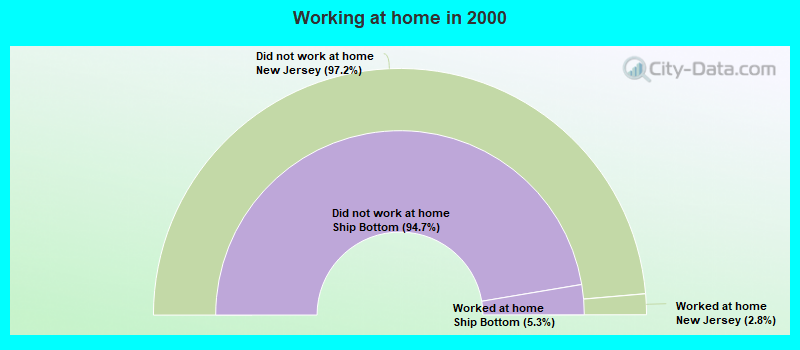
The most common industries in Ship Bottom are: Construction (12.9% of civilian employees), Educational services (10.0% of civilian employees), Health care (9.5% of civilian employees). 63.1% of workers work in Ocean County and 10.0% of all workers work at home. 54.3% of workers are employees of private companies, which is 26.6% less than the rate of 68.8% across the entire state of New Jersey.
Whole page based on the data from 2000 / 2022 when the population of Ship Bottom, New Jersey was 1,384 / 1,022
Whole page based on the data from 2000 / 2022 when the population of Ship Bottom, New Jersey was 1,384 / 1,022
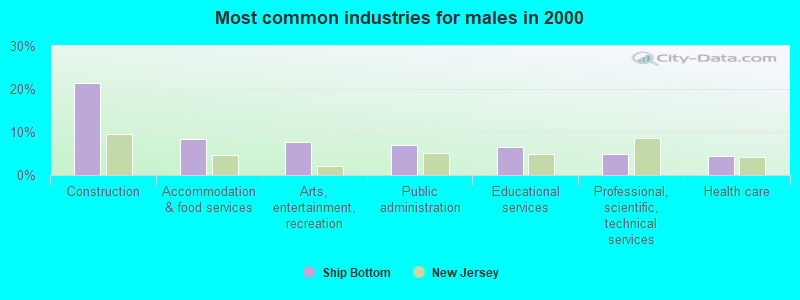
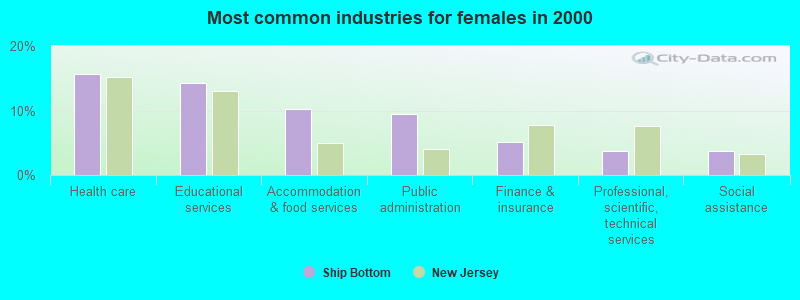
Most common industries
Most common industries | |||
|---|---|---|---|
Industry | All | Males | Females |
| Construction | 12.9% (84) | 21.3% (76) | 2.7% (8) |
| Educational services | 10.0% (65) | 6.5% (23) | 14.3% (42) |
| Health care | 9.5% (62) | 4.5% (16) | 15.6% (46) |
| Accommodation and food services | 9.2% (60) | 8.4% (30) | 10.2% (30) |
| Public administration | 8.2% (53) | 7.0% (25) | 9.5% (28) |
| Arts, entertainment, and recreation | 5.1% (33) | 7.6% (27) | 2.0% (6) |
| Professional, scientific, and technical services | 4.3% (28) | 4.8% (17) | 3.7% (11) |
| Finance and insurance | 3.7% (24) | 2.5% (9) | 5.1% (15) |
| Real estate and rental and leasing | 3.1% (20) | 3.7% (13) | 2.4% (7) |
| Personal and laundry services | 2.0% (13) | 0.8% (3) | 3.4% (10) |
| Religious, grantmaking, civic, professional, and similar organizations | 1.8% (12) | 1.1% (4) | 2.7% (8) |
| Other transportation, and support activities, and couriers | 1.8% (12) | 2.2% (8) | 1.4% (4) |
| Chemicals | 1.8% (12) | 2.0% (7) | 1.7% (5) |
| Social assistance | 1.7% (11) | 0.0% (0) | 3.7% (11) |
| Building material and garden equipment and supplies dealers | 1.7% (11) | 1.1% (4) | 2.4% (7) |
| Food and beverage stores | 1.7% (11) | 1.4% (5) | 2.0% (6) |
| Other direct selling establishments | 1.5% (10) | 1.7% (6) | 1.4% (4) |
| Gasoline stations | 1.5% (10) | 2.8% (10) | 0.0% (0) |
| Private households | 1.4% (9) | 0.0% (0) | 3.1% (9) |
| Miscellaneous nondurable goods merchant wholesalers | 1.2% (8) | 1.7% (6) | 0.7% (2) |
| Administrative and support and waste management services | 1.2% (8) | 0.6% (2) | 2.0% (6) |
| Publishing, and motion picture and sound recording industries | 0.9% (6) | 1.7% (6) | 0.0% (0) |
| Agriculture, forestry, fishing and hunting | 0.9% (6) | 0.8% (3) | 1.0% (3) |
| Metal and metal products | 0.8% (5) | 1.4% (5) | 0.0% (0) |
| Utilities | 0.8% (5) | 1.4% (5) | 0.0% (0) |
| Machinery, equipment, and supplies merchant wholesalers | 0.8% (5) | 1.4% (5) | 0.0% (0) |
| Printing and related support activities | 0.8% (5) | 1.4% (5) | 0.0% (0) |
| Repair and maintenance | 0.8% (5) | 1.4% (5) | 0.0% (0) |
| Miscellaneous manufacturing | 0.6% (4) | 1.1% (4) | 0.0% (0) |
| Computer and electronic products | 0.6% (4) | 0.6% (2) | 0.7% (2) |
| Broadcasting and telecommunications | 0.6% (4) | 0.6% (2) | 0.7% (2) |
| Motor vehicle and parts dealers | 0.6% (4) | 0.6% (2) | 0.7% (2) |
| Pharmacies and drug stores | 0.5% (3) | 0.0% (0) | 1.0% (3) |
| Lumber and other construction materials merchant wholesalers | 0.5% (3) | 0.8% (3) | 0.0% (0) |
| Radio, TV, and computer stores | 0.5% (3) | 0.8% (3) | 0.0% (0) |
| U. S. Postal service | 0.5% (3) | 0.0% (0) | 1.0% (3) |
| Rail transportation | 0.5% (3) | 0.8% (3) | 0.0% (0) |
| Used merchandise, gift, novelty, and souvenir, and other miscellaneous stores | 0.5% (3) | 0.0% (0) | 1.0% (3) |
| Clothing and accessories, including shoe, stores | 0.5% (3) | 0.0% (0) | 1.0% (3) |
| Truck transportation | 0.3% (2) | 0.6% (2) | 0.0% (0) |
| Food | 0.3% (2) | 0.6% (2) | 0.0% (0) |
| Apparel | 0.3% (2) | 0.6% (2) | 0.0% (0) |
| Paper | 0.3% (2) | 0.6% (2) | 0.0% (0) |
| Petroleum and coal products | 0.3% (2) | 0.6% (2) | 0.0% (0) |
| Department and other general merchandise stores | 0.3% (2) | 0.0% (0) | 0.7% (2) |
| Health and personal care, except drug, stores | 0.3% (2) | 0.0% (0) | 0.7% (2) |
| Sporting goods, camera, and hobby and toy stores | 0.3% (2) | 0.6% (2) | 0.0% (0) |
| Retail florists | 0.3% (2) | 0.0% (0) | 0.7% (2) |
| Data processing, libraries, and other information services | 0.3% (2) | 0.0% (0) | 0.7% (2) |
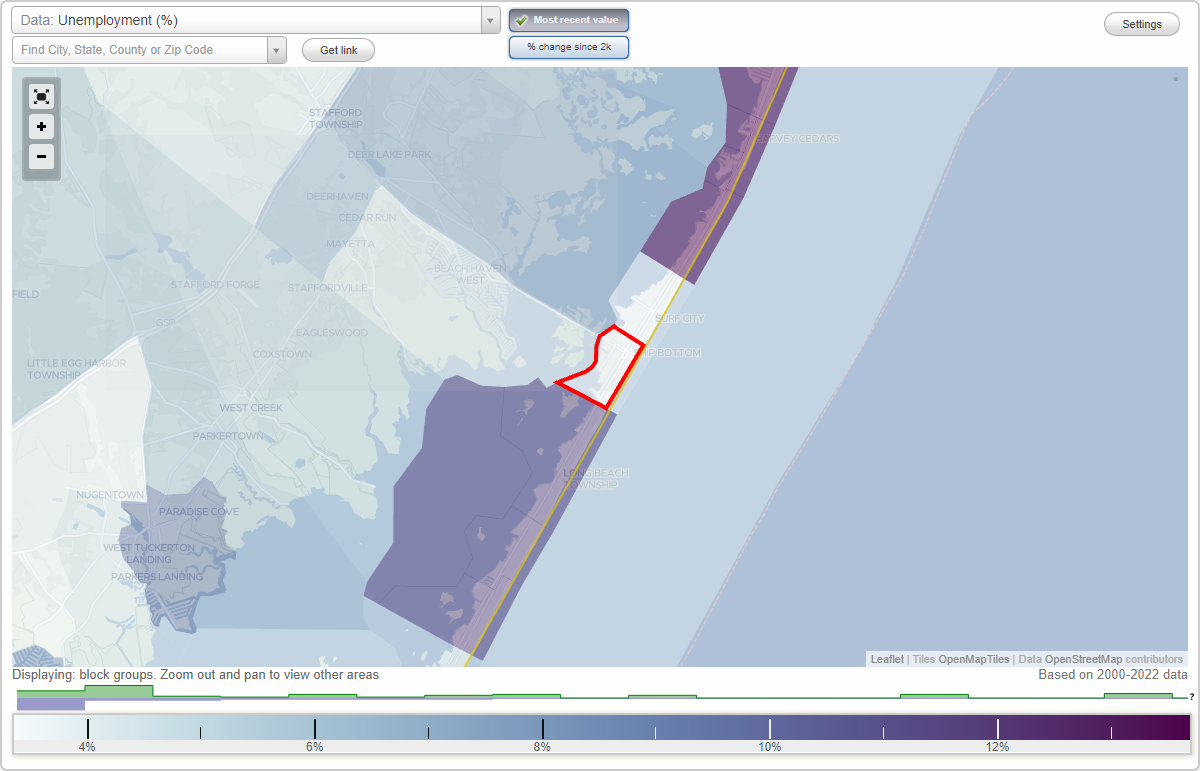
Unemployment in Ship Bottom
- Unemployment by race in 2022
- Unemployment rate for White non-Hispanic residents
- 2.5%Males
- 0.8%Females
- Unemployment by race in 2000
- Unemployment rate for White non-Hispanic residents
- 4.2%Males
- 8.9%Females
- Unemployment rate for Hispanic or Latino residents
- 10.7%Males
- 12.5%Females
Time leaving home to go to work
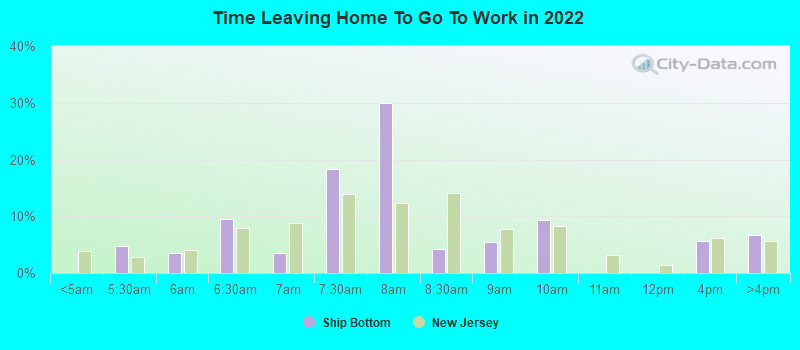
5:00 a.m. to 5:29 a.m.:
| Ship Bottom: | 4.8% (18) |
| New Jersey: | 2.8% (107,136) |
5:30 a.m. to 5:59 a.m.:
| Ship Bottom: | 3.6% (13) |
| New Jersey: | 4.0% (154,533) |
6:00 a.m. to 6:29 a.m.:
| Ship Bottom: | 9.6% (35) |
| New Jersey: | 7.9% (305,654) |
6:30 a.m. to 6:59 a.m.:
| Ship Bottom: | 3.6% (13) |
| New Jersey: | 8.9% (340,440) |
7:00 a.m. to 7:29 a.m.:
| Ship Bottom: | 18.3% (67) |
| New Jersey: | 13.9% (534,088) |
7:30 a.m. to 7:59 a.m.:
| Ship Bottom: | 29.9% (110) |
| New Jersey: | 12.3% (471,489) |
8:00 a.m. to 8:29 a.m.:
| Ship Bottom: | 4.3% (16) |
| New Jersey: | 14.1% (542,061) |
8:30 a.m. to 8:59 a.m.:
| Ship Bottom: | 5.4% (20) |
| New Jersey: | 7.7% (295,841) |
9:00 a.m. to 9:59 a.m.:
| Ship Bottom: | 9.3% (34) |
| New Jersey: | 8.2% (315,306) |
12:00 p.m. to 3:59 p.m.:
| Ship Bottom: | 5.7% (21) |
| New Jersey: | 6.2% (238,009) |
4:00 p.m. to 11:59 p.m.:
| Ship Bottom: | 6.6% (24) |
| New Jersey: | 5.6% (215,268) |
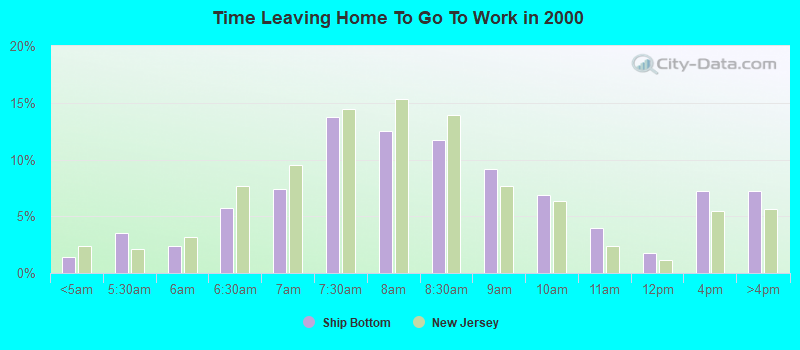
<5am:
| Ship Bottom: | 1.4% (9) |
| New Jersey: | 2.4% (92,776) |
5:30am:
| Ship Bottom: | 3.5% (22) |
| New Jersey: | 2.1% (83,147) |
6am:
| Ship Bottom: | 2.4% (15) |
| New Jersey: | 3.2% (124,191) |
6:30am:
| Ship Bottom: | 5.8% (36) |
| New Jersey: | 7.7% (297,494) |
7am:
| Ship Bottom: | 7.4% (46) |
| New Jersey: | 9.5% (369,088) |
7:30am:
| Ship Bottom: | 13.8% (86) |
| New Jersey: | 14.4% (558,435) |
8am:
| Ship Bottom: | 12.5% (78) |
| New Jersey: | 15.3% (592,839) |
8:30am:
| Ship Bottom: | 11.7% (73) |
| New Jersey: | 14.0% (541,137) |
9am:
| Ship Bottom: | 9.1% (57) |
| New Jersey: | 7.6% (295,834) |
10am:
| Ship Bottom: | 6.9% (43) |
| New Jersey: | 6.4% (246,745) |
11am:
| Ship Bottom: | 4.0% (25) |
| New Jersey: | 2.4% (92,391) |
12pm:
| Ship Bottom: | 1.8% (11) |
| New Jersey: | 1.1% (43,997) |
4pm:
| Ship Bottom: | 7.2% (45) |
| New Jersey: | 5.5% (213,079) |
>4pm:
| Ship Bottom: | 7.2% (45) |
| New Jersey: | 5.6% (218,724) |
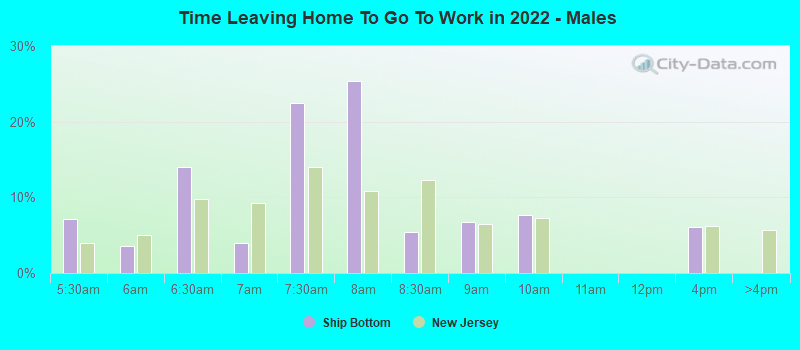
5:00 a.m. to 5:29 a.m. - Males:
| Ship Bottom: | 7.2% (16) |
| New Jersey: | 4.0% (82,885) |
5:30 a.m. to 5:59 a.m. - Males:
| Ship Bottom: | 3.6% (8) |
| New Jersey: | 5.1% (104,431) |
6:00 a.m. to 6:29 a.m. - Males:
| Ship Bottom: | 14.1% (32) |
| New Jersey: | 9.7% (200,451) |
6:30 a.m. to 6:59 a.m. - Males:
| Ship Bottom: | 4.0% (9) |
| New Jersey: | 9.3% (191,368) |
7:00 a.m. to 7:29 a.m. - Males:
| Ship Bottom: | 22.4% (51) |
| New Jersey: | 14.0% (288,907) |
7:30 a.m. to 7:59 a.m. - Males:
| Ship Bottom: | 25.3% (57) |
| New Jersey: | 10.9% (224,409) |
8:00 a.m. to 8:29 a.m. - Males:
| Ship Bottom: | 5.5% (12) |
| New Jersey: | 12.2% (251,968) |
8:30 a.m. to 8:59 a.m. - Males:
| Ship Bottom: | 6.7% (15) |
| New Jersey: | 6.5% (133,460) |
9:00 a.m. to 9:59 a.m. - Males:
| Ship Bottom: | 7.7% (17) |
| New Jersey: | 7.2% (148,957) |
12:00 p.m. to 3:59 p.m. - Males:
| Ship Bottom: | 6.1% (14) |
| New Jersey: | 6.2% (126,671) |
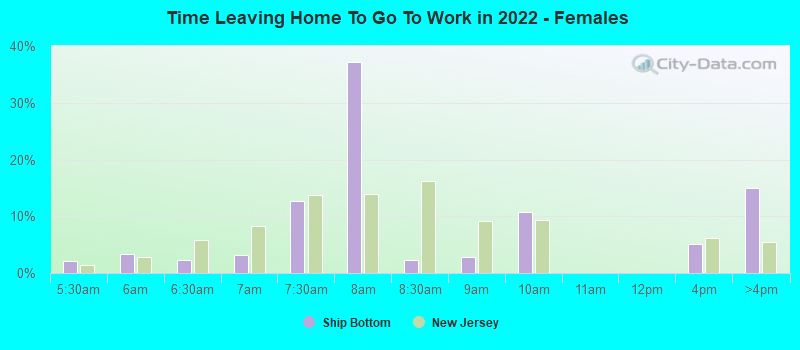
5:00 a.m. to 5:29 a.m. - Females:
| Ship Bottom: | 2.2% (3) |
| New Jersey: | 1.4% (24,251) |
5:30 a.m. to 5:59 a.m. - Females:
| Ship Bottom: | 3.3% (5) |
| New Jersey: | 2.8% (50,102) |
6:00 a.m. to 6:29 a.m. - Females:
| Ship Bottom: | 2.2% (3) |
| New Jersey: | 5.9% (105,203) |
6:30 a.m. to 6:59 a.m. - Females:
| Ship Bottom: | 3.2% (5) |
| New Jersey: | 8.3% (149,072) |
7:00 a.m. to 7:29 a.m. - Females:
| Ship Bottom: | 12.8% (18) |
| New Jersey: | 13.7% (245,181) |
7:30 a.m. to 7:59 a.m. - Females:
| Ship Bottom: | 37.3% (53) |
| New Jersey: | 13.8% (247,080) |
8:00 a.m. to 8:29 a.m. - Females:
| Ship Bottom: | 2.2% (3) |
| New Jersey: | 16.2% (290,093) |
8:30 a.m. to 8:59 a.m. - Females:
| Ship Bottom: | 2.8% (4) |
| New Jersey: | 9.1% (162,381) |
9:00 a.m. to 9:59 a.m. - Females:
| Ship Bottom: | 10.8% (15) |
| New Jersey: | 9.3% (166,349) |
12:00 p.m. to 3:59 p.m. - Females:
| Ship Bottom: | 5.1% (7) |
| New Jersey: | 6.2% (111,338) |
4:00 p.m. to 11:59 p.m. - Females:
| Ship Bottom: | 15.1% (21) |
| New Jersey: | 5.5% (97,548) |
Travel time to work
Percentage of workers working in this county: 63.1%
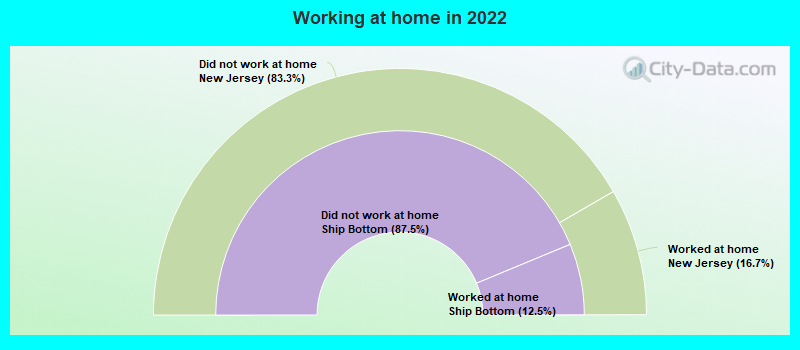
Number of people working at home: 41 (10.0% of all workers)
Number of people working at home: 41 (10.0% of all workers)
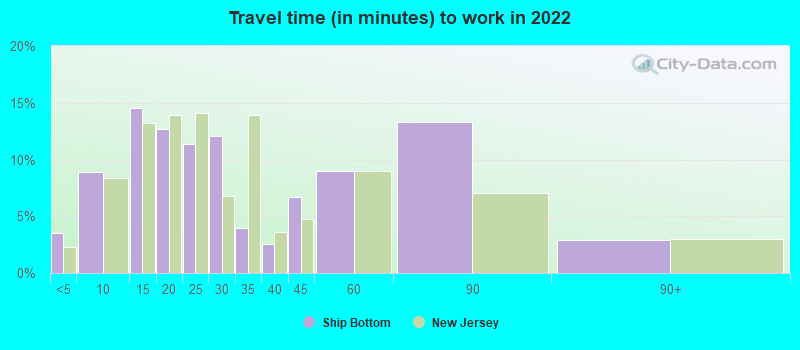
Less than 5 minutes:
| Ship Bottom: | 3.5% (37) |
| New Jersey: | 2.3% (81,825) |
5 to 9 minutes:
| Ship Bottom: | 8.9% (93) |
| New Jersey: | 8.3% (298,192) |
10 to 14 minutes:
| Ship Bottom: | 14.5% (151) |
| New Jersey: | 13.3% (473,288) |
15 to 19 minutes:
| Ship Bottom: | 12.7% (132) |
| New Jersey: | 13.9% (498,065) |
20 to 24 minutes:
| Ship Bottom: | 11.3% (118) |
| New Jersey: | 14.1% (502,432) |
25 to 29 minutes:
| Ship Bottom: | 12.1% (126) |
| New Jersey: | 6.8% (242,857) |
30 to 34 minutes:
| Ship Bottom: | 4.0% (42) |
| New Jersey: | 13.9% (496,723) |
35 to 39 minutes:
| Ship Bottom: | 2.6% (27) |
| New Jersey: | 3.6% (130,069) |
40 to 44 minutes:
| Ship Bottom: | 6.7% (69) |
| New Jersey: | 4.7% (168,760) |
45 to 59 minutes:
| Ship Bottom: | 9.0% (94) |
| New Jersey: | 9.0% (320,422) |
60 to 89 minutes:
| Ship Bottom: | 13.3% (138) |
| New Jersey: | 7.1% (252,432) |
90 or more minutes:
| Ship Bottom: | 2.9% (30) |
| New Jersey: | 3.0% (106,190) |
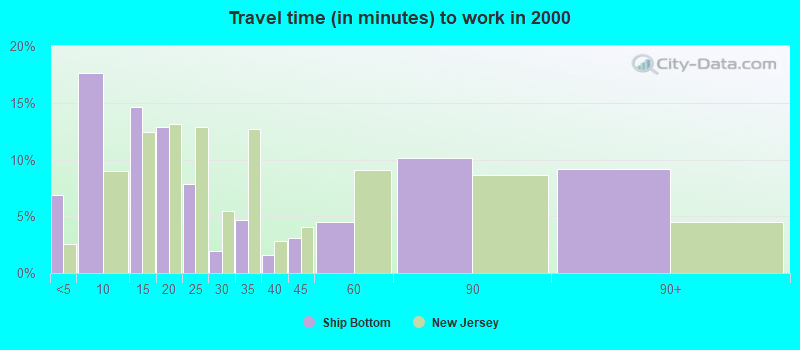
Less than 5 minutes:
| Ship Bottom: | 6.9% (43) |
| New Jersey: | 2.6% (99,241) |
5 to 9 minutes:
| Ship Bottom: | 17.6% (110) |
| New Jersey: | 9.0% (347,598) |
10 to 14 minutes:
| Ship Bottom: | 14.6% (91) |
| New Jersey: | 12.5% (482,988) |
15 to 19 minutes:
| Ship Bottom: | 12.8% (80) |
| New Jersey: | 13.2% (510,571) |
20 to 24 minutes:
| Ship Bottom: | 7.9% (49) |
| New Jersey: | 12.8% (497,467) |
25 to 29 minutes:
| Ship Bottom: | 1.9% (12) |
| New Jersey: | 5.4% (210,226) |
30 to 34 minutes:
| Ship Bottom: | 4.6% (29) |
| New Jersey: | 12.7% (492,539) |
35 to 39 minutes:
| Ship Bottom: | 1.6% (10) |
| New Jersey: | 2.8% (109,571) |
40 to 44 minutes:
| Ship Bottom: | 3.0% (19) |
| New Jersey: | 4.0% (156,148) |
45 to 59 minutes:
| Ship Bottom: | 4.5% (28) |
| New Jersey: | 9.1% (352,609) |
60 to 89 minutes:
| Ship Bottom: | 10.1% (63) |
| New Jersey: | 8.7% (335,777) |
90 or more minutes:
| Ship Bottom: | 9.1% (57) |
| New Jersey: | 4.5% (175,142) |
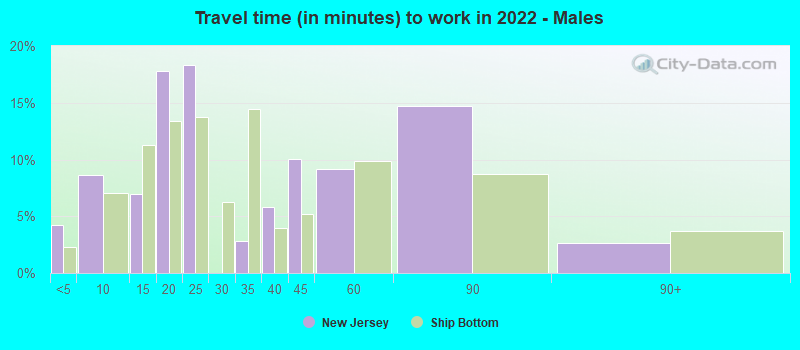
Less than 5 minutes - Males:
| Ship Bottom: | 4.2% (21) |
| New Jersey: | 2.3% (44,228) |
5 to 9 minutes - Males:
| Ship Bottom: | 8.7% (44) |
| New Jersey: | 7.0% (133,825) |
10 to 14 minutes - Males:
| Ship Bottom: | 7.0% (36) |
| New Jersey: | 11.3% (215,430) |
15 to 19 minutes - Males:
| Ship Bottom: | 17.8% (91) |
| New Jersey: | 13.4% (254,987) |
20 to 24 minutes - Males:
| Ship Bottom: | 18.3% (94) |
| New Jersey: | 13.8% (262,577) |
30 to 34 minutes - Males:
| Ship Bottom: | 2.8% (14) |
| New Jersey: | 14.4% (275,270) |
35 to 39 minutes - Males:
| Ship Bottom: | 5.8% (29) |
| New Jersey: | 4.0% (76,254) |
40 to 44 minutes - Males:
| Ship Bottom: | 10.1% (51) |
| New Jersey: | 5.2% (99,982) |
45 to 59 minutes - Males:
| Ship Bottom: | 9.2% (47) |
| New Jersey: | 9.9% (187,910) |
60 to 89 minutes - Males:
| Ship Bottom: | 14.7% (75) |
| New Jersey: | 8.8% (167,057) |
90 or more minutes - Males:
| Ship Bottom: | 2.7% (14) |
| New Jersey: | 3.7% (70,611) |
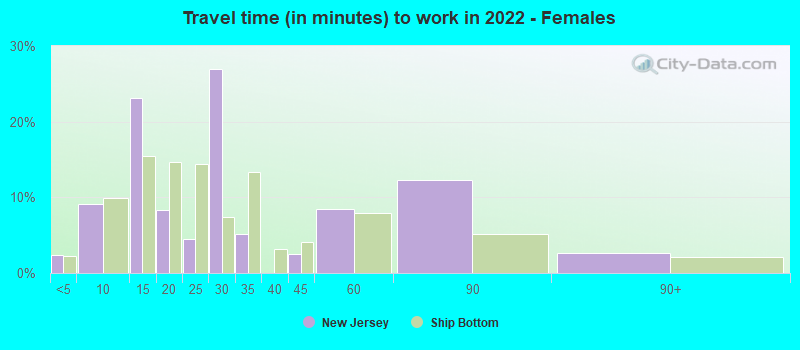
Less than 5 minutes - Females:
| Ship Bottom: | 2.4% (12) |
| New Jersey: | 2.3% (37,597) |
5 to 9 minutes - Females:
| Ship Bottom: | 9.2% (49) |
| New Jersey: | 9.9% (164,367) |
10 to 14 minutes - Females:
| Ship Bottom: | 23.1% (122) |
| New Jersey: | 15.5% (257,858) |
15 to 19 minutes - Females:
| Ship Bottom: | 8.3% (44) |
| New Jersey: | 14.6% (243,078) |
20 to 24 minutes - Females:
| Ship Bottom: | 4.5% (24) |
| New Jersey: | 14.4% (239,855) |
25 to 29 minutes - Females:
| Ship Bottom: | 27.0% (143) |
| New Jersey: | 7.4% (123,288) |
30 to 34 minutes - Females:
| Ship Bottom: | 5.1% (27) |
| New Jersey: | 13.3% (221,453) |
40 to 44 minutes - Females:
| Ship Bottom: | 2.5% (13) |
| New Jersey: | 4.1% (68,778) |
45 to 59 minutes - Females:
| Ship Bottom: | 8.5% (45) |
| New Jersey: | 8.0% (132,512) |
60 to 89 minutes - Females:
| Ship Bottom: | 12.3% (65) |
| New Jersey: | 5.1% (85,375) |
90 or more minutes - Females:
| Ship Bottom: | 2.6% (14) |
| New Jersey: | 2.1% (35,579) |
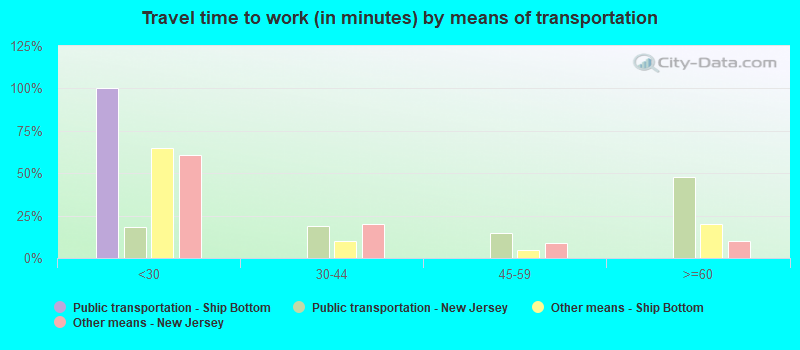
Means of transportation to work
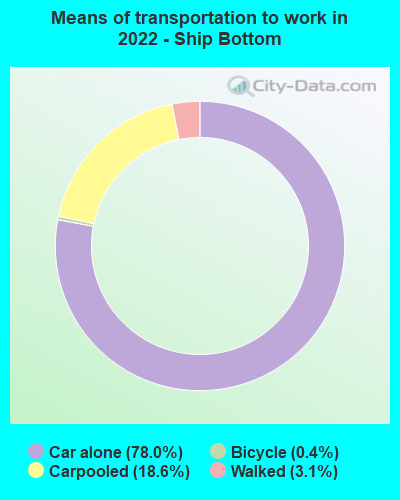

Drove car alone:
| Ship Bottom: | 78.0% (837) |
| New Jersey: | 78.3% (1,290,804) |
Carpooled:
| Ship Bottom: | 18.6% (199) |
| New Jersey: | 10.5% (178,194) |
Bicycle:
| Ship Bottom: | 0.4% (4) |
| New Jersey: | 0.4% (2,821) |
Walked:
| Ship Bottom: | 3.1% (33) |
| New Jersey: | 3.8% (65,269) |
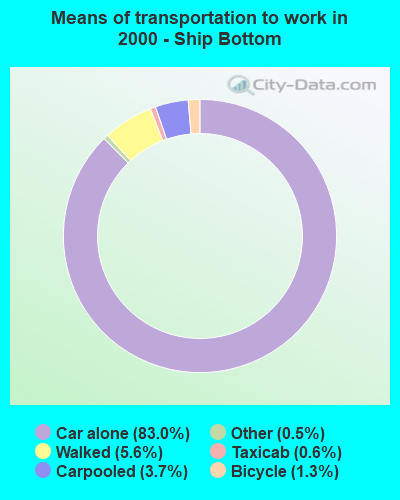
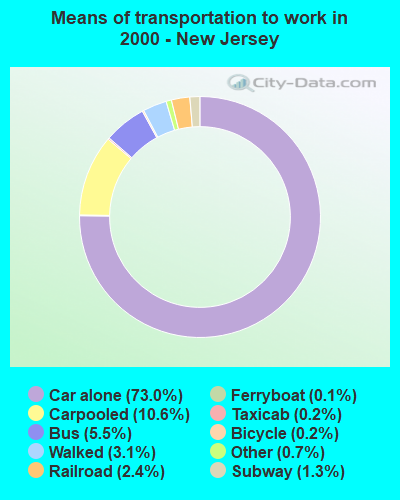
Drove car alone:
| Ship Bottom: | 83.0% (518) |
| New Jersey: | 73.0% (2,828,303) |
Carpooled:
| Ship Bottom: | 3.7% (23) |
| New Jersey: | 10.6% (412,299) |
Taxicab:
| Ship Bottom: | 0.6% (4) |
| New Jersey: | 0.2% (7,879) |
Bicycle:
| Ship Bottom: | 1.3% (8) |
| New Jersey: | 0.2% (9,142) |
Walked:
| Ship Bottom: | 5.6% (35) |
| New Jersey: | 3.1% (121,305) |
Other means:
| Ship Bottom: | 0.5% (3) |
| New Jersey: | 0.7% (25,484) |
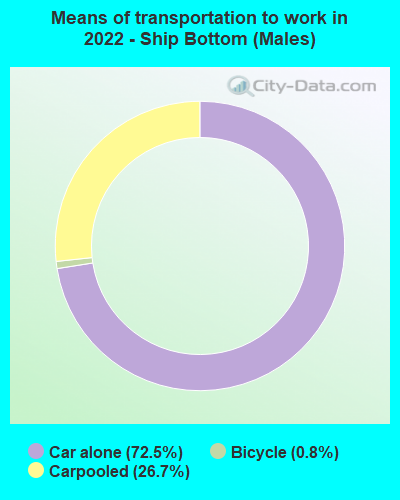
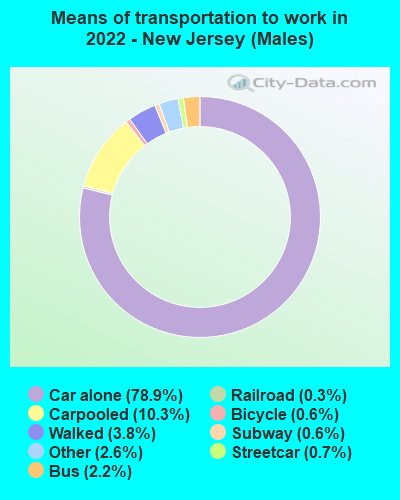
Drove car alone - Males:
| Ship Bottom: | 72.5% (384) |
| New Jersey: | 78.9% (1,290,804) |
Carpooled - Males:
| Ship Bottom: | 26.7% (141) |
| New Jersey: | 10.3% (178,194) |
Bicycle - Males:
| Ship Bottom: | 0.8% (4) |
| New Jersey: | 0.6% (2,821) |
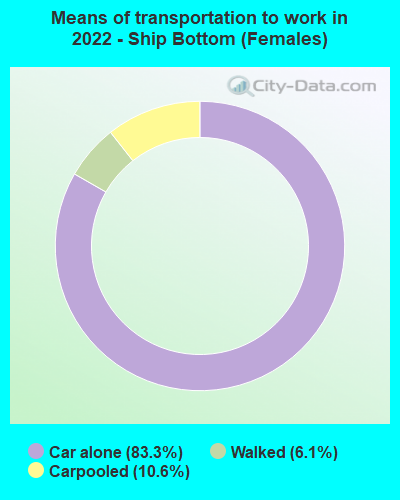

Drove car alone - Females:
| Ship Bottom: | 83.3% (453) |
| New Jersey: | 77.6% (1,290,804) |
Carpooled - Females:
| Ship Bottom: | 10.6% (58) |
| New Jersey: | 10.7% (178,194) |
Walked - Females:
| Ship Bottom: | 6.1% (33) |
| New Jersey: | 3.9% (65,269) |
Private vehicle occupancy
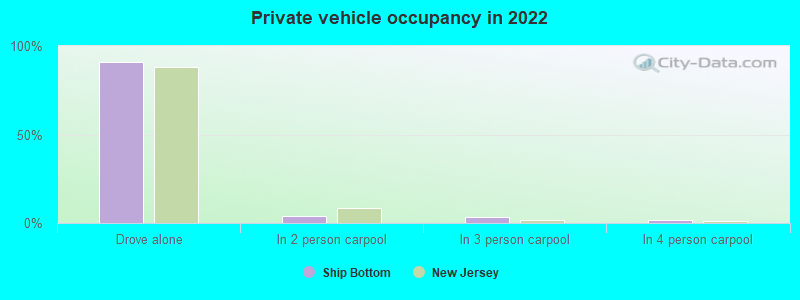
Drove alone:
| Ship Bottom: | 90.8% (309) |
| New Jersey: | 88.1% (2,840,182) |
In 2 person carpool:
| Ship Bottom: | 3.9% (13) |
| New Jersey: | 8.5% (274,126) |
In 3 person carpool:
| Ship Bottom: | 3.5% (12) |
| New Jersey: | 1.9% (62,756) |
In 4 person carpool:
| Ship Bottom: | 1.8% (6) |
| New Jersey: | 0.9% (27,905) |
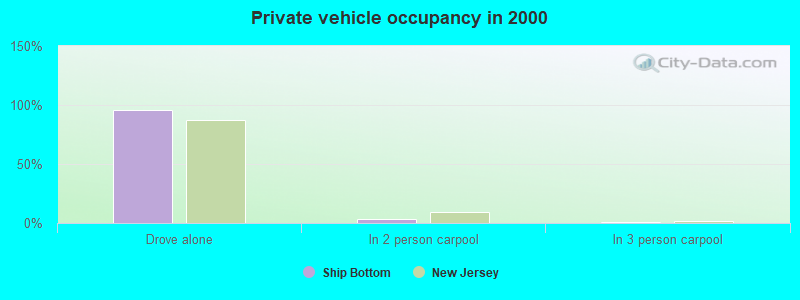
Drove alone:
| Ship Bottom: | 95.7% (518) |
| New Jersey: | 87.3% (2,828,303) |
In 2 person carpool:
| Ship Bottom: | 3.5% (19) |
| New Jersey: | 9.6% (311,146) |
In 3 person carpool:
| Ship Bottom: | 0.7% (4) |
| New Jersey: | 1.7% (55,192) |
Class of workers

Employee of private company:
| Ship Bottom: | 54.3% (232) |
| New Jersey: | 68.8% (3,236,727) |
Self-employed in own incorporated business:
| Ship Bottom: | 11.2% (48) |
| New Jersey: | 4.0% (187,817) |
Private not-for-profit wage and salary workers:
| Ship Bottom: | 4.8% (20) |
| New Jersey: | 7.9% (369,959) |
Local government workers:
| Ship Bottom: | 15.5% (66) |
| New Jersey: | 8.4% (397,465) |
State government workers:
| Ship Bottom: | 2.6% (11) |
| New Jersey: | 4.1% (190,835) |
Federal government workers:
| Ship Bottom: | 2.4% (10) |
| New Jersey: | 2.0% (94,493) |
Self-employed workers in own not incorporated business:
| Ship Bottom: | 9.3% (40) |
| New Jersey: | 4.7% (223,359) |

Employee of private company:
| Ship Bottom: | 52.3% (340) |
| New Jersey: | 70.6% (2,789,718) |
Self-employed in own incorporated business:
| Ship Bottom: | 7.8% (51) |
| New Jersey: | 3.8% (149,548) |
Private not-for-profit wage and salary workers:
| Ship Bottom: | 8.8% (57) |
| New Jersey: | 6.4% (254,203) |
Local government workers:
| Ship Bottom: | 12.6% (82) |
| New Jersey: | 7.9% (311,080) |
State government workers:
| Ship Bottom: | 3.2% (21) |
| New Jersey: | 3.8% (151,067) |
Federal government workers:
| Ship Bottom: | 0.8% (5) |
| New Jersey: | 2.2% (88,294) |
Self-employed workers in own not incorporated business:
| Ship Bottom: | 14.2% (92) |
| New Jersey: | 5.0% (197,664) |
Unpaid family workers:
| Ship Bottom: | 0.3% (2) |
| New Jersey: | 0.2% (8,455) |
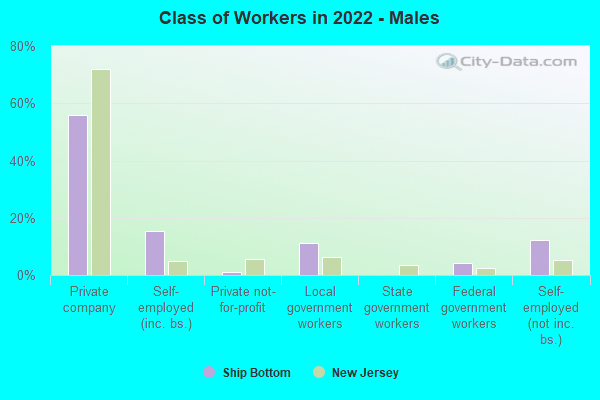
Employee of private company - Males:
| Ship Bottom: | 55.9% (139) |
| New Jersey: | 72.0% (1,792,593) |
Self-employed in own incorporated business - Males:
| Ship Bottom: | 15.5% (39) |
| New Jersey: | 5.0% (125,798) |
Private not-for-profit wage and salary workers - Males:
| Ship Bottom: | 1.2% (3) |
| New Jersey: | 5.5% (135,866) |
Local government workers - Males:
| Ship Bottom: | 11.0% (27) |
| New Jersey: | 6.3% (156,104) |
Federal government workers - Males:
| Ship Bottom: | 4.1% (10) |
| New Jersey: | 2.4% (59,437) |
Self-employed workers in own not incorporated business - Males:
| Ship Bottom: | 12.2% (31) |
| New Jersey: | 5.3% (132,027) |
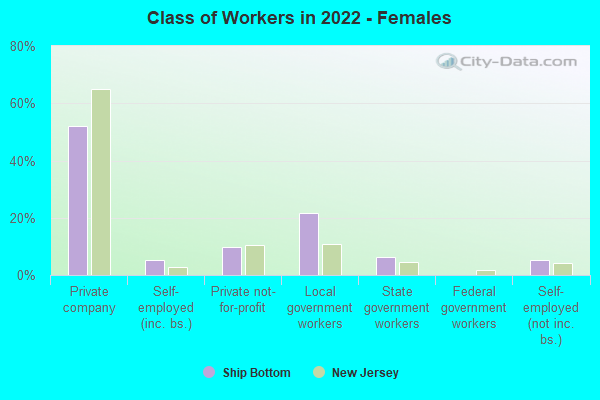
Employee of private company - Females:
| Ship Bottom: | 52.0% (93) |
| New Jersey: | 65.2% (1,444,134) |
Self-employed in own incorporated business - Females:
| Ship Bottom: | 5.1% (9) |
| New Jersey: | 2.8% (62,019) |
Private not-for-profit wage and salary workers - Females:
| Ship Bottom: | 9.7% (17) |
| New Jersey: | 10.6% (234,093) |
Local government workers - Females:
| Ship Bottom: | 21.7% (39) |
| New Jersey: | 10.9% (241,361) |
State government workers - Females:
| Ship Bottom: | 6.3% (11) |
| New Jersey: | 4.7% (104,123) |
Self-employed workers in own not incorporated business - Females:
| Ship Bottom: | 5.1% (9) |
| New Jersey: | 4.1% (91,332) |