Work and Jobs in South St. Paul, Minnesota (MN) Detailed Stats
Occupations, Industries, Unemployment, Workers, Commute
Settings
X


Recent posts about work in South St. Paul, Minnesota on our local forum with over 2,400,000 registered users:
 | Cottage Grove , MN 2022 (5 replies) |
| Relocation to to MPLS for work (27 replies) |
| St. Paul Suburbs for State Employee (14 replies) |
| What is the best Suburban downtown for walking. (12 replies) |
| Hunter Found after Four Days in the Northwoods, (2 replies) |
| South St. Paul (30 replies) |
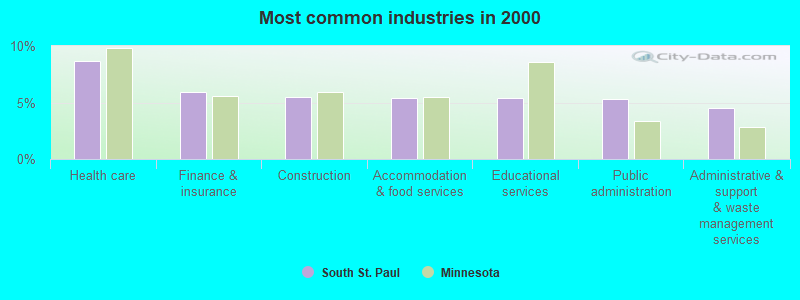
The most common industries in South St. Paul are: Health care (8.7% of civilian employees), Finance & insurance (5.9% of civilian employees), Construction (5.5% of civilian employees). 50.1% of workers work in Dakota County and 9.8% of all workers work at home. 70.0% of workers are employees of private companies, which is 5.9% greater than the rate of 65.9% across the entire state of Minnesota.
Whole page based on the data from 2000 / 2022 when the population of South St. Paul, Minnesota was 20,167 / 20,793
Whole page based on the data from 2000 / 2022 when the population of South St. Paul, Minnesota was 20,167 / 20,793
Most common industries
Most common industries | |||
|---|---|---|---|
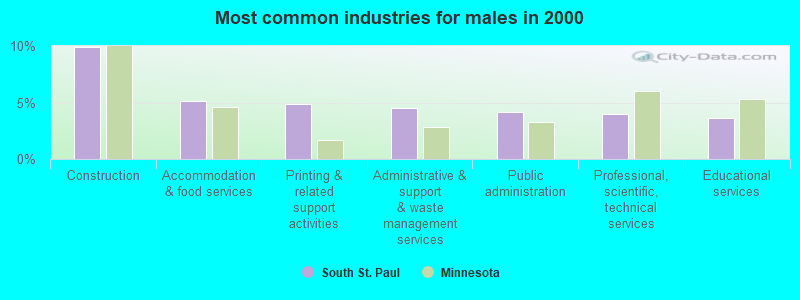
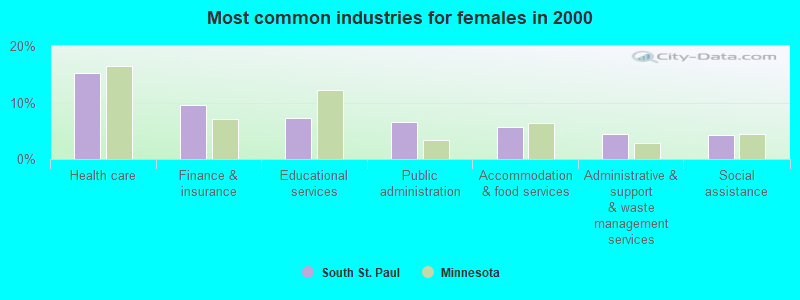
Industry | All | Males | Females |
| Health care | 8.7% (945) | 2.6% (148) | 15.1% (797) |
| Finance and insurance | 5.9% (644) | 2.6% (145) | 9.5% (499) |
| Construction | 5.5% (600) | 9.9% (559) | 0.8% (41) |
| Accommodation and food services | 5.4% (592) | 5.2% (290) | 5.7% (302) |
| Educational services | 5.4% (585) | 3.6% (205) | 7.2% (380) |
| Public administration | 5.3% (581) | 4.2% (235) | 6.6% (346) |
| Administrative and support and waste management services | 4.5% (488) | 4.5% (255) | 4.4% (233) |
| Professional, scientific, and technical services | 3.9% (429) | 3.9% (222) | 3.9% (207) |
| Printing and related support activities | 3.4% (375) | 4.9% (276) | 1.9% (99) |
| Social assistance | 2.5% (273) | 0.9% (51) | 4.2% (222) |
| Air transportation | 2.3% (252) | 2.4% (137) | 2.2% (115) |
| Food and beverage stores | 2.3% (245) | 2.0% (111) | 2.5% (134) |
| Religious, grantmaking, civic, professional, and similar organizations | 2.0% (222) | 2.0% (110) | 2.1% (112) |
| Metal and metal products | 2.0% (221) | 3.4% (191) | 0.6% (30) |
| Other transportation, and support activities, and couriers | 2.0% (218) | 3.1% (177) | 0.8% (41) |
| Publishing, and motion picture and sound recording industries | 1.9% (203) | 1.9% (105) | 1.9% (98) |
| Real estate and rental and leasing | 1.8% (198) | 2.1% (118) | 1.5% (80) |
| Arts, entertainment, and recreation | 1.8% (197) | 1.6% (91) | 2.0% (106) |
| Department and other general merchandise stores | 1.8% (192) | 1.2% (69) | 2.3% (123) |
| Miscellaneous manufacturing | 1.6% (178) | 1.6% (92) | 1.6% (86) |
| Food | 1.6% (175) | 1.9% (106) | 1.3% (69) |
| Personal and laundry services | 1.5% (166) | 0.6% (36) | 2.5% (130) |
| Paper | 1.4% (155) | 1.5% (82) | 1.4% (73) |
| Truck transportation | 1.4% (155) | 2.1% (118) | 0.7% (37) |
| Repair and maintenance | 1.2% (133) | 1.8% (102) | 0.6% (31) |
| Machinery | 1.2% (126) | 1.4% (79) | 0.9% (47) |
| Motor vehicle and parts dealers | 1.1% (121) | 1.9% (105) | 0.3% (16) |
| Chemicals | 1.1% (117) | 0.9% (53) | 1.2% (64) |
| Building material and garden equipment and supplies dealers | 1.0% (105) | 1.7% (93) | 0.2% (12) |
| Broadcasting and telecommunications | 0.9% (101) | 1.0% (59) | 0.8% (42) |
| Radio, TV, and computer stores | 0.8% (92) | 1.5% (83) | 0.2% (9) |
| Computer and electronic products | 0.7% (79) | 1.2% (68) | 0.2% (11) |
| Other direct selling establishments | 0.7% (79) | 0.9% (51) | 0.5% (28) |
| Transportation equipment | 0.7% (76) | 1.0% (59) | 0.3% (17) |
| U. S. Postal service | 0.7% (72) | 0.6% (31) | 0.8% (41) |
| Plastics and rubber products | 0.6% (70) | 0.9% (50) | 0.4% (20) |
| Wood products | 0.6% (66) | 0.9% (48) | 0.3% (18) |
| Electronic shopping and mail-order houses | 0.6% (64) | 0.2% (13) | 1.0% (51) |
| Utilities | 0.6% (63) | 0.8% (44) | 0.4% (19) |
| Machinery, equipment, and supplies merchant wholesalers | 0.6% (63) | 0.7% (40) | 0.4% (23) |
| Groceries and related products merchant wholesalers | 0.6% (61) | 0.8% (46) | 0.3% (15) |
| Beverage and tobacco products | 0.5% (59) | 1.0% (55) | 0.1% (4) |
| Agriculture, forestry, fishing and hunting | 0.5% (58) | 0.8% (47) | 0.2% (11) |
| Motor vehicles, parts and supplies merchant wholesalers | 0.5% (55) | 0.6% (35) | 0.4% (20) |
| Miscellaneous nondurable goods merchant wholesalers | 0.5% (54) | 0.6% (31) | 0.4% (23) |
| Sporting goods, camera, and hobby and toy stores | 0.5% (53) | 0.6% (34) | 0.4% (19) |
| Professional and commercial equipment and supplies merchant wholesalers | 0.5% (51) | 0.5% (29) | 0.4% (22) |
| Used merchandise, gift, novelty, and souvenir, and other miscellaneous stores | 0.5% (50) | 0.0% (0) | 1.0% (50) |
| Pharmacies and drug stores | 0.4% (48) | 0.1% (6) | 0.8% (42) |
| Data processing, libraries, and other information services | 0.4% (46) | 0.3% (19) | 0.5% (27) |
| Clothing and accessories, including shoe, stores | 0.4% (46) | 0.6% (32) | 0.3% (14) |
| Furniture and related product manufacturing | 0.4% (43) | 0.7% (38) | 0.1% (5) |
| Warehousing and storage | 0.4% (42) | 0.5% (28) | 0.3% (14) |
| Farm product raw materials merchant wholesalers | 0.3% (35) | 0.2% (10) | 0.5% (25) |
| Private households | 0.3% (35) | 0.3% (19) | 0.3% (16) |
| Electrical and electronic goods merchant wholesalers | 0.3% (32) | 0.4% (23) | 0.2% (9) |
| Gasoline stations | 0.3% (30) | 0.2% (14) | 0.3% (16) |
| Metals and minerals, except petroleum, merchant wholesalers | 0.3% (30) | 0.5% (30) | 0.0% (0) |
| Drugs, sundries, and chemical and allied products merchant wholesalers | 0.3% (28) | 0.4% (20) | 0.2% (8) |
| Nonmetallic mineral products | 0.2% (26) | 0.3% (18) | 0.2% (8) |
| Furniture and home furnishings, and household appliance stores | 0.2% (21) | 0.1% (4) | 0.3% (17) |
| Recyclable material merchant wholesalers | 0.2% (21) | 0.3% (18) | 0.1% (3) |
| Rail transportation | 0.2% (20) | 0.4% (20) | 0.0% (0) |
| Petroleum and coal products | 0.2% (17) | 0.2% (9) | 0.2% (8) |
| Retail florists | 0.2% (17) | 0.0% (0) | 0.3% (17) |
| Book stores and news dealers | 0.2% (17) | 0.0% (0) | 0.3% (17) |
| Music stores | 0.1% (16) | 0.2% (13) | 0.1% (3) |
| Hardware, plumbing and heating equipment, and supplies merchant wholesalers | 0.1% (15) | 0.3% (15) | 0.0% (0) |
| Paper and paper products merchant wholesalers | 0.1% (15) | 0.1% (7) | 0.2% (8) |
| Office supplies and stationery stores | 0.1% (13) | 0.1% (6) | 0.1% (7) |
| Sewing, needlework, and piece goods stores | 0.1% (12) | 0.1% (8) | 0.1% (4) |
| Lumber and other construction materials merchant wholesalers | 0.1% (11) | 0.2% (11) | 0.0% (0) |
| Petroleum and petroleum products merchant wholesalers | 0.1% (11) | 0.2% (11) | 0.0% (0) |
| Textile mills and textile products | 0.1% (10) | 0.2% (10) | 0.0% (0) |
| Vending machine operators | 0.1% (10) | 0.2% (10) | 0.0% (0) |
| Water transportation | 0.1% (9) | 0.2% (9) | 0.0% (0) |
| Alcoholic beverages merchant wholesalers | 0.1% (8) | 0.1% (8) | 0.0% (0) |
| Electrical equipment, appliances, and components | 0.1% (7) | 0.1% (7) | 0.0% (0) |
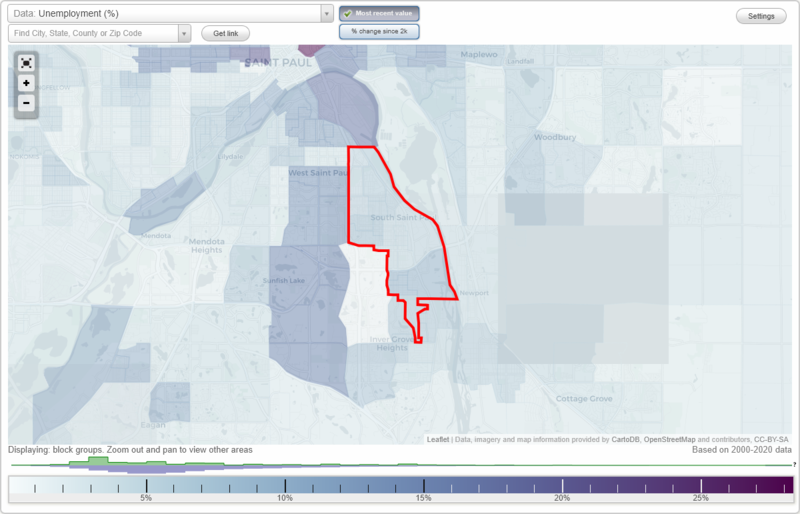
Unemployment in South St. Paul
- Unemployment by race in 2022
- Unemployment rate for White non-Hispanic residents
- 7.7%Males
- 2.6%Females
- Unemployment rate for Black residents
- 9.4%Males
- Unemployment rate for Asian residents
- 19.3%Females
- Unemployment rate for other race residents
- 5.6%Males
- 2.4%Females
- Unemployment rate for two or more race residents
- 8.7%Males
- Unemployment rate for Hispanic or Latino residents
- 9.0%Males
- 1.9%Females
- Unemployment by race in 2000
- Unemployment rate for White non-Hispanic residents
- 4.1%Males
- 3.8%Females
- Unemployment rate for Black residents
- 13.2%Males
- 14.3%Females
- Unemployment rate for Asian residents
- 10.0%Males
- Unemployment rate for Hispanic or Latino residents
- 4.5%Males
- 8.1%Females
Time leaving home to go to work
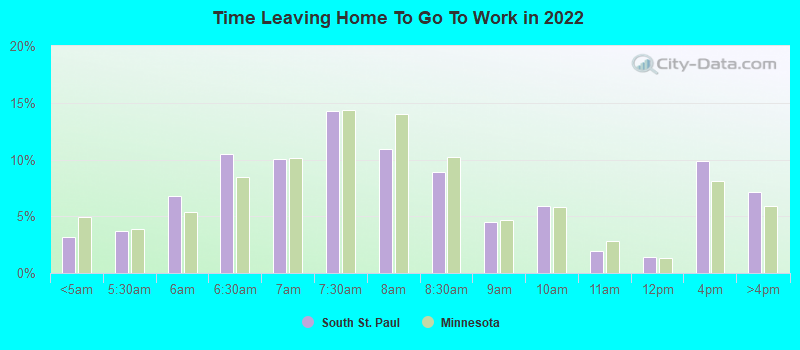
12:00 a.m. to 4:59 a.m.:
| South St. Paul: | 3.1% (296) |
| Minnesota: | 4.9% (120,781) |
5:00 a.m. to 5:29 a.m.:
| South St. Paul: | 3.7% (348) |
| Minnesota: | 3.8% (94,357) |
5:30 a.m. to 5:59 a.m.:
| South St. Paul: | 6.8% (639) |
| Minnesota: | 5.3% (131,116) |
6:00 a.m. to 6:29 a.m.:
| South St. Paul: | 10.5% (992) |
| Minnesota: | 8.4% (206,641) |
6:30 a.m. to 6:59 a.m.:
| South St. Paul: | 10.1% (954) |
| Minnesota: | 10.2% (249,032) |
7:00 a.m. to 7:29 a.m.:
| South St. Paul: | 14.3% (1,352) |
| Minnesota: | 14.4% (352,698) |
7:30 a.m. to 7:59 a.m.:
| South St. Paul: | 11.0% (1,038) |
| Minnesota: | 14.0% (344,046) |
8:00 a.m. to 8:29 a.m.:
| South St. Paul: | 8.9% (843) |
| Minnesota: | 10.2% (250,244) |
8:30 a.m. to 8:59 a.m.:
| South St. Paul: | 4.5% (428) |
| Minnesota: | 4.6% (113,732) |
9:00 a.m. to 9:59 a.m.:
| South St. Paul: | 5.9% (560) |
| Minnesota: | 5.8% (143,250) |
10:00 a.m. to 10:59 a.m.:
| South St. Paul: | 1.9% (182) |
| Minnesota: | 2.8% (69,598) |
11:00 a.m. to 11:59 a.m.:
| South St. Paul: | 1.4% (136) |
| Minnesota: | 1.3% (32,436) |
12:00 p.m. to 3:59 p.m.:
| South St. Paul: | 9.8% (932) |
| Minnesota: | 8.1% (199,389) |
4:00 p.m. to 11:59 p.m.:
| South St. Paul: | 7.1% (676) |
| Minnesota: | 5.9% (144,679) |
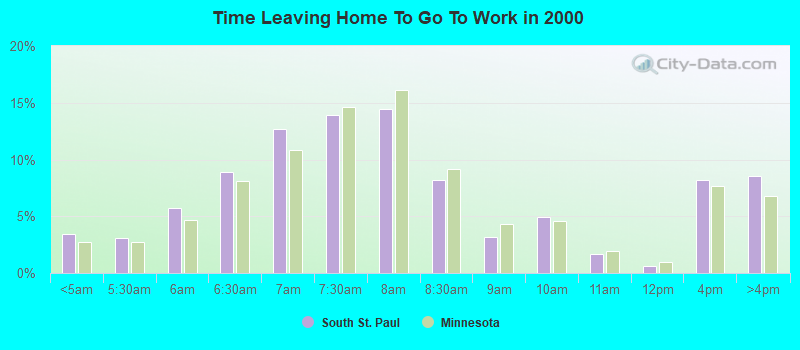
<5am:
| South St. Paul: | 3.4% (364) |
| Minnesota: | 2.8% (70,312) |
5:30am:
| South St. Paul: | 3.1% (329) |
| Minnesota: | 2.8% (70,053) |
6am:
| South St. Paul: | 5.7% (614) |
| Minnesota: | 4.7% (119,123) |
6:30am:
| South St. Paul: | 8.9% (952) |
| Minnesota: | 8.1% (206,893) |
7am:
| South St. Paul: | 12.6% (1,356) |
| Minnesota: | 10.8% (275,657) |
7:30am:
| South St. Paul: | 13.9% (1,491) |
| Minnesota: | 14.6% (371,966) |
8am:
| South St. Paul: | 14.5% (1,550) |
| Minnesota: | 16.2% (410,487) |
8:30am:
| South St. Paul: | 8.2% (881) |
| Minnesota: | 9.2% (233,326) |
9am:
| South St. Paul: | 3.2% (339) |
| Minnesota: | 4.3% (109,027) |
10am:
| South St. Paul: | 5.0% (533) |
| Minnesota: | 4.6% (117,544) |
11am:
| South St. Paul: | 1.7% (179) |
| Minnesota: | 1.9% (48,795) |
12pm:
| South St. Paul: | 0.7% (70) |
| Minnesota: | 1.0% (25,041) |
4pm:
| South St. Paul: | 8.2% (879) |
| Minnesota: | 7.7% (195,126) |
>4pm:
| South St. Paul: | 8.6% (917) |
| Minnesota: | 6.8% (171,607) |
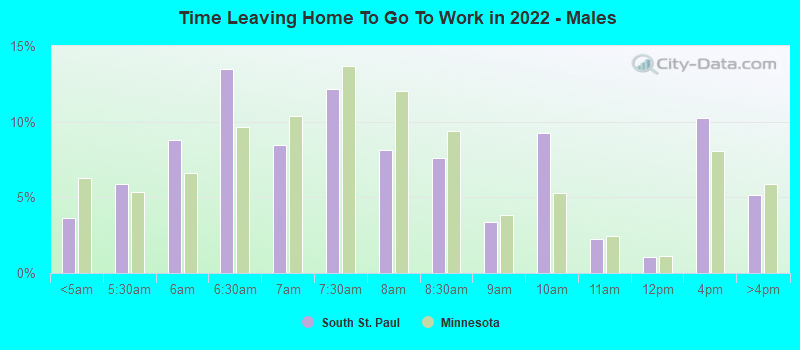
12:00 a.m. to 4:59 a.m. - Males:
| South St. Paul: | 3.6% (174) |
| Minnesota: | 6.3% (82,514) |
5:00 a.m. to 5:29 a.m. - Males:
| South St. Paul: | 5.9% (283) |
| Minnesota: | 5.4% (70,578) |
5:30 a.m. to 5:59 a.m. - Males:
| South St. Paul: | 8.8% (419) |
| Minnesota: | 6.6% (86,477) |
6:00 a.m. to 6:29 a.m. - Males:
| South St. Paul: | 13.5% (645) |
| Minnesota: | 9.7% (127,243) |
6:30 a.m. to 6:59 a.m. - Males:
| South St. Paul: | 8.5% (405) |
| Minnesota: | 10.4% (136,365) |
7:00 a.m. to 7:29 a.m. - Males:
| South St. Paul: | 12.2% (582) |
| Minnesota: | 13.7% (179,738) |
7:30 a.m. to 7:59 a.m. - Males:
| South St. Paul: | 8.1% (387) |
| Minnesota: | 12.0% (158,107) |
8:00 a.m. to 8:29 a.m. - Males:
| South St. Paul: | 7.6% (362) |
| Minnesota: | 9.4% (123,700) |
8:30 a.m. to 8:59 a.m. - Males:
| South St. Paul: | 3.4% (162) |
| Minnesota: | 3.8% (49,970) |
9:00 a.m. to 9:59 a.m. - Males:
| South St. Paul: | 9.2% (442) |
| Minnesota: | 5.3% (69,327) |
10:00 a.m. to 10:59 a.m. - Males:
| South St. Paul: | 2.2% (106) |
| Minnesota: | 2.4% (32,133) |
11:00 a.m. to 11:59 a.m. - Males:
| South St. Paul: | 1.1% (51) |
| Minnesota: | 1.2% (15,147) |
12:00 p.m. to 3:59 p.m. - Males:
| South St. Paul: | 10.3% (490) |
| Minnesota: | 8.1% (106,315) |
4:00 p.m. to 11:59 p.m. - Males:
| South St. Paul: | 5.2% (247) |
| Minnesota: | 5.9% (77,278) |
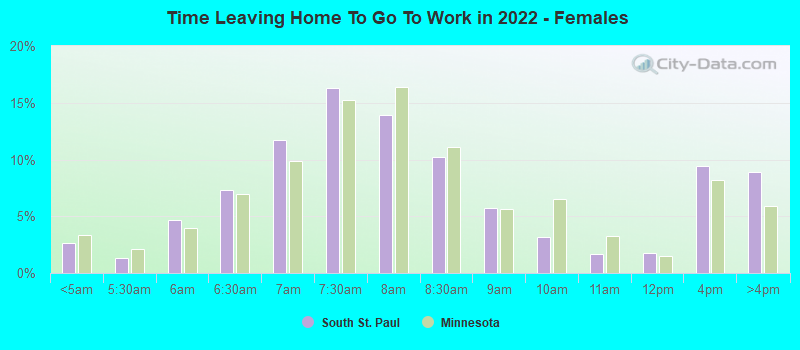
12:00 a.m. to 4:59 a.m. - Females:
| South St. Paul: | 2.7% (125) |
| Minnesota: | 3.4% (38,267) |
5:00 a.m. to 5:29 a.m. - Females:
| South St. Paul: | 1.3% (63) |
| Minnesota: | 2.1% (23,779) |
5:30 a.m. to 5:59 a.m. - Females:
| South St. Paul: | 4.7% (220) |
| Minnesota: | 3.9% (44,639) |
6:00 a.m. to 6:29 a.m. - Females:
| South St. Paul: | 7.3% (343) |
| Minnesota: | 7.0% (79,398) |
6:30 a.m. to 6:59 a.m. - Females:
| South St. Paul: | 11.8% (551) |
| Minnesota: | 9.9% (112,667) |
7:00 a.m. to 7:29 a.m. - Females:
| South St. Paul: | 16.3% (762) |
| Minnesota: | 15.2% (172,960) |
7:30 a.m. to 7:59 a.m. - Females:
| South St. Paul: | 13.9% (653) |
| Minnesota: | 16.4% (185,939) |
8:00 a.m. to 8:29 a.m. - Females:
| South St. Paul: | 10.3% (480) |
| Minnesota: | 11.1% (126,544) |
8:30 a.m. to 8:59 a.m. - Females:
| South St. Paul: | 5.7% (267) |
| Minnesota: | 5.6% (63,762) |
9:00 a.m. to 9:59 a.m. - Females:
| South St. Paul: | 3.2% (148) |
| Minnesota: | 6.5% (73,923) |
10:00 a.m. to 10:59 a.m. - Females:
| South St. Paul: | 1.6% (77) |
| Minnesota: | 3.3% (37,465) |
11:00 a.m. to 11:59 a.m. - Females:
| South St. Paul: | 1.8% (84) |
| Minnesota: | 1.5% (17,289) |
12:00 p.m. to 3:59 p.m. - Females:
| South St. Paul: | 9.5% (443) |
| Minnesota: | 8.2% (93,074) |
4:00 p.m. to 11:59 p.m. - Females:
| South St. Paul: | 8.9% (415) |
| Minnesota: | 5.9% (67,401) |
Travel time to work
Percentage of workers working in this county: 50.1%
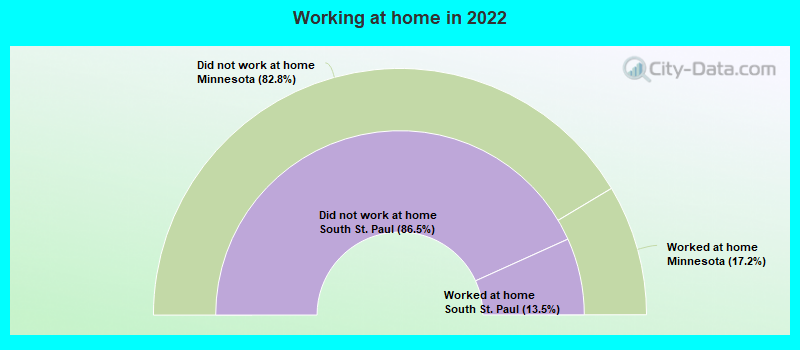
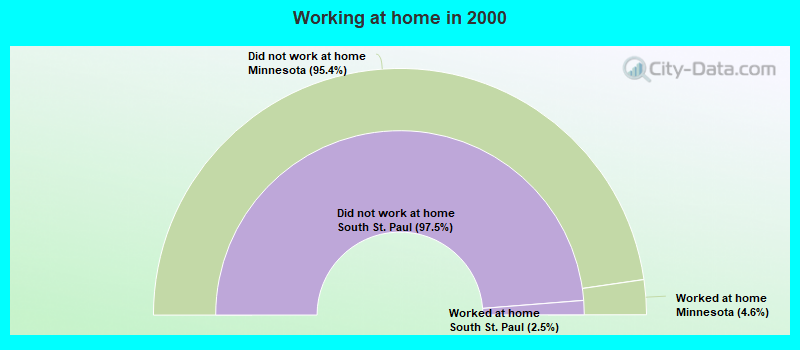
Number of people working at home: 1,105 (9.8% of all workers)
Daytime population change due to commuting: -3,359 (-16.7%)
Workers who live and work in this city: 1,734 (16.2%)
Number of people working at home: 1,105 (9.8% of all workers)
Daytime population change due to commuting: -3,359 (-16.7%)
Workers who live and work in this city: 1,734 (16.2%)
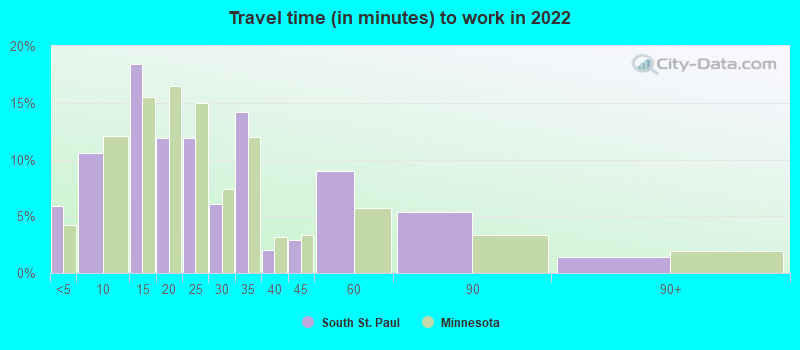
Less than 5 minutes:
| South St. Paul: | 5.9% (333) |
| Minnesota: | 4.2% (103,861) |
5 to 9 minutes:
| South St. Paul: | 10.6% (603) |
| Minnesota: | 12.0% (295,785) |
10 to 14 minutes:
| South St. Paul: | 18.4% (1,045) |
| Minnesota: | 15.5% (380,826) |
15 to 19 minutes:
| South St. Paul: | 11.9% (678) |
| Minnesota: | 16.5% (404,549) |
20 to 24 minutes:
| South St. Paul: | 11.9% (674) |
| Minnesota: | 15.0% (367,833) |
25 to 29 minutes:
| South St. Paul: | 6.1% (344) |
| Minnesota: | 7.4% (182,328) |
30 to 34 minutes:
| South St. Paul: | 14.2% (808) |
| Minnesota: | 12.0% (294,767) |
35 to 39 minutes:
| South St. Paul: | 2.1% (117) |
| Minnesota: | 3.1% (77,358) |
40 to 44 minutes:
| South St. Paul: | 2.9% (167) |
| Minnesota: | 3.4% (82,472) |
45 to 59 minutes:
| South St. Paul: | 9.0% (513) |
| Minnesota: | 5.7% (139,792) |
60 to 89 minutes:
| South St. Paul: | 5.4% (308) |
| Minnesota: | 3.3% (81,373) |
90 or more minutes:
| South St. Paul: | 1.5% (83) |
| Minnesota: | 1.9% (47,134) |
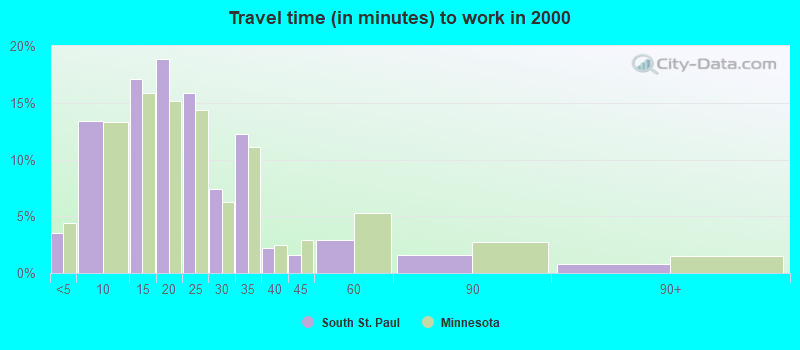
Less than 5 minutes:
| South St. Paul: | 3.5% (380) |
| Minnesota: | 4.4% (112,704) |
5 to 9 minutes:
| South St. Paul: | 13.4% (1,438) |
| Minnesota: | 13.3% (338,699) |
10 to 14 minutes:
| South St. Paul: | 17.1% (1,831) |
| Minnesota: | 15.9% (403,004) |
15 to 19 minutes:
| South St. Paul: | 18.9% (2,023) |
| Minnesota: | 15.1% (384,560) |
20 to 24 minutes:
| South St. Paul: | 15.9% (1,705) |
| Minnesota: | 14.4% (365,773) |
25 to 29 minutes:
| South St. Paul: | 7.4% (798) |
| Minnesota: | 6.2% (158,419) |
30 to 34 minutes:
| South St. Paul: | 12.3% (1,317) |
| Minnesota: | 11.1% (282,272) |
35 to 39 minutes:
| South St. Paul: | 2.2% (232) |
| Minnesota: | 2.5% (63,572) |
40 to 44 minutes:
| South St. Paul: | 1.6% (172) |
| Minnesota: | 2.9% (74,188) |
45 to 59 minutes:
| South St. Paul: | 2.9% (310) |
| Minnesota: | 5.3% (133,528) |
60 to 89 minutes:
| South St. Paul: | 1.5% (166) |
| Minnesota: | 2.7% (69,503) |
90 or more minutes:
| South St. Paul: | 0.8% (82) |
| Minnesota: | 1.5% (38,735) |
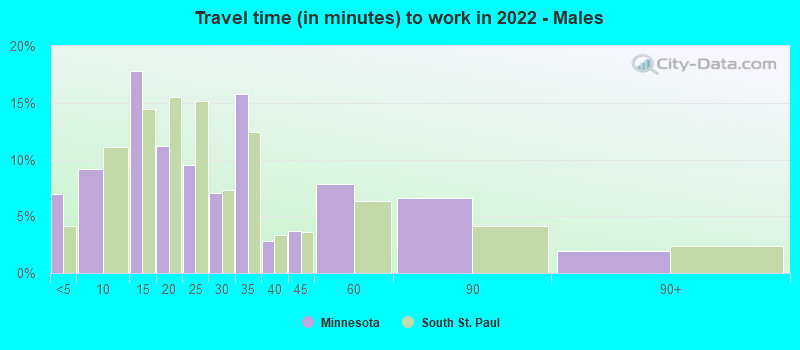
Less than 5 minutes - Males:
| South St. Paul: | 6.9% (253) |
| Minnesota: | 4.1% (54,466) |
5 to 9 minutes - Males:
| South St. Paul: | 9.1% (333) |
| Minnesota: | 11.1% (146,289) |
10 to 14 minutes - Males:
| South St. Paul: | 17.8% (648) |
| Minnesota: | 14.4% (189,693) |
15 to 19 minutes - Males:
| South St. Paul: | 11.1% (406) |
| Minnesota: | 15.5% (204,410) |
20 to 24 minutes - Males:
| South St. Paul: | 9.5% (346) |
| Minnesota: | 15.1% (199,117) |
25 to 29 minutes - Males:
| South St. Paul: | 7.1% (258) |
| Minnesota: | 7.3% (96,577) |
30 to 34 minutes - Males:
| South St. Paul: | 15.8% (574) |
| Minnesota: | 12.5% (163,847) |
35 to 39 minutes - Males:
| South St. Paul: | 2.8% (102) |
| Minnesota: | 3.4% (44,588) |
40 to 44 minutes - Males:
| South St. Paul: | 3.7% (135) |
| Minnesota: | 3.6% (47,517) |
45 to 59 minutes - Males:
| South St. Paul: | 7.8% (284) |
| Minnesota: | 6.4% (83,892) |
60 to 89 minutes - Males:
| South St. Paul: | 6.6% (239) |
| Minnesota: | 4.1% (53,961) |
90 or more minutes - Males:
| South St. Paul: | 1.9% (70) |
| Minnesota: | 2.4% (31,003) |
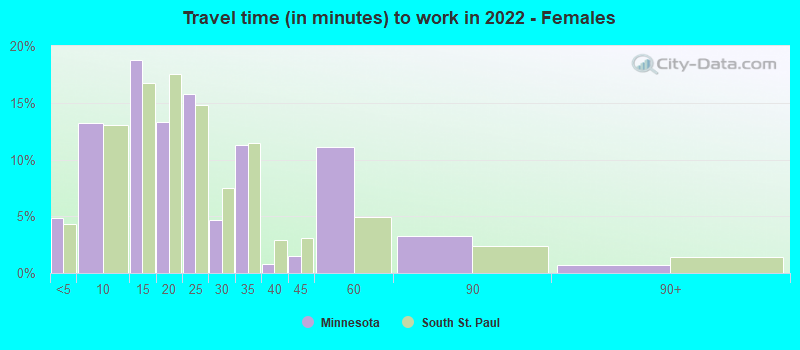
Less than 5 minutes - Females:
| South St. Paul: | 4.8% (100) |
| Minnesota: | 4.3% (49,395) |
5 to 9 minutes - Females:
| South St. Paul: | 13.2% (272) |
| Minnesota: | 13.1% (149,496) |
10 to 14 minutes - Females:
| South St. Paul: | 18.8% (388) |
| Minnesota: | 16.7% (191,133) |
15 to 19 minutes - Females:
| South St. Paul: | 13.3% (274) |
| Minnesota: | 17.5% (200,139) |
20 to 24 minutes - Females:
| South St. Paul: | 15.7% (325) |
| Minnesota: | 14.8% (168,716) |
25 to 29 minutes - Females:
| South St. Paul: | 4.7% (97) |
| Minnesota: | 7.5% (85,751) |
30 to 34 minutes - Females:
| South St. Paul: | 11.3% (234) |
| Minnesota: | 11.5% (130,920) |
35 to 39 minutes - Females:
| South St. Paul: | 0.8% (16) |
| Minnesota: | 2.9% (32,770) |
40 to 44 minutes - Females:
| South St. Paul: | 1.5% (32) |
| Minnesota: | 3.1% (34,955) |
45 to 59 minutes - Females:
| South St. Paul: | 11.1% (229) |
| Minnesota: | 4.9% (55,900) |
60 to 89 minutes - Females:
| South St. Paul: | 3.3% (68) |
| Minnesota: | 2.4% (27,412) |
90 or more minutes - Females:
| South St. Paul: | 0.7% (14) |
| Minnesota: | 1.4% (16,131) |
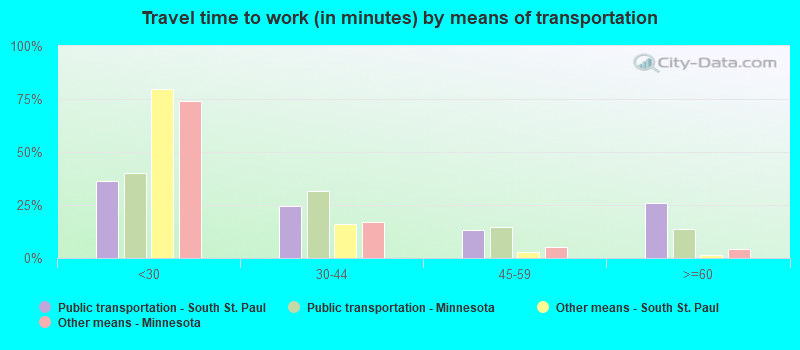
Means of transportation to work
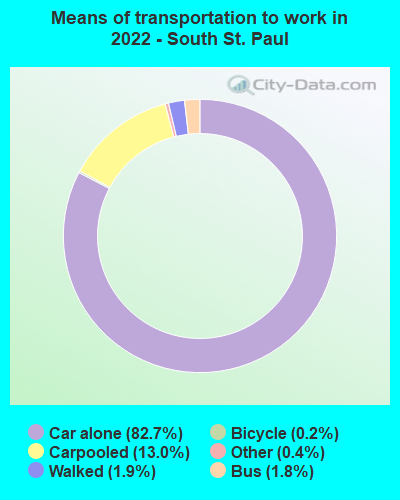
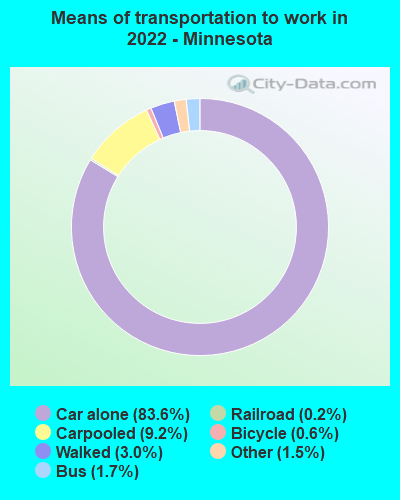
Drove car alone:
| South St. Paul: | 82.7% (5,076) |
| Minnesota: | 83.6% (951,223) |
Carpooled:
| South St. Paul: | 13.0% (798) |
| Minnesota: | 9.2% (113,324) |
Bus:
| South St. Paul: | 1.8% (110) |
| Minnesota: | 1.7% (17,615) |
Bicycle:
| South St. Paul: | 0.2% (9) |
| Minnesota: | 0.6% (4,411) |
Walked:
| South St. Paul: | 1.9% (114) |
| Minnesota: | 3.0% (35,804) |
Other means:
| South St. Paul: | 0.4% (26) |
| Minnesota: | 1.5% (16,136) |

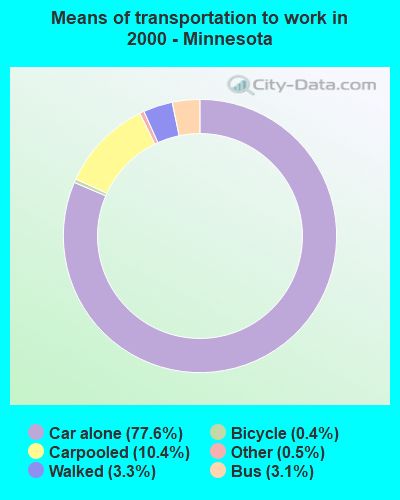
Drove car alone:
| South St. Paul: | 80.4% (8,616) |
| Minnesota: | 77.6% (1,971,668) |
Carpooled:
| South St. Paul: | 11.9% (1,279) |
| Minnesota: | 10.4% (264,690) |
Bus or trolley bus:
| South St. Paul: | 3.1% (330) |
| Minnesota: | 3.1% (78,691) |
Motorcycle:
| South St. Paul: | 0.1% (7) |
| Minnesota: | 0.1% (1,347) |
Bicycle:
| South St. Paul: | 0.1% (9) |
| Minnesota: | 0.4% (10,096) |
Walked:
| South St. Paul: | 1.2% (129) |
| Minnesota: | 3.3% (84,148) |
Other means:
| South St. Paul: | 0.8% (84) |
| Minnesota: | 0.5% (11,732) |
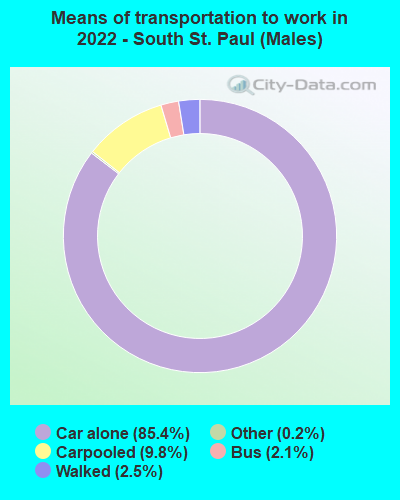

Drove car alone - Males:
| South St. Paul: | 85.4% (3,324) |
| Minnesota: | 84.0% (951,223) |
Carpooled - Males:
| South St. Paul: | 9.8% (383) |
| Minnesota: | 8.7% (113,324) |
Bus - Males:
| South St. Paul: | 2.1% (81) |
| Minnesota: | 1.8% (17,615) |
Walked - Males:
| South St. Paul: | 2.5% (96) |
| Minnesota: | 3.0% (35,804) |
Other means - Males:
| South St. Paul: | 0.2% (7) |
| Minnesota: | 1.7% (16,136) |
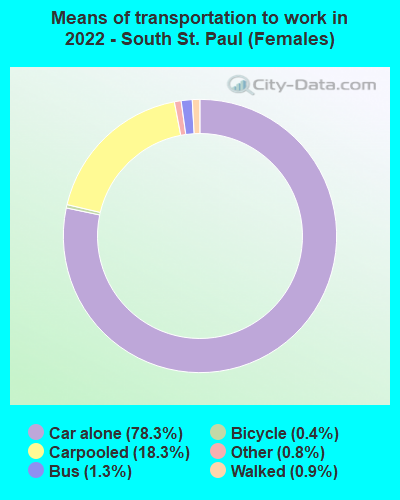

Drove car alone - Females:
| South St. Paul: | 78.3% (1,768) |
| Minnesota: | 83.2% (951,223) |
Carpooled - Females:
| South St. Paul: | 18.3% (414) |
| Minnesota: | 9.9% (113,324) |
Bus - Females:
| South St. Paul: | 1.3% (30) |
| Minnesota: | 1.5% (17,615) |
Bicycle - Females:
| South St. Paul: | 0.4% (9) |
| Minnesota: | 0.4% (4,411) |
Walked - Females:
| South St. Paul: | 0.9% (20) |
| Minnesota: | 3.1% (35,804) |
Other means - Females:
| South St. Paul: | 0.8% (19) |
| Minnesota: | 1.4% (16,136) |
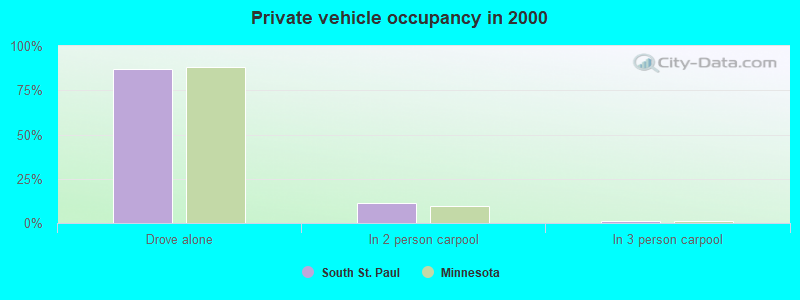
Private vehicle occupancy

Drove alone:
| South St. Paul: | 87.1% (7,867) |
| Minnesota: | 90.0% (2,050,351) |
In 2 person carpool:
| South St. Paul: | 10.3% (933) |
| Minnesota: | 7.3% (166,995) |
In 3 person carpool:
| South St. Paul: | 1.8% (165) |
| Minnesota: | 1.6% (35,947) |
In 4 person carpool:
| South St. Paul: | 0.6% (51) |
| Minnesota: | 0.6% (14,494) |
In 5-6 person carpool:
| South St. Paul: | 0.1% (6) |
| Minnesota: | 0.3% (7,468) |
In 7+ person carpool:
| South St. Paul: | 0.1% (11) |
| Minnesota: | 0.1% (2,547) |
Drove alone:
| South St. Paul: | 87.1% (8,616) |
| Minnesota: | 88.2% (1,971,668) |
In 2 person carpool:
| South St. Paul: | 11.2% (1,107) |
| Minnesota: | 9.6% (215,251) |
In 3 person carpool:
| South St. Paul: | 1.1% (107) |
| Minnesota: | 1.4% (31,043) |
In 4 person carpool:
| South St. Paul: | 0.6% (58) |
| Minnesota: | 0.5% (10,144) |
In 5-6 person carpool:
| South St. Paul: | 0.1% (7) |
| Minnesota: | 0.2% (4,827) |
Class of workers
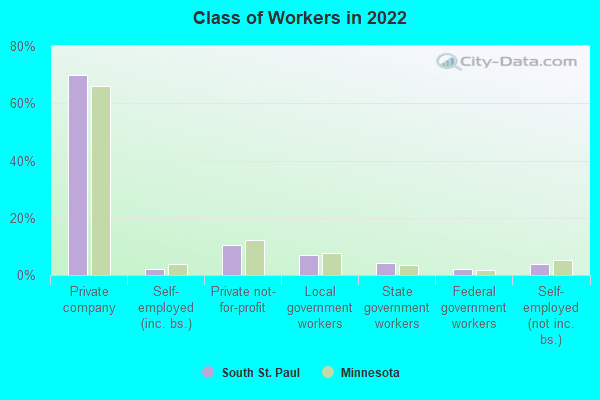
Employee of private company:
| South St. Paul: | 70.0% (8,021) |
| Minnesota: | 65.9% (1,982,190) |
Self-employed in own incorporated business:
| South St. Paul: | 2.1% (237) |
| Minnesota: | 4.0% (119,417) |
Private not-for-profit wage and salary workers:
| South St. Paul: | 10.7% (1,220) |
| Minnesota: | 12.1% (364,175) |
Local government workers:
| South St. Paul: | 7.1% (808) |
| Minnesota: | 7.5% (226,630) |
State government workers:
| South St. Paul: | 4.3% (498) |
| Minnesota: | 3.4% (102,331) |
Federal government workers:
| South St. Paul: | 2.2% (247) |
| Minnesota: | 1.6% (48,213) |
Self-employed workers in own not incorporated business:
| South St. Paul: | 3.7% (425) |
| Minnesota: | 5.3% (160,154) |
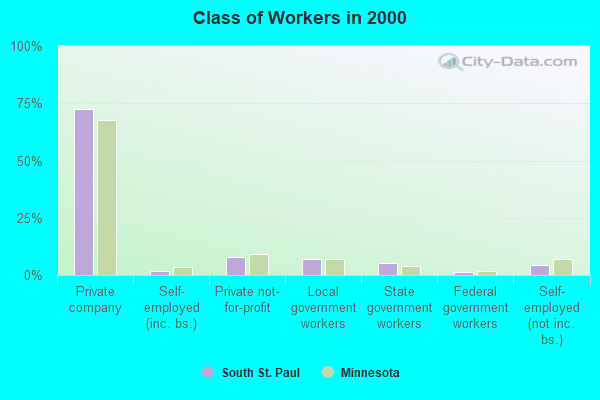
Employee of private company:
| South St. Paul: | 72.4% (7,884) |
| Minnesota: | 67.7% (1,747,303) |
Self-employed in own incorporated business:
| South St. Paul: | 1.8% (193) |
| Minnesota: | 3.3% (85,391) |
Private not-for-profit wage and salary workers:
| South St. Paul: | 7.7% (834) |
| Minnesota: | 9.4% (241,738) |
Local government workers:
| South St. Paul: | 6.9% (747) |
| Minnesota: | 6.8% (175,282) |
State government workers:
| South St. Paul: | 5.2% (561) |
| Minnesota: | 4.0% (101,959) |
Federal government workers:
| South St. Paul: | 1.5% (160) |
| Minnesota: | 1.6% (41,691) |
Self-employed workers in own not incorporated business:
| South St. Paul: | 4.4% (484) |
| Minnesota: | 6.9% (178,586) |
Unpaid family workers:
| South St. Paul: | 0.2% (20) |
| Minnesota: | 0.3% (8,096) |
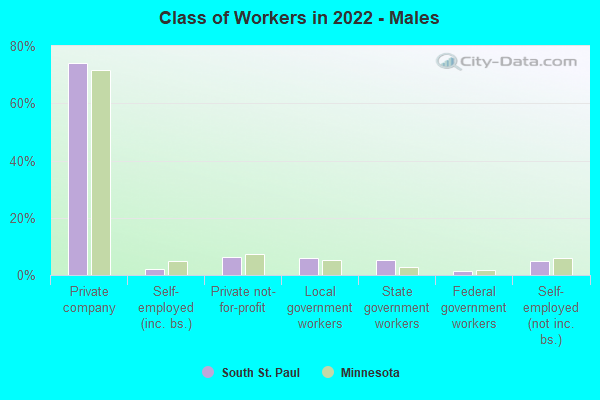
Employee of private company - Males:
| South St. Paul: | 73.9% (4,269) |
| Minnesota: | 71.5% (1,128,925) |
Self-employed in own incorporated business - Males:
| South St. Paul: | 2.3% (131) |
| Minnesota: | 5.0% (79,524) |
Private not-for-profit wage and salary workers - Males:
| South St. Paul: | 6.4% (370) |
| Minnesota: | 7.4% (117,071) |
Local government workers - Males:
| South St. Paul: | 5.9% (343) |
| Minnesota: | 5.3% (83,941) |
State government workers - Males:
| South St. Paul: | 5.1% (293) |
| Minnesota: | 2.8% (44,695) |
Federal government workers - Males:
| South St. Paul: | 1.4% (80) |
| Minnesota: | 1.6% (25,848) |
Self-employed workers in own not incorporated business - Males:
| South St. Paul: | 5.0% (291) |
| Minnesota: | 6.0% (94,953) |
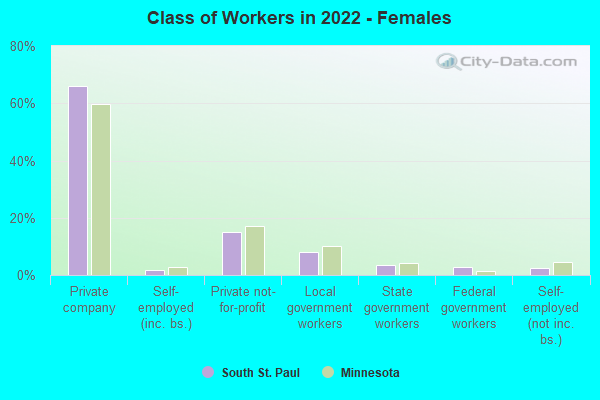
Employee of private company - Females:
| South St. Paul: | 66.1% (3,751) |
| Minnesota: | 59.6% (853,265) |
Self-employed in own incorporated business - Females:
| South St. Paul: | 1.9% (107) |
| Minnesota: | 2.8% (39,893) |
Private not-for-profit wage and salary workers - Females:
| South St. Paul: | 15.0% (850) |
| Minnesota: | 17.3% (247,104) |
Local government workers - Females:
| South St. Paul: | 8.2% (465) |
| Minnesota: | 10.0% (142,689) |
State government workers - Females:
| South St. Paul: | 3.6% (205) |
| Minnesota: | 4.0% (57,636) |
Federal government workers - Females:
| South St. Paul: | 2.9% (167) |
| Minnesota: | 1.6% (22,365) |
Self-employed workers in own not incorporated business - Females:
| South St. Paul: | 2.4% (134) |
| Minnesota: | 4.6% (65,201) |