Work and Jobs in St. Paul, Oregon (OR) Detailed Stats
Occupations, Industries, Unemployment, Workers, Commute
Settings
X


Discuss St. Paul, Oregon work on our local forum with over 2,400,000 registered users
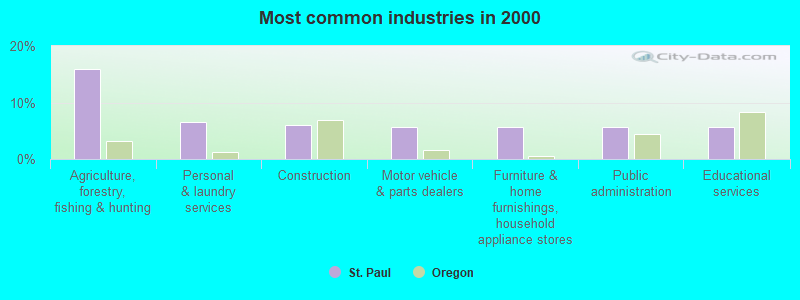
The most common industries in St. Paul are: Agriculture, forestry, fishing & hunting (15.9% of civilian employees), Personal & laundry services (6.5% of civilian employees), Construction (6.1% of civilian employees). 61.8% of workers work in Marion County and 8.3% of all workers work at home. 64.8% of workers are employees of private companies, which is about the same as the rate of 64.9% across the entire state of Oregon.
Whole page based on the data from 2000 / 2022 when the population of St. Paul, Oregon was 354 / 402
Whole page based on the data from 2000 / 2022 when the population of St. Paul, Oregon was 354 / 402
Most common industries
Most common industries | |||
|---|---|---|---|
Industry | All | Males | Females |
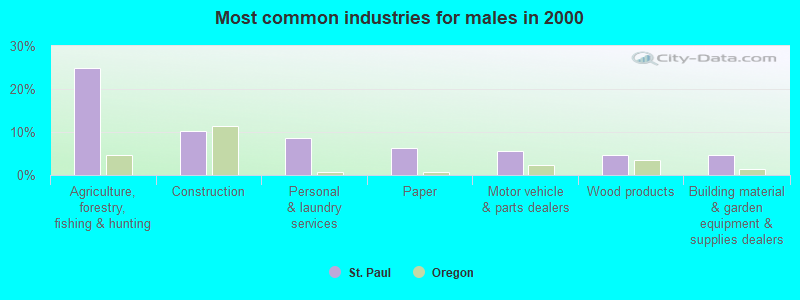
| Agriculture, forestry, fishing and hunting | 15.9% (34) | 25.0% (32) | 2.3% (2) |
| Personal and laundry services | 6.5% (14) | 8.6% (11) | 3.5% (3) |
| Construction | 6.1% (13) | 10.2% (13) | 0.0% (0) |
| Motor vehicle and parts dealers | 5.6% (12) | 5.5% (7) | 5.8% (5) |
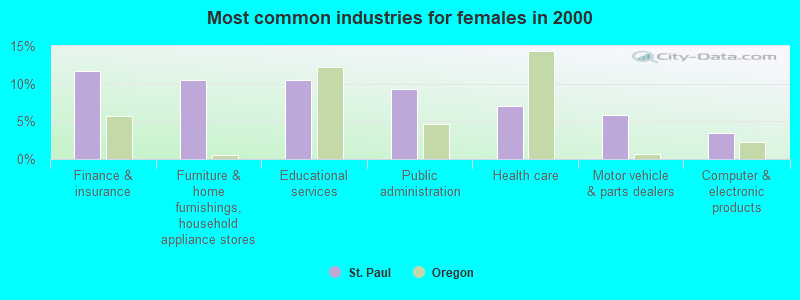
| Furniture and home furnishings, and household appliance stores | 5.6% (12) | 2.3% (3) | 10.5% (9) |
| Public administration | 5.6% (12) | 3.1% (4) | 9.3% (8) |
| Educational services | 5.6% (12) | 2.3% (3) | 10.5% (9) |
| Paper | 4.7% (10) | 6.2% (8) | 2.3% (2) |
| Finance and insurance | 4.7% (10) | 0.0% (0) | 11.6% (10) |
| Wood products | 2.8% (6) | 4.7% (6) | 0.0% (0) |
| Building material and garden equipment and supplies dealers | 2.8% (6) | 4.7% (6) | 0.0% (0) |
| Health care | 2.8% (6) | 0.0% (0) | 7.0% (6) |
| Utilities | 2.3% (5) | 3.9% (5) | 0.0% (0) |
| Computer and electronic products | 2.3% (5) | 1.6% (2) | 3.5% (3) |
| Radio, TV, and computer stores | 2.3% (5) | 1.6% (2) | 3.5% (3) |
| Machinery, equipment, and supplies merchant wholesalers | 1.9% (4) | 3.1% (4) | 0.0% (0) |
| Real estate and rental and leasing | 1.9% (4) | 1.6% (2) | 2.3% (2) |
| Repair and maintenance | 1.9% (4) | 3.1% (4) | 0.0% (0) |
| Food and beverage stores | 1.4% (3) | 0.0% (0) | 3.5% (3) |
| Machinery | 1.4% (3) | 2.3% (3) | 0.0% (0) |
| Pharmacies and drug stores | 1.4% (3) | 2.3% (3) | 0.0% (0) |
| Broadcasting and telecommunications | 1.4% (3) | 2.3% (3) | 0.0% (0) |
| Accommodation and food services | 1.4% (3) | 0.0% (0) | 3.5% (3) |
| Religious, grantmaking, civic, professional, and similar organizations | 1.4% (3) | 1.6% (2) | 1.2% (1) |
| Administrative and support and waste management services | 0.9% (2) | 1.6% (2) | 0.0% (0) |
| Sporting goods, camera, and hobby and toy stores | 0.9% (2) | 0.0% (0) | 2.3% (2) |
| Used merchandise, gift, novelty, and souvenir, and other miscellaneous stores | 0.9% (2) | 0.0% (0) | 2.3% (2) |
| Social assistance | 0.9% (2) | 0.0% (0) | 2.3% (2) |
| Arts, entertainment, and recreation | 0.9% (2) | 1.6% (2) | 0.0% (0) |
| Food | 0.9% (2) | 0.8% (1) | 1.2% (1) |
| Miscellaneous manufacturing | 0.9% (2) | 0.0% (0) | 2.3% (2) |
| Clothing and accessories, including shoe, stores | 0.9% (2) | 0.0% (0) | 2.3% (2) |
| Professional, scientific, and technical services | 0.9% (2) | 0.0% (0) | 2.3% (2) |
| Private households | 0.9% (2) | 0.0% (0) | 2.3% (2) |
| Nonmetallic mineral products | 0.5% (1) | 0.0% (0) | 1.2% (1) |
| Metal and metal products | 0.5% (1) | 0.0% (0) | 1.2% (1) |
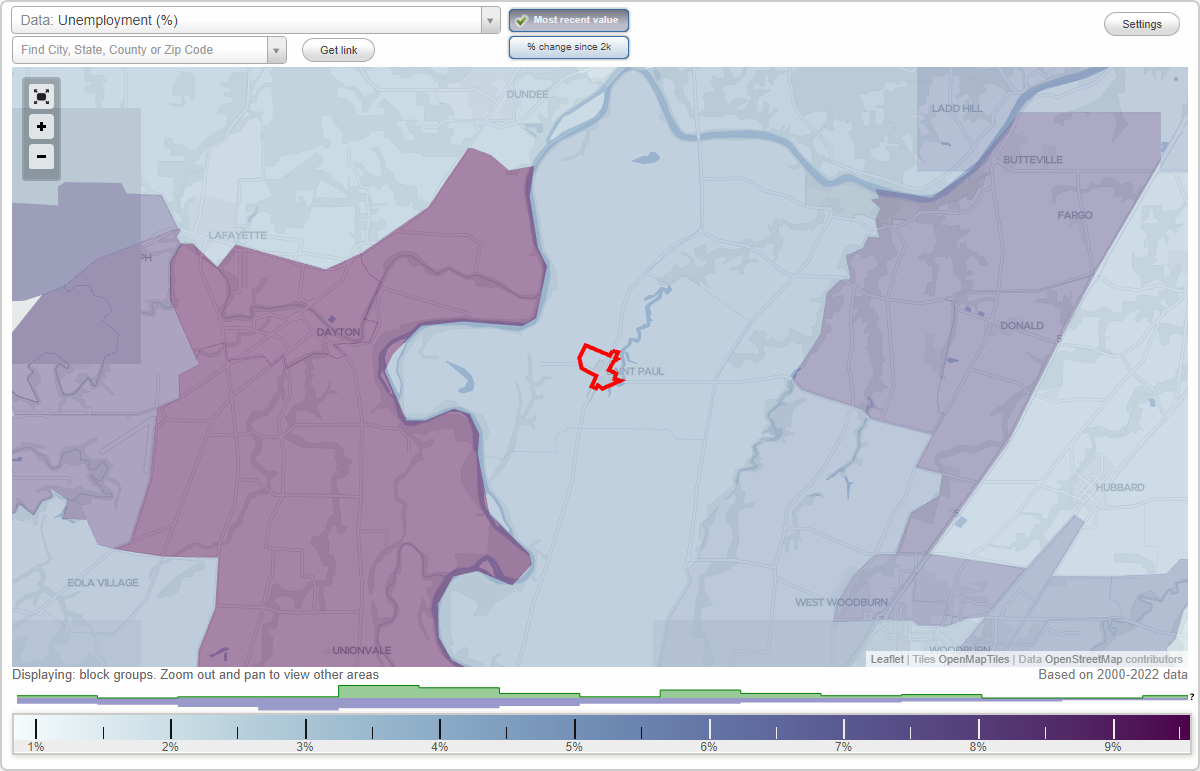
Unemployment in St. Paul
- Unemployment by race in 2022
- Unemployment rate for White non-Hispanic residents
- 1.1%Females
- Unemployment by race in 2000
- Unemployment rate for White non-Hispanic residents
- 2.9%Males
- 1.5%Females
- Unemployment rate for other race residents
- 12.8%Males
- Unemployment rate for Hispanic or Latino residents
- 9.5%Males
Time leaving home to go to work
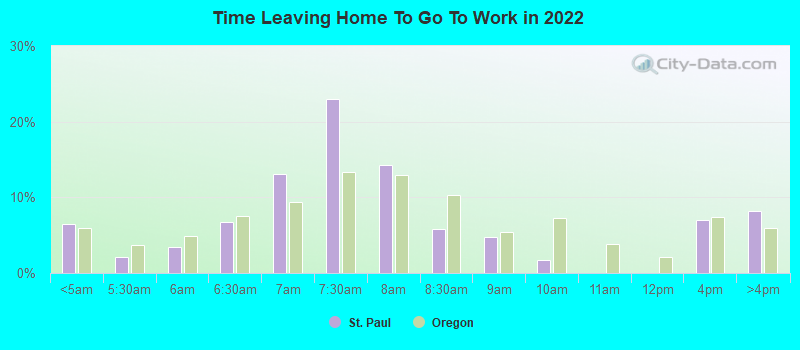
12:00 a.m. to 4:59 a.m.:
| St. Paul: | 6.5% (12) |
| Oregon: | 5.9% (98,245) |
5:00 a.m. to 5:29 a.m.:
| St. Paul: | 2.1% (4) |
| Oregon: | 3.7% (61,686) |
5:30 a.m. to 5:59 a.m.:
| St. Paul: | 3.5% (7) |
| Oregon: | 4.9% (81,016) |
6:00 a.m. to 6:29 a.m.:
| St. Paul: | 6.8% (13) |
| Oregon: | 7.6% (125,831) |
6:30 a.m. to 6:59 a.m.:
| St. Paul: | 13.1% (25) |
| Oregon: | 9.4% (157,114) |
7:00 a.m. to 7:29 a.m.:
| St. Paul: | 23.1% (43) |
| Oregon: | 13.4% (222,929) |
7:30 a.m. to 7:59 a.m.:
| St. Paul: | 14.3% (27) |
| Oregon: | 12.9% (215,364) |
8:00 a.m. to 8:29 a.m.:
| St. Paul: | 5.7% (11) |
| Oregon: | 10.4% (172,765) |
8:30 a.m. to 8:59 a.m.:
| St. Paul: | 4.8% (9) |
| Oregon: | 5.4% (89,869) |
9:00 a.m. to 9:59 a.m.:
| St. Paul: | 1.7% (3) |
| Oregon: | 7.2% (120,009) |
12:00 p.m. to 3:59 p.m.:
| St. Paul: | 7.0% (13) |
| Oregon: | 7.4% (123,119) |
4:00 p.m. to 11:59 p.m.:
| St. Paul: | 8.1% (15) |
| Oregon: | 6.0% (99,745) |
<5am:
| St. Paul: | 3.8% (8) |
| Oregon: | 3.7% (58,821) |
5:30am:
| St. Paul: | 0.5% (1) |
| Oregon: | 2.8% (44,872) |
6am:
| St. Paul: | 3.3% (7) |
| Oregon: | 4.4% (71,163) |
6:30am:
| St. Paul: | 8.5% (18) |
| Oregon: | 7.7% (122,707) |
7am:
| St. Paul: | 17.9% (38) |
| Oregon: | 10.3% (165,185) |
7:30am:
| St. Paul: | 10.8% (23) |
| Oregon: | 13.9% (222,209) |
8am:
| St. Paul: | 20.3% (43) |
| Oregon: | 15.3% (245,415) |
8:30am:
| St. Paul: | 8.5% (18) |
| Oregon: | 9.8% (156,781) |
9am:
| St. Paul: | 4.2% (9) |
| Oregon: | 4.9% (78,436) |
10am:
| St. Paul: | 0.9% (2) |
| Oregon: | 5.5% (88,783) |
12pm:
| St. Paul: | 1.4% (3) |
| Oregon: | 1.3% (20,765) |
4pm:
| St. Paul: | 3.3% (7) |
| Oregon: | 6.8% (108,927) |
>4pm:
| St. Paul: | 1.9% (4) |
| Oregon: | 6.0% (95,989) |
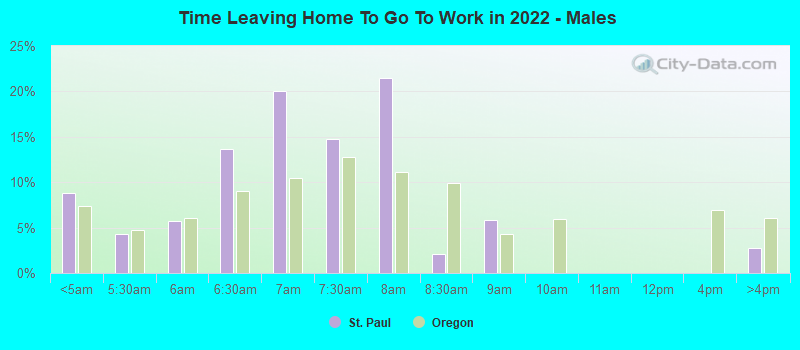
12:00 a.m. to 4:59 a.m. - Males:
| St. Paul: | 8.8% (8) |
| Oregon: | 7.4% (66,534) |
5:00 a.m. to 5:29 a.m. - Males:
| St. Paul: | 4.3% (4) |
| Oregon: | 4.8% (42,985) |
5:30 a.m. to 5:59 a.m. - Males:
| St. Paul: | 5.8% (6) |
| Oregon: | 6.1% (54,375) |
6:00 a.m. to 6:29 a.m. - Males:
| St. Paul: | 13.7% (13) |
| Oregon: | 9.0% (80,638) |
6:30 a.m. to 6:59 a.m. - Males:
| St. Paul: | 20.0% (19) |
| Oregon: | 10.4% (93,611) |
7:00 a.m. to 7:29 a.m. - Males:
| St. Paul: | 14.7% (14) |
| Oregon: | 12.8% (114,794) |
7:30 a.m. to 7:59 a.m. - Males:
| St. Paul: | 21.5% (21) |
| Oregon: | 11.1% (99,832) |
8:00 a.m. to 8:29 a.m. - Males:
| St. Paul: | 2.1% (2) |
| Oregon: | 10.0% (89,351) |
8:30 a.m. to 8:59 a.m. - Males:
| St. Paul: | 5.8% (6) |
| Oregon: | 4.3% (38,595) |
4:00 p.m. to 11:59 p.m. - Males:
| St. Paul: | 2.7% (3) |
| Oregon: | 6.0% (54,001) |
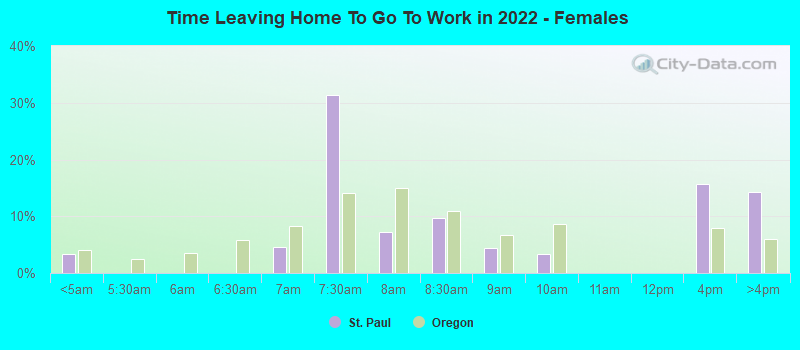
12:00 a.m. to 4:59 a.m. - Females:
| St. Paul: | 3.4% (3) |
| Oregon: | 4.1% (31,711) |
6:30 a.m. to 6:59 a.m. - Females:
| St. Paul: | 4.7% (4) |
| Oregon: | 8.3% (63,503) |
7:00 a.m. to 7:29 a.m. - Females:
| St. Paul: | 31.4% (29) |
| Oregon: | 14.1% (108,135) |
7:30 a.m. to 7:59 a.m. - Females:
| St. Paul: | 7.1% (6) |
| Oregon: | 15.0% (115,532) |
8:00 a.m. to 8:29 a.m. - Females:
| St. Paul: | 9.8% (9) |
| Oregon: | 10.9% (83,414) |
8:30 a.m. to 8:59 a.m. - Females:
| St. Paul: | 4.4% (4) |
| Oregon: | 6.7% (51,274) |
9:00 a.m. to 9:59 a.m. - Females:
| St. Paul: | 3.3% (3) |
| Oregon: | 8.6% (66,218) |
12:00 p.m. to 3:59 p.m. - Females:
| St. Paul: | 15.7% (14) |
| Oregon: | 7.9% (60,676) |
4:00 p.m. to 11:59 p.m. - Females:
| St. Paul: | 14.3% (13) |
| Oregon: | 6.0% (45,744) |
Travel time to work
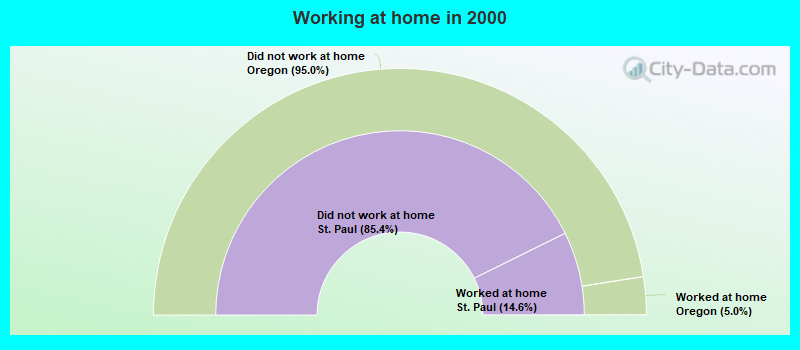
Percentage of workers working in this county: 61.8%
Number of people working at home: 17 (8.3% of all workers)
Number of people working at home: 17 (8.3% of all workers)
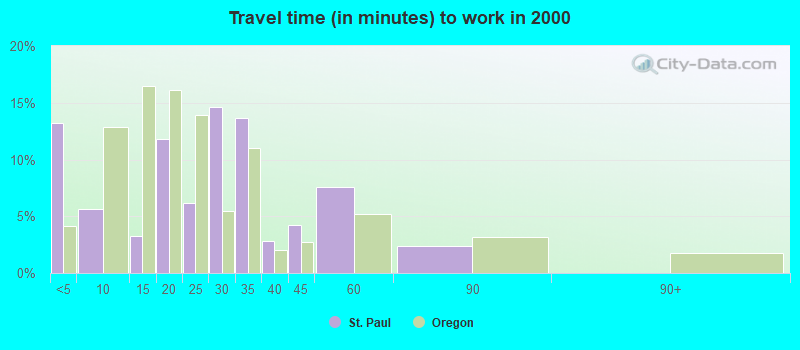
Less than 5 minutes:
| St. Paul: | 13.2% (28) |
| Oregon: | 4.1% (66,369) |
5 to 9 minutes:
| St. Paul: | 5.7% (12) |
| Oregon: | 12.9% (206,168) |
10 to 14 minutes:
| St. Paul: | 3.3% (7) |
| Oregon: | 16.5% (263,466) |
15 to 19 minutes:
| St. Paul: | 11.8% (25) |
| Oregon: | 16.1% (258,476) |
20 to 24 minutes:
| St. Paul: | 6.1% (13) |
| Oregon: | 13.9% (223,370) |
25 to 29 minutes:
| St. Paul: | 14.6% (31) |
| Oregon: | 5.4% (87,147) |
30 to 34 minutes:
| St. Paul: | 13.7% (29) |
| Oregon: | 11.0% (176,763) |
35 to 39 minutes:
| St. Paul: | 2.8% (6) |
| Oregon: | 2.0% (32,680) |
40 to 44 minutes:
| St. Paul: | 4.2% (9) |
| Oregon: | 2.7% (43,262) |
45 to 59 minutes:
| St. Paul: | 7.5% (16) |
| Oregon: | 5.2% (83,858) |
60 to 89 minutes:
| St. Paul: | 2.4% (5) |
| Oregon: | 3.2% (51,318) |
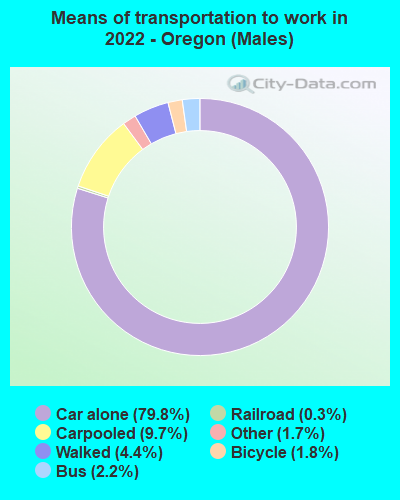
Means of transportation to work
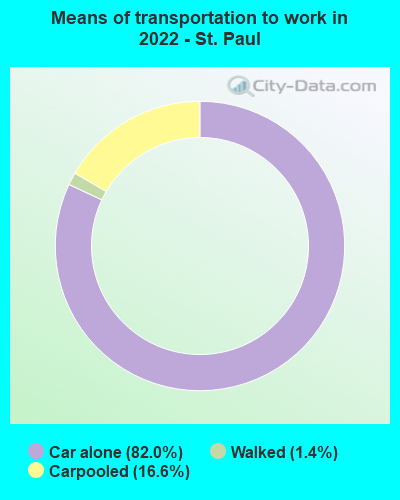
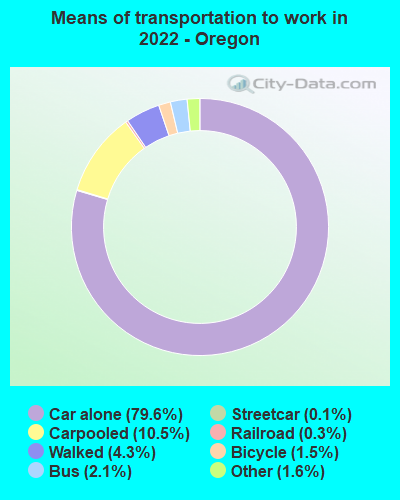
Drove car alone:
| St. Paul: | 82.0% (429) |
| Oregon: | 79.6% (619,058) |
Carpooled:
| St. Paul: | 16.6% (87) |
| Oregon: | 10.5% (88,500) |
Walked:
| St. Paul: | 1.4% (7) |
| Oregon: | 4.3% (33,279) |
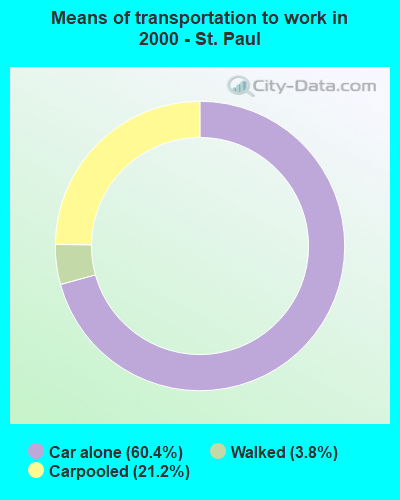

Drove car alone:
| St. Paul: | 60.4% (128) |
| Oregon: | 73.2% (1,171,641) |
Carpooled:
| St. Paul: | 21.2% (45) |
| Oregon: | 12.2% (195,950) |
Walked:
| St. Paul: | 3.8% (8) |
| Oregon: | 3.6% (57,217) |
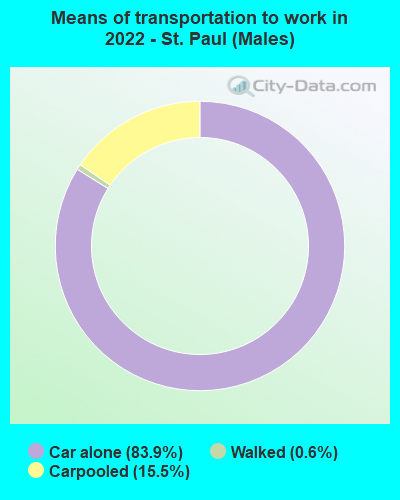
Drove car alone - Males:
| St. Paul: | 83.9% (303) |
| Oregon: | 79.8% (619,058) |
Carpooled - Males:
| St. Paul: | 15.5% (56) |
| Oregon: | 9.7% (88,500) |
Walked - Males:
| St. Paul: | 0.6% (2) |
| Oregon: | 4.4% (33,279) |
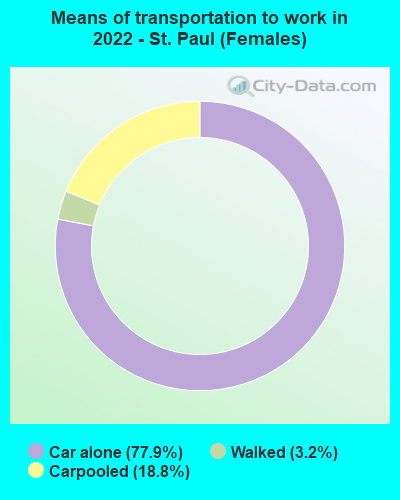
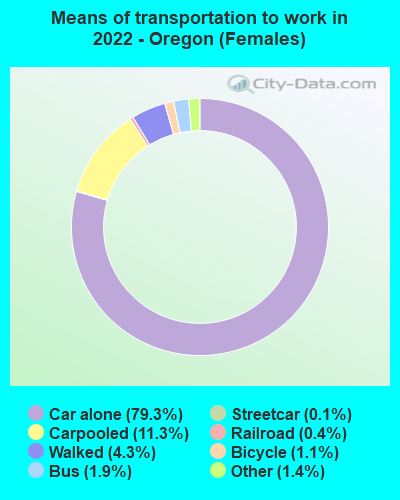
Drove car alone - Females:
| St. Paul: | 77.9% (126) |
| Oregon: | 79.3% (619,058) |
Carpooled - Females:
| St. Paul: | 18.8% (31) |
| Oregon: | 11.3% (88,500) |
Walked - Females:
| St. Paul: | 3.2% (5) |
| Oregon: | 4.3% (33,279) |
Private vehicle occupancy
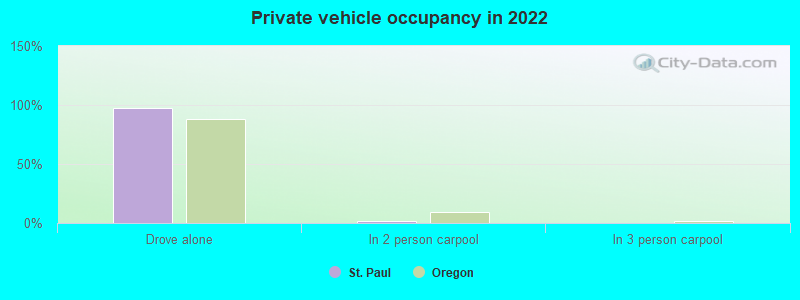
Drove alone:
| St. Paul: | 97.8% (181) |
| Oregon: | 88.2% (1,317,823) |
In 2 person carpool:
| St. Paul: | 2.1% (4) |
| Oregon: | 9.0% (134,621) |
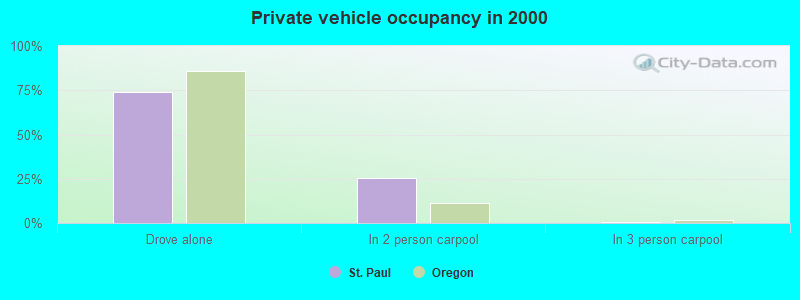
Drove alone:
| St. Paul: | 74.0% (128) |
| Oregon: | 85.7% (1,171,641) |
In 2 person carpool:
| St. Paul: | 25.4% (44) |
| Oregon: | 11.5% (156,754) |
In 3 person carpool:
| St. Paul: | 0.6% (1) |
| Oregon: | 1.9% (25,457) |
Class of workers
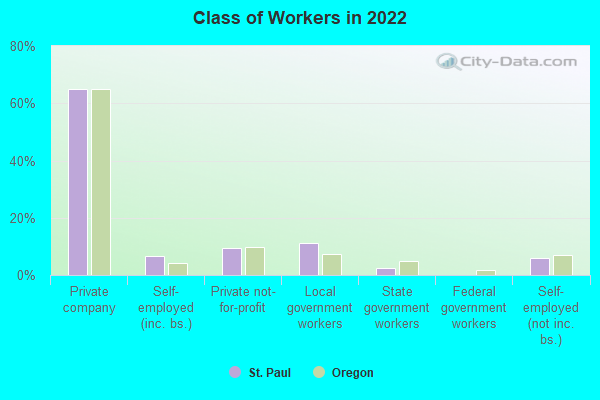
Employee of private company:
| St. Paul: | 64.8% (144) |
| Oregon: | 64.9% (1,360,643) |
Self-employed in own incorporated business:
| St. Paul: | 6.5% (14) |
| Oregon: | 4.4% (91,430) |
Private not-for-profit wage and salary workers:
| St. Paul: | 9.3% (21) |
| Oregon: | 9.6% (201,342) |
Local government workers:
| St. Paul: | 11.1% (25) |
| Oregon: | 7.2% (151,100) |
State government workers:
| St. Paul: | 2.3% (5) |
| Oregon: | 5.0% (103,943) |
Self-employed workers in own not incorporated business:
| St. Paul: | 6.0% (13) |
| Oregon: | 6.9% (145,422) |
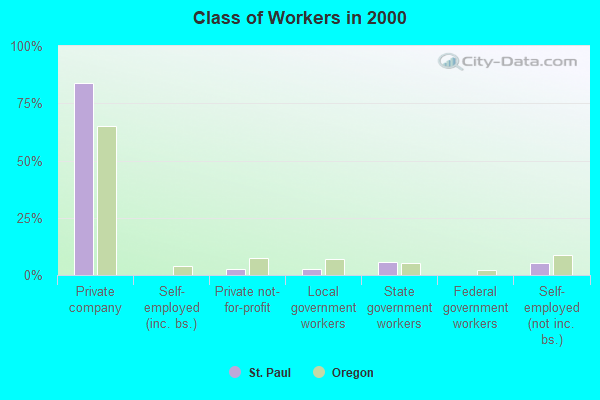
Employee of private company:
| St. Paul: | 83.6% (179) |
| Oregon: | 65.1% (1,059,139) |
Private not-for-profit wage and salary workers:
| St. Paul: | 2.8% (6) |
| Oregon: | 7.4% (120,839) |
Local government workers:
| St. Paul: | 2.8% (6) |
| Oregon: | 7.2% (116,733) |
State government workers:
| St. Paul: | 5.6% (12) |
| Oregon: | 5.0% (81,804) |
Self-employed workers in own not incorporated business:
| St. Paul: | 5.1% (11) |
| Oregon: | 8.9% (145,020) |
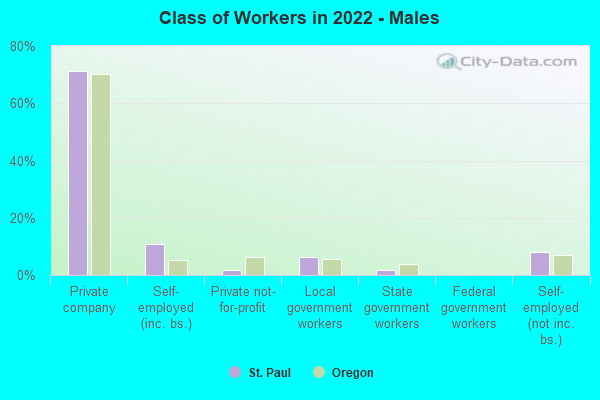
Employee of private company - Males:
| St. Paul: | 71.2% (81) |
| Oregon: | 70.1% (771,769) |
Self-employed in own incorporated business - Males:
| St. Paul: | 10.8% (12) |
| Oregon: | 5.2% (57,168) |
Private not-for-profit wage and salary workers - Males:
| St. Paul: | 1.8% (2) |
| Oregon: | 6.2% (68,159) |
Local government workers - Males:
| St. Paul: | 6.3% (7) |
| Oregon: | 5.5% (60,350) |
State government workers - Males:
| St. Paul: | 1.8% (2) |
| Oregon: | 3.9% (42,724) |
Self-employed workers in own not incorporated business - Males:
| St. Paul: | 8.1% (9) |
| Oregon: | 6.9% (76,355) |
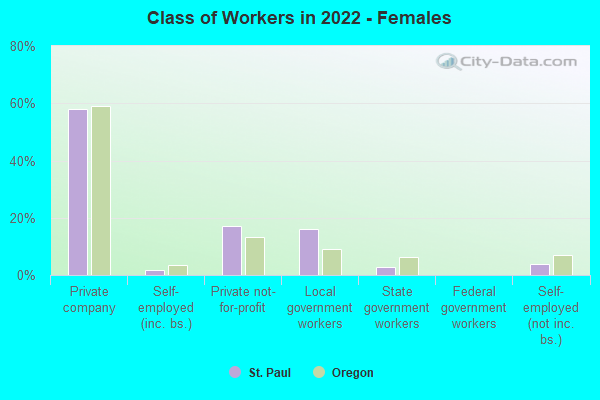
Employee of private company - Females:
| St. Paul: | 58.1% (63) |
| Oregon: | 59.2% (588,874) |
Self-employed in own incorporated business - Females:
| St. Paul: | 1.9% (2) |
| Oregon: | 3.4% (34,262) |
Private not-for-profit wage and salary workers - Females:
| St. Paul: | 17.1% (19) |
| Oregon: | 13.4% (133,183) |
Local government workers - Females:
| St. Paul: | 16.2% (18) |
| Oregon: | 9.1% (90,750) |
State government workers - Females:
| St. Paul: | 2.9% (3) |
| Oregon: | 6.2% (61,219) |
Self-employed workers in own not incorporated business - Females:
| St. Paul: | 3.8% (4) |
| Oregon: | 6.9% (69,067) |