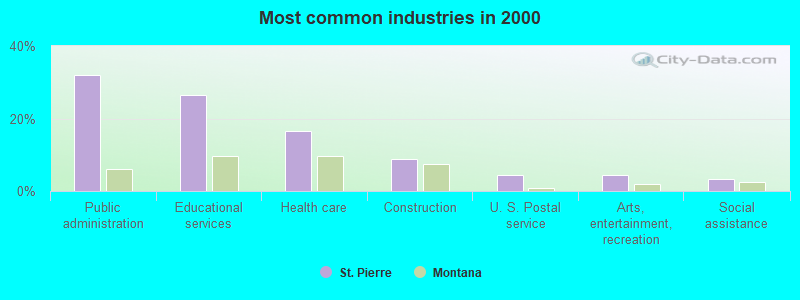
The most common industries in St. Pierre are: Public administration (31.9% of civilian employees), Educational services (26.4% of civilian employees), Health care (16.5% of civilian employees). 100.0% of workers work in Hill County and 10.0% of all workers work at home. 46.2% of workers are employees of private companies, which is 27.1% less than the rate of 58.8% across the entire state of Montana.
Whole page based on the data from 2000 / 2022 when the population of St. Pierre, Montana was 289 / 444
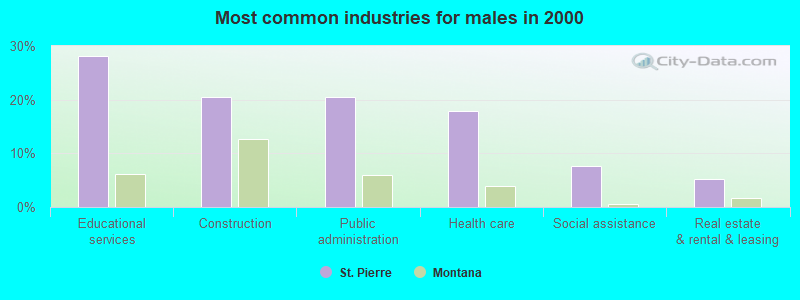
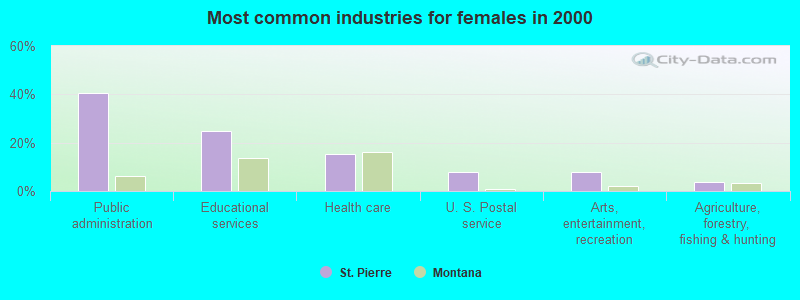
Most common industries
Most common industries
Industry
All
Males
Females
Public administration
31.9% (29)
20.5% (8)
40.4% (21)
Educational services
26.4% (24)
28.2% (11)
25.0% (13)
Health care
16.5% (15)
17.9% (7)
15.4% (8)
Construction
8.8% (8)
20.5% (8)
0.0% (0)
U. S. Postal service
4.4% (4)
0.0% (0)
7.7% (4)
Arts, entertainment, and recreation
4.4% (4)
0.0% (0)
7.7% (4)
Social assistance
3.3% (3)
7.7% (3)
0.0% (0)
Agriculture, forestry, fishing and hunting
2.2% (2)
0.0% (0)
3.8% (2)
Real estate and rental and leasing
2.2% (2)
5.1% (2)
0.0% (0)
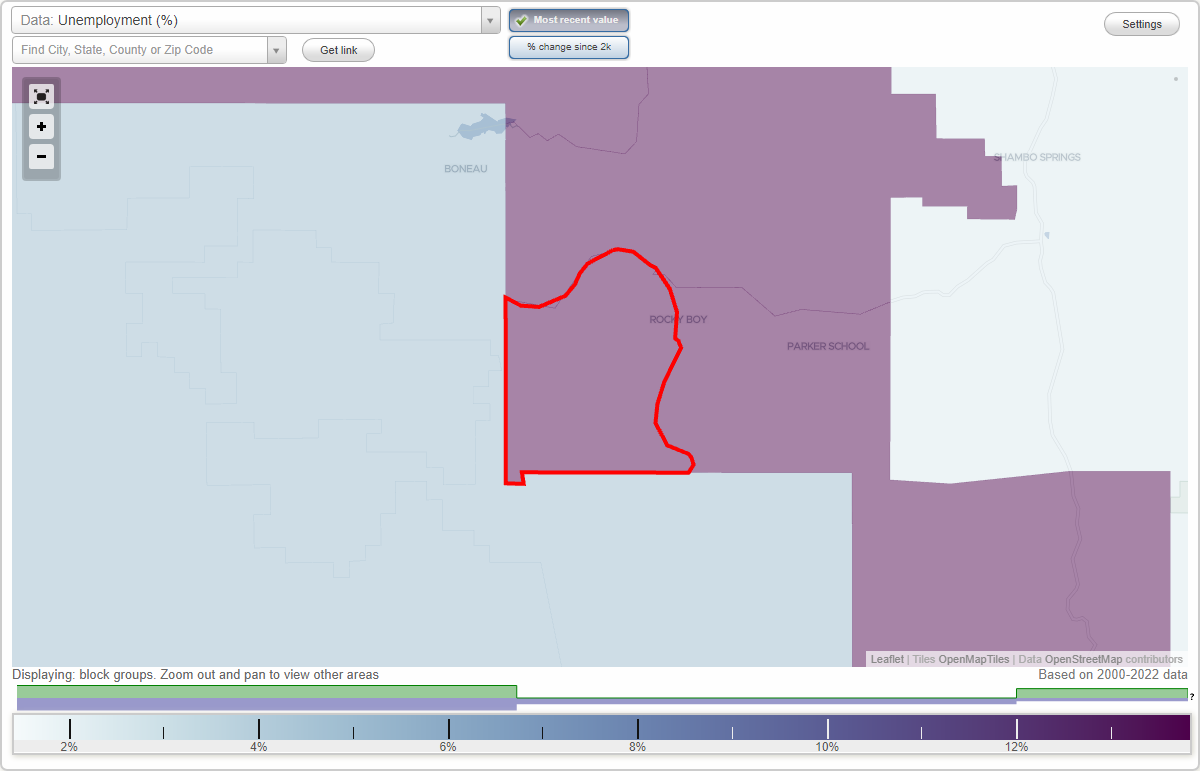
Unemployment in St. Pierre
Unemployment by race in 2022
Unemployment rate for American Indian and Alaska Native residents
10.9%Males
48.7%Females
Unemployment by race in 2000
Unemployment rate for American Indian and Alaska Native residents
31.6%Males
22.4%Females
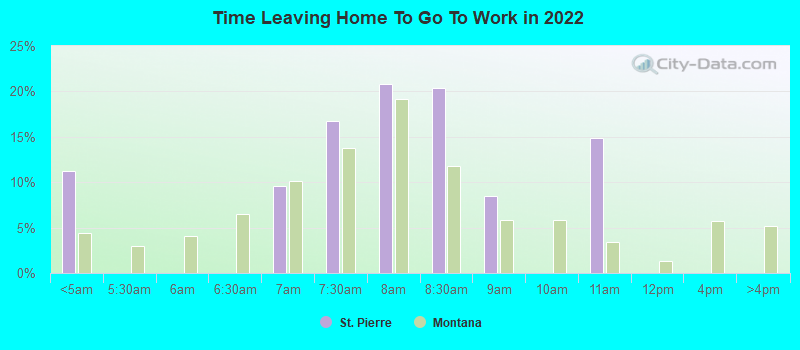
Time leaving home to go to work
12:00 a.m. to 4:59 a.m.:
St. Pierre:
11.3% (8)
Montana:
4.4% (21,273)
6:30 a.m. to 6:59 a.m.:
St. Pierre:
9.6% (7)
Montana:
10.1% (48,669)
7:00 a.m. to 7:29 a.m.:
St. Pierre:
16.8% (12)
Montana:
13.8% (66,446)
7:30 a.m. to 7:59 a.m.:
St. Pierre:
20.9% (15)
Montana:
19.2% (92,487)
8:00 a.m. to 8:29 a.m.:
St. Pierre:
20.4% (15)
Montana:
11.8% (56,678)
8:30 a.m. to 8:59 a.m.:
St. Pierre:
8.4% (6)
Montana:
5.8% (27,997)
10:00 a.m. to 10:59 a.m.:
St. Pierre:
14.8% (11)
Montana:
3.4% (16,558)
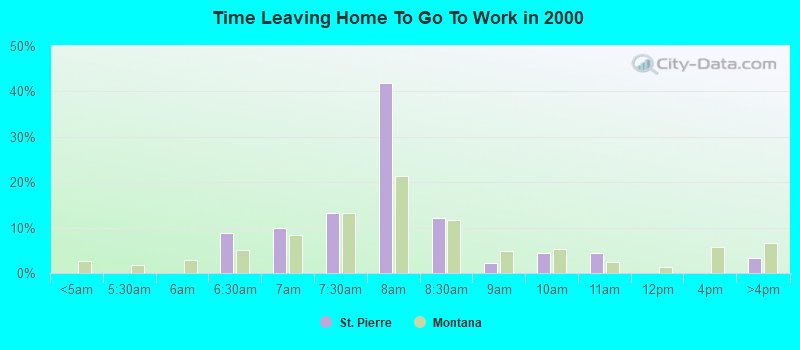
6:30am:
St. Pierre:
8.8% (8)
Montana:
5.1% (21,726)
7am:
St. Pierre:
9.9% (9)
Montana:
8.4% (35,518)
7:30am:
St. Pierre:
13.2% (12)
Montana:
13.3% (56,115)
8am:
St. Pierre:
41.8% (38)
Montana:
21.4% (90,201)
8:30am:
St. Pierre:
12.1% (11)
Montana:
11.7% (49,381)
9am:
St. Pierre:
2.2% (2)
Montana:
5.0% (20,912)
10am:
St. Pierre:
4.4% (4)
Montana:
5.3% (22,556)
11am:
St. Pierre:
4.4% (4)
Montana:
2.5% (10,541)
>4pm:
St. Pierre:
3.3% (3)
Montana:
6.6% (27,764)
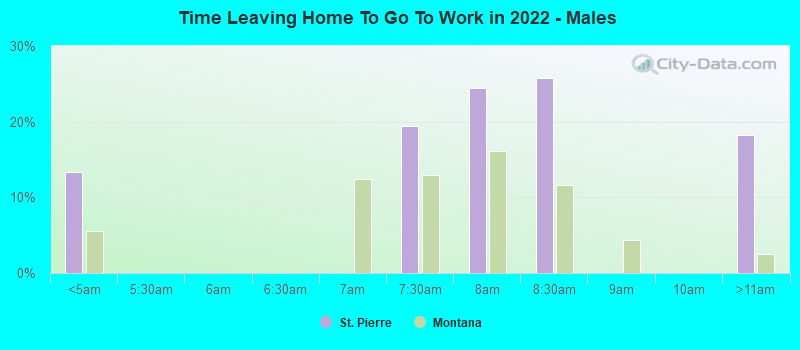
12:00 a.m. to 4:59 a.m. - Males:
St. Pierre:
13.3% (8)
Montana:
5.5% (14,253)
7:00 a.m. to 7:29 a.m. - Males:
St. Pierre:
19.4% (12)
Montana:
13.0% (33,550)
7:30 a.m. to 7:59 a.m. - Males:
St. Pierre:
24.4% (15)
Montana:
16.2% (41,784)
8:00 a.m. to 8:29 a.m. - Males:
St. Pierre:
25.8% (16)
Montana:
11.6% (30,021)
10:00 a.m. to 10:59 a.m. - Males:
St. Pierre:
18.2% (11)
Montana:
2.4% (6,318)
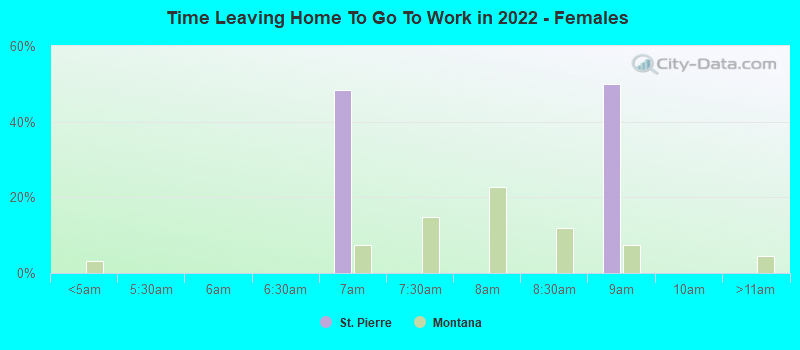
6:30 a.m. to 6:59 a.m. - Females:
St. Pierre:
48.2% (6)
Montana:
7.3% (16,421)
8:30 a.m. to 8:59 a.m. - Females:
St. Pierre:
49.8% (7)
Montana:
7.4% (16,653)
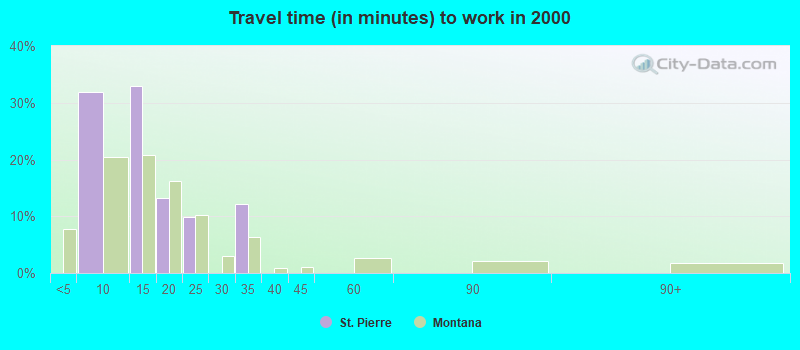
Travel time to work
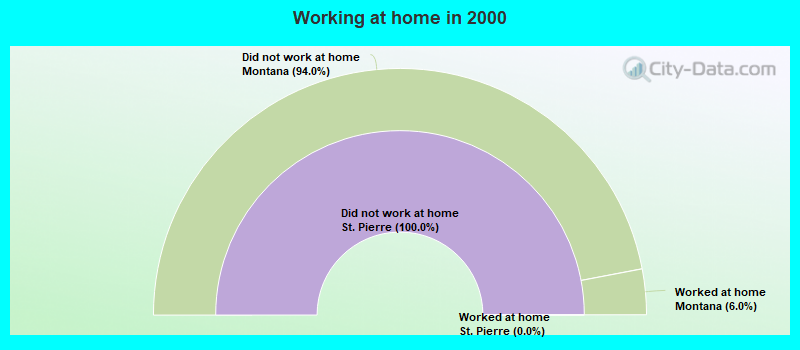
Percentage of workers working in this county: 100.0% Number of people working at home: 8 (10.0% of all workers)
5 to 9 minutes:
St. Pierre:
31.9% (29)
Montana:
20.5% (86,585)
10 to 14 minutes:
St. Pierre:
33.0% (30)
Montana:
20.8% (87,855)
15 to 19 minutes:
St. Pierre:
13.2% (12)
Montana:
16.3% (68,642)
20 to 24 minutes:
St. Pierre:
9.9% (9)
Montana:
10.3% (43,356)
30 to 34 minutes:
St. Pierre:
12.1% (11)
Montana:
6.4% (27,044)
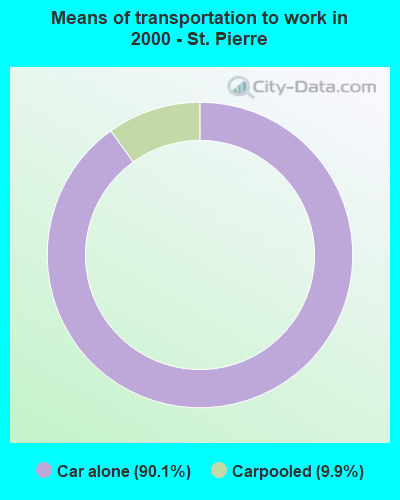
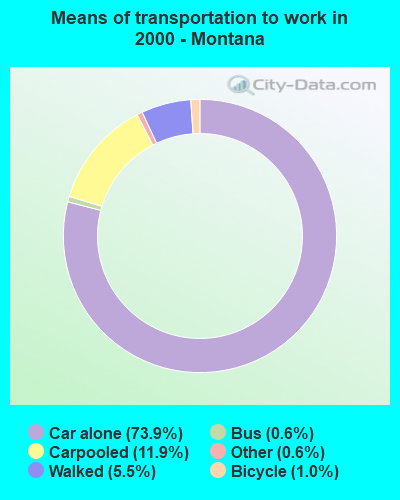
Means of transportation to work
Drove car alone:
St. Pierre:
90.1% (82)
Montana:
73.9% (311,872)
Carpooled:
St. Pierre:
9.9% (9)
Montana:
11.9% (50,192)
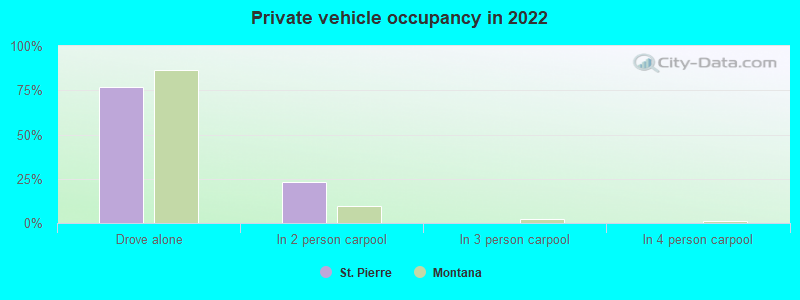
Private vehicle occupancy
Drove alone:
St. Pierre:
76.9% (57)
Montana:
86.4% (382,804)
In 2 person carpool:
St. Pierre:
23.1% (17)
Montana:
9.4% (41,471)
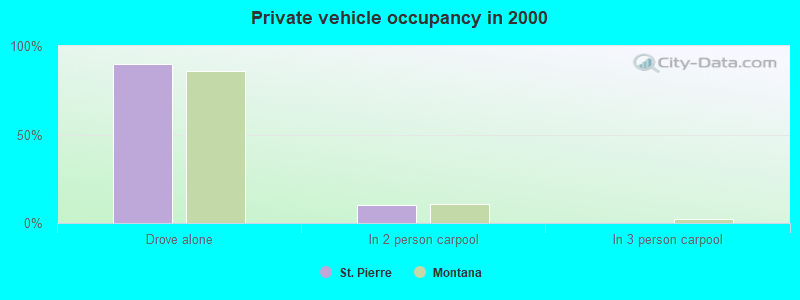
Drove alone:
St. Pierre:
90.1% (82)
Montana:
86.1% (311,872)
In 2 person carpool:
St. Pierre:
9.9% (9)
Montana:
10.7% (38,849)
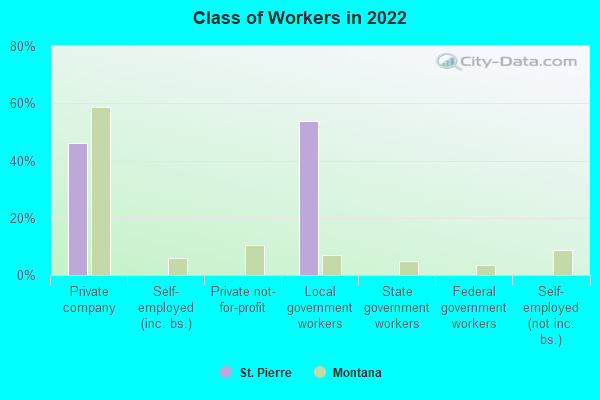
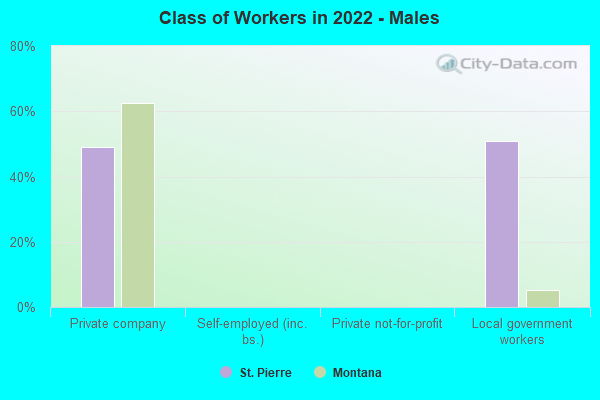
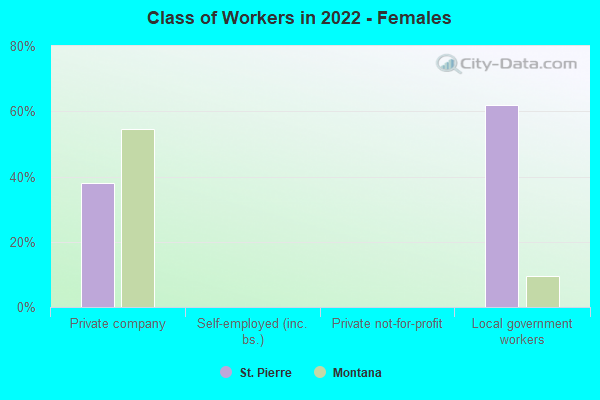
Class of workers
Employee of private company:
St. Pierre:
46.2% (39)
Montana:
58.8% (328,992)
Local government workers:
St. Pierre:
53.8% (45)
Montana:
7.1% (39,717)
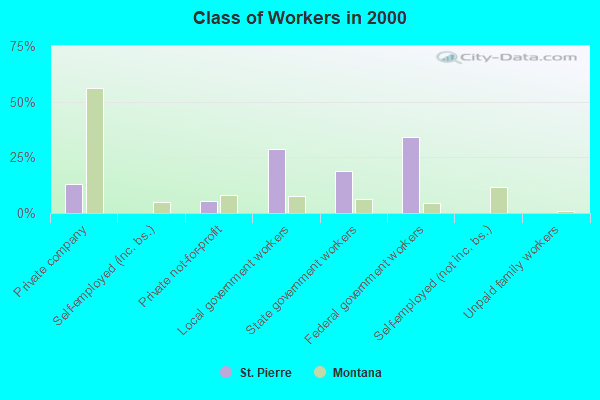
Employee of private company:
St. Pierre:
13.2% (12)
Montana:
56.0% (238,678)
Private not-for-profit wage and salary workers:
St. Pierre:
5.5% (5)
Montana:
8.2% (35,132)
Local government workers:
St. Pierre:
28.6% (26)
Montana:
7.8% (33,240)
State government workers:
St. Pierre:
18.7% (17)
Montana:
6.2% (26,416)
Federal government workers:
St. Pierre:
34.1% (31)
Montana:
4.3% (18,467)
Employee of private company - Males:
St. Pierre:
49.2% (30)
Montana:
62.5% (184,653)
Local government workers - Males:
St. Pierre:
50.8% (31)
Montana:
5.1% (15,006)
Employee of private company - Females:
St. Pierre:
38.1% (8)
Montana:
54.7% (144,339)
Local government workers - Females:
St. Pierre:
61.9% (14)
Montana:
9.4% (24,711)
Discuss St. Pierre, Montana (MT) on our hugely popular Montana forum.