Work and Jobs in Straughn, Indiana (IN) Detailed Stats
Data:
Unemployment (%)
Unemployment (% change since 2000)
Unemployment (%) - White
Unemployment (% change since 2000) - White
Unemployment (%) - Black or African American
Unemployment (% change since 2000) - Black or African American
Unemployment (%) - Asian
Unemployment (% change since 2000) - Asian
Unemployment (%) - Hispanic or Latino
Unemployment (% change since 2000) - Hispanic or Latino
Unemployment (%) - American Indian and Alaska Native
Unemployment (% change since 2000) - American Indian and Alaska Native
Unemployment (%) - Multirace
Unemployment (% change since 2000) - Multirace
Unemployment (%) - Other Race
Unemployment (% change since 2000) - Other Race
Industry diversity
Most Common Industries - Agriculture, forestry, fishing and hunting, and mining (%)
Most Common Industries - Agriculture, forestry, fishing and hunting (%)
Most Common Industries - Mining, quarrying, and oil and gas extraction (%)
Most Common Industries - Construction (%)
Most Common Industries - Manufacturing (%)
Most Common Industries - Wholesale trade (%)
Most Common Industries - Retail trade (%)
Most Common Industries - Transportation and warehousing, and utilities (%)
Most Common Industries - Transportation and warehousing (%)
Most Common Industries - Utilities (%)
Most Common Industries - Information (%)
Most Common Industries - Finance and insurance, and real estate and rental and leasing (%)
Most Common Industries - Finance and insurance (%)
Most Common Industries - Real estate and rental and leasing (%)
Most Common Industries - Professional, scientific, and management, and administrative and waste management services (%)
Most Common Industries - Professional, scientific, and technical services (%)
Most Common Industries - Management of companies and enterprises (%)
Most Common Industries - Administrative and support and waste management services (%)
Most Common Industries - Educational services, and health care and social assistance (%)
Most Common Industries - Educational services (%)
Most Common Industries - Health care and social assistance (%)
Most Common Industries - Arts, entertainment, and recreation, and accommodation and food services (%)
Most Common Industries - Arts, entertainment, and recreation (%)
Most Common Industries - Accommodation and food services (%)
Most Common Industries - Other services, except public administration (%)
Most Common Industries - Public administration (%)
Occupation diversity
Most Common Occupations - Management, business, science, and arts occupations (%)
Most Common Occupations - Management, business, and financial occupations (%)
Most Common Occupations - Management occupations (%)
Most Common Occupations - Business and financial operations occupations (%)
Most Common Occupations - Computer, engineering, and science occupations (%)
Most Common Occupations - Computer and mathematical occupations (%)
Most Common Occupations - Architecture and engineering occupations (%)
Most Common Occupations - Life, physical, and social science occupations (%)
Most Common Occupations - Education, legal, community service, arts, and media occupations (%)
Most Common Occupations - Community and social service occupations (%)
Most Common Occupations - Legal occupations (%)
Most Common Occupations - Education, training, and library occupations (%)
Most Common Occupations - Arts, design, entertainment, sports, and media occupations (%)
Most Common Occupations - Healthcare practitioners and technical occupations (%)
Most Common Occupations - Health diagnosing and treating practitioners and other technical occupations (%)
Most Common Occupations - Health technologists and technicians (%)
Most Common Occupations - Service occupations (%)
Most Common Occupations - Healthcare support occupations (%)
Most Common Occupations - Protective service occupations (%)
Most Common Occupations - Fire fighting and prevention, and other protective service workers including supervisors (%)
Most Common Occupations - Law enforcement workers including supervisors (%)
Most Common Occupations - Food preparation and serving related occupations (%)
Most Common Occupations - Building and grounds cleaning and maintenance occupations (%)
Most Common Occupations - Personal care and service occupations (%)
Most Common Occupations - Sales and office occupations (%)
Most Common Occupations - Sales and related occupations (%)
Most Common Occupations - Office and administrative support occupations (%)
Most Common Occupations - Natural resources, construction, and maintenance occupations (%)
Most Common Occupations - Farming, fishing, and forestry occupations (%)
Most Common Occupations - Construction and extraction occupations (%)
Most Common Occupations - Installation, maintenance, and repair occupations (%)
Most Common Occupations - Production, transportation, and material moving occupations (%)
Most Common Occupations - Production occupations (%)
Most Common Occupations - Transportation occupations (%)
Most Common Occupations - Material moving occupations (%)
Private vehicle occupancy - Drove alone (% change since 2000)
Private vehicle occupancy - Carpooled (%)
Private vehicle occupancy - Carpooled (% change since 2000)
Private vehicle occupancy - In 2-person carpool (%)
Private vehicle occupancy - In 2-person carpool (% change since 2000)
Private vehicle occupancy - In 3-person carpool (%)
Private vehicle occupancy - In 3-person carpool (% change since 2000)
Private vehicle occupancy - In 4-person carpool (%)
Private vehicle occupancy - In 4-person carpool (% change since 2000)
Private vehicle occupancy - In 5- or 6-person carpool (%)
Private vehicle occupancy - In 5- or 6-person carpool (% change since 2000)
Private vehicle occupancy - In 7-or-more-person carpool (%)
Private vehicle occupancy - In 7-or-more-person carpool (% change since 2000)
Time Leaving Home To Go To Work - 12:00 a.m. to 4:59 a.m. (%)
Time Leaving Home To Go To Work - 12:00 a.m. to 4:59 a.m. (% change since 2000)
Time Leaving Home To Go To Work - 5:00 a.m. to 5:59 a.m. (%)
Time Leaving Home To Go To Work - 5:00 a.m. to 5:59 a.m. (% change since 2000)
Time Leaving Home To Go To Work - 6:00 a.m. to 6:59 a.m. (%)
Time Leaving Home To Go To Work - 6:00 a.m. to 6:59 a.m. (% change since 2000)
Time Leaving Home To Go To Work - 7:00 a.m. to 7:59 a.m. (%)
Time Leaving Home To Go To Work - 7:00 a.m. to 7:59 a.m. (% change since 2000)
Time Leaving Home To Go To Work - 8:00 a.m. to 8:59 a.m. (%)
Time Leaving Home To Go To Work - 8:00 a.m. to 8:59 a.m. (% change since 2000)
Time Leaving Home To Go To Work - 9:00 a.m. to 9:59 a.m. (%)
Time Leaving Home To Go To Work - 9:00 a.m. to 9:59 a.m. (% change since 2000)
Time Leaving Home To Go To Work - 10:00 a.m. to 10:59 a.m. (%)
Time Leaving Home To Go To Work - 10:00 a.m. to 10:59 a.m. (% change since 2000)
Time Leaving Home To Go To Work - 11:00 a.m. to 11:59 a.m. (%)
Time Leaving Home To Go To Work - 11:00 a.m. to 11:59 a.m. (% change since 2000)
Time Leaving Home To Go To Work - 12:00 p.m. to 3:59 p.m. (%)
Time Leaving Home To Go To Work - 12:00 p.m. to 3:59 p.m. (% change since 2000)
Time Leaving Home To Go To Work - 4:00 p.m. to 11:59 p.m. (%)
Time Leaving Home To Go To Work - 4:00 p.m. to 11:59 p.m. (% change since 2000)
Class of Workers - Employee of private company (%)
Class of Workers - Employee of private company (% change since 2000)
Class of Workers - Self-employed in own incorporated business (%)
Class of Workers - Self-employed in own incorporated business (% change since 2000)
Class of Workers - Private not-for-profit wage and salary workers (%)
Class of Workers - Private not-for-profit wage and salary workers (% change since 2000)
Class of Workers - Local government workers (%)
Class of Workers - Local government workers (% change since 2000)
Class of Workers - State government workers (%)
Class of Workers - State government workers (% change since 2000)
Class of Workers - Federal government workers (%)
Class of Workers - Federal government workers (% change since 2000)
Class of Workers - Self-employed workers in own not incorporated business and Unpaid family workers (%)
Class of Workers - Self-employed workers in own not incorporated business and Unpaid family workers (% change since 2000)
Means of transportation to work - Drove car alone (%)
Means of transportation to work - Drove car alone (% change since 2000)
Means of transportation to work - Carpooled (%)
Means of transportation to work - Carpooled (% change since 2000)
Means of transportation to work - Public transportation (%)
Means of transportation to work - Public transportation (% change since 2000)
Means of transportation to work - Bus or trolley bus (%)
Means of transportation to work - Bus or trolley bus (% change since 2000)
Means of transportation to work - Streetcar or trolley car (%)
Means of transportation to work - Streetcar or trolley car (% change since 2000)
Means of transportation to work - Subway or elevated (%)
Means of transportation to work - Subway or elevated (% change since 2000)
Means of transportation to work - Railroad (%)
Means of transportation to work - Railroad (% change since 2000)
Means of transportation to work - Ferryboat (%)
Means of transportation to work - Ferryboat (% change since 2000)
Means of transportation to work - Taxicab (%)
Means of transportation to work - Taxicab (% change since 2000)
Means of transportation to work - Motorcycle (%)
Means of transportation to work - Motorcycle (% change since 2000)
Means of transportation to work - Bicycle (%)
Means of transportation to work - Bicycle (% change since 2000)
Means of transportation to work - Walked (%)
Means of transportation to work - Walked (% change since 2000)
Means of transportation to work - Other means (%)
Means of transportation to work - Other means (% change since 2000)
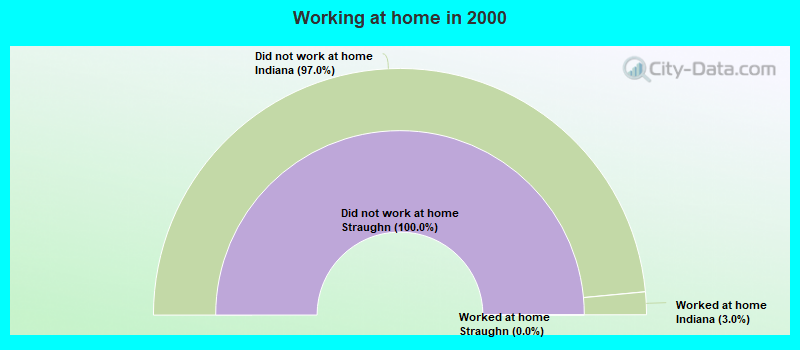
Working at home (%)
Working at home (% change since 2000)
Travel time to work - Less than 5 minutes (%)
Travel time to work - Less than 5 minutes (% change since 2000)
Travel time to work - 5 to 9 minutes (%)
Travel time to work - 5 to 9 minutes (% change since 2000)
Travel time to work - 10 to 19 minutes (%)
Travel time to work - 10 to 19 minutes (% change since 2000)
Travel time to work - 20 to 29 minutes (%)
Travel time to work - 20 to 29 minutes (% change since 2000)
Travel time to work - 30 to 39 minutes (%)
Travel time to work - 30 to 39 minutes (% change since 2000)
Travel time to work - 40 to 59 minutes (%)
Travel time to work - 40 to 59 minutes (% change since 2000)
Travel time to work - 60 to 89 minutes (%)
Travel time to work - 60 to 89 minutes (% change since 2000)
Travel time to work - 90 or more minutes (%)
Travel time to work - 90 or more minutes (% change since 2000)
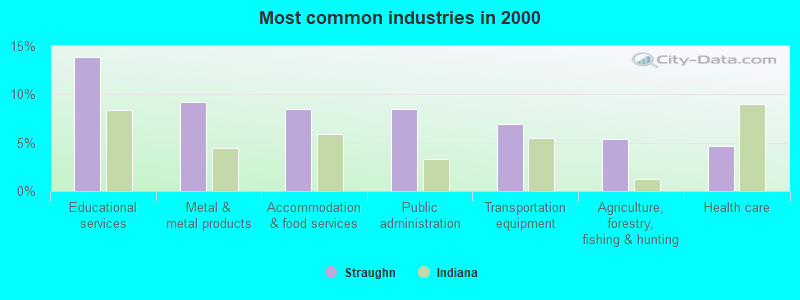
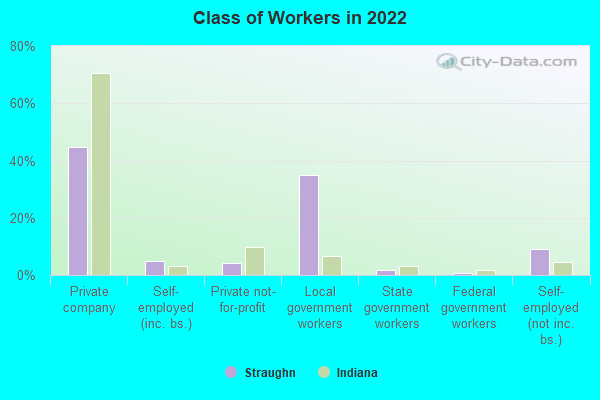
The most common industries in Straughn are: Educational services (13.8% of civilian employees), Metal & metal products (9.2% of civilian employees), Accommodation & food services (8.5% of civilian employees). 77.2% of workers work in Henry County and 12.2% of all workers work at home. 44.7% of workers are employees of private companies, which is 57.4% less than the rate of 70.4% across the entire state of Indiana.
Whole page based on the data from 2000 / 2022 when the population of Straughn, Indiana was 263 / 216
Most common industries
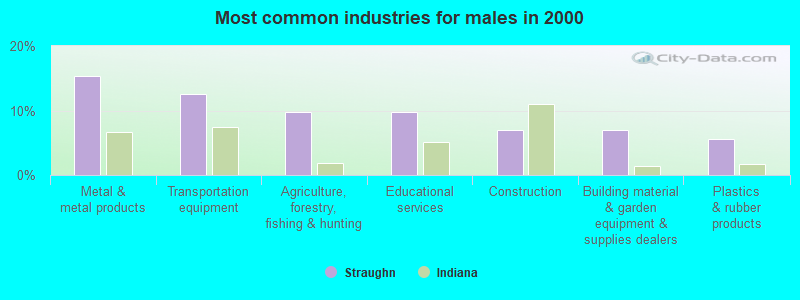
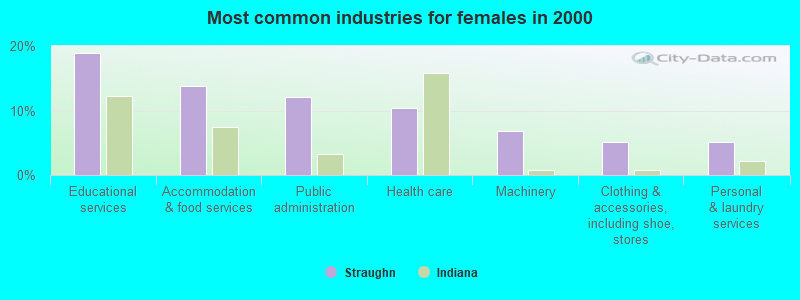
Most common industries Industry All Males Females
Educational services 13.8% 9.7% 19.0% Metal and metal products 9.2% 15.3% 1.7% Accommodation and food services 8.5% 4.2% 13.8% Public administration 8.5% 5.6% 12.1% Transportation equipment 6.9% 12.5% 0.0% Agriculture, forestry, fishing and hunting 5.4% 9.7% 0.0% Health care 4.6% 0.0% 10.3% Construction 3.8% 6.9% 0.0% Miscellaneous nondurable goods merchant wholesalers 3.8% 4.2% 3.4% Building material and garden equipment and supplies dealers 3.8% 6.9% 0.0% Farm supplies merchant wholesalers 3.1% 2.8% 3.4% Plastics and rubber products 3.1% 5.6% 0.0% Machinery 3.1% 0.0% 6.9% Miscellaneous manufacturing 2.3% 4.2% 0.0% Clothing and accessories, including shoe, stores 2.3% 0.0% 5.2% Chemicals 2.3% 4.2% 0.0% Personal and laundry services 2.3% 0.0% 5.2% Real estate and rental and leasing 1.5% 2.8% 0.0% Department and other general merchandise stores 1.5% 0.0% 3.4% Professional, scientific, and technical services 1.5% 0.0% 3.4% Social assistance 1.5% 0.0% 3.4% Religious, grantmaking, civic, professional, and similar organizations 1.5% 0.0% 3.4% Truck transportation 1.5% 2.8% 0.0% Used merchandise, gift, novelty, and souvenir, and other miscellaneous stores 1.5% 2.8% 0.0% Utilities 1.5% 0.0% 3.4% Gasoline stations 0.8% 0.0% 1.7%
Unemployment in Straughn Unemployment by race in 2022
Unemployment rate for White non-Hispanic residents 6.6% FemalesUnemployment by race in 2000
Unemployment rate for White non-Hispanic residents 1.4% Males
Time leaving home to go to work 12:00 a.m. to 4:59 a.m.: Straughn:
2.8% (3)Indiana:
6.7% (197,318)
5:00 a.m. to 5:29 a.m.: Straughn:
6.5% (7)Indiana:
4.3% (127,615)
5:30 a.m. to 5:59 a.m.: Straughn:
3.8% (4)Indiana:
5.8% (169,418)
6:00 a.m. to 6:29 a.m.: Straughn:
14.7% (16)Indiana:
8.6% (252,586)
6:30 a.m. to 6:59 a.m.: Straughn:
6.4% (7)Indiana:
9.9% (291,856)
7:00 a.m. to 7:29 a.m.: Straughn:
16.3% (17)Indiana:
13.7% (404,491)
7:30 a.m. to 7:59 a.m.: Straughn:
8.4% (9)Indiana:
12.5% (366,781)
8:30 a.m. to 8:59 a.m.: Straughn:
1.0% (1)Indiana:
4.5% (131,586)
9:00 a.m. to 9:59 a.m.: Straughn:
10.4% (11)Indiana:
5.1% (150,938)
12:00 p.m. to 3:59 p.m.: Straughn:
24.1% (26)Indiana:
7.6% (222,385)
4:00 p.m. to 11:59 p.m.: Straughn:
4.6% (5)Indiana:
8.2% (241,194)
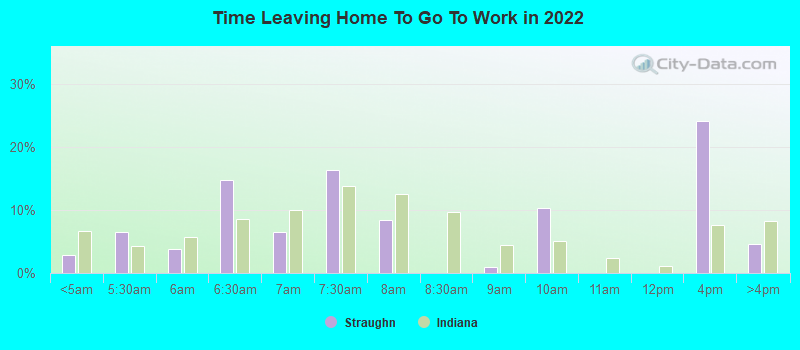
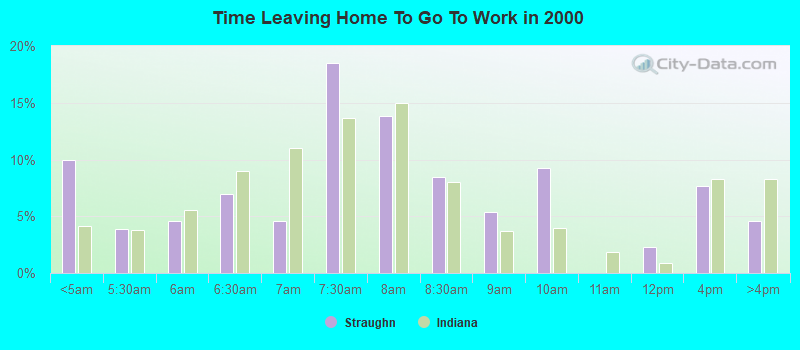
<5am: Straughn:
10.0% (13)Indiana:
4.1% (120,308)
5:30am: Straughn:
3.8% (5)Indiana:
3.8% (109,235)
6am: Straughn:
4.6% (6)Indiana:
5.5% (161,364)
6:30am: Straughn:
6.9% (9)Indiana:
9.0% (261,282)
7am: Straughn:
4.6% (6)Indiana:
11.0% (321,138)
7:30am: Straughn:
18.5% (24)Indiana:
13.7% (398,761)
8am: Straughn:
13.8% (18)Indiana:
15.0% (435,403)
8:30am: Straughn:
8.5% (11)Indiana:
8.0% (232,497)
9am: Straughn:
5.4% (7)Indiana:
3.7% (108,019)
10am: Straughn:
9.2% (12)Indiana:
4.0% (116,293)
12pm: Straughn:
2.3% (3)Indiana:
0.9% (26,782)
4pm: Straughn:
7.7% (10)Indiana:
8.3% (241,886)
>4pm: Straughn:
4.6% (6)Indiana:
8.3% (240,423)
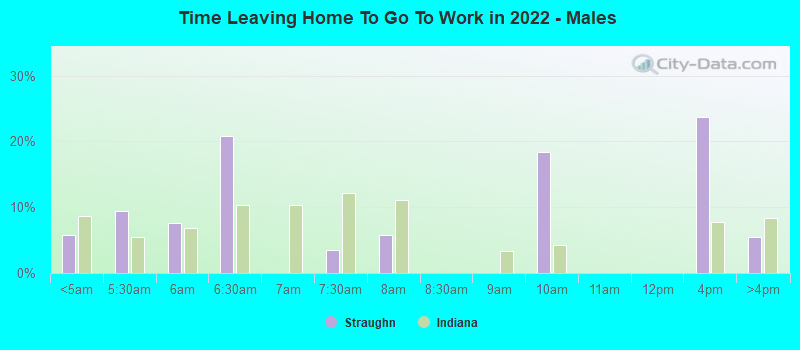
12:00 a.m. to 4:59 a.m. - Males: Straughn:
5.8% (3)Indiana:
8.7% (138,377)
5:00 a.m. to 5:29 a.m. - Males: Straughn:
9.4% (5)Indiana:
5.5% (87,613)
5:30 a.m. to 5:59 a.m. - Males: Straughn:
7.6% (4)Indiana:
6.8% (107,671)
6:00 a.m. to 6:29 a.m. - Males: Straughn:
20.8% (11)Indiana:
10.3% (164,136)
7:00 a.m. to 7:29 a.m. - Males: Straughn:
3.4% (2)Indiana:
12.1% (192,749)
7:30 a.m. to 7:59 a.m. - Males: Straughn:
5.8% (3)Indiana:
11.1% (175,670)
9:00 a.m. to 9:59 a.m. - Males: Straughn:
18.3% (10)Indiana:
4.2% (67,032)
12:00 p.m. to 3:59 p.m. - Males: Straughn:
23.7% (13)Indiana:
7.8% (123,573)
4:00 p.m. to 11:59 p.m. - Males: Straughn:
5.5% (3)Indiana:
8.4% (133,245)
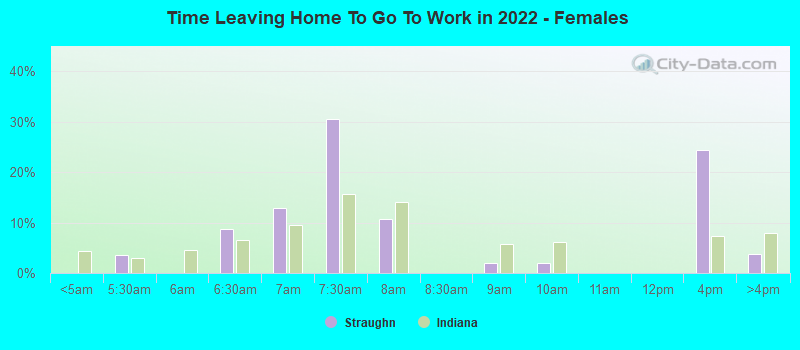
5:00 a.m. to 5:29 a.m. - Females: Straughn:
3.6% (2)Indiana:
2.9% (40,002)
6:00 a.m. to 6:29 a.m. - Females: Straughn:
8.7% (5)Indiana:
6.5% (88,450)
6:30 a.m. to 6:59 a.m. - Females: Straughn:
12.8% (7)Indiana:
9.5% (129,075)
7:00 a.m. to 7:29 a.m. - Females: Straughn:
30.5% (16)Indiana:
15.6% (211,742)
7:30 a.m. to 7:59 a.m. - Females: Straughn:
10.8% (6)Indiana:
14.1% (191,111)
8:30 a.m. to 8:59 a.m. - Females: Straughn:
2.0% (1)Indiana:
5.7% (77,947)
9:00 a.m. to 9:59 a.m. - Females: Straughn:
1.9% (1)Indiana:
6.2% (83,906)
12:00 p.m. to 3:59 p.m. - Females: Straughn:
24.5% (13)Indiana:
7.3% (98,812)
4:00 p.m. to 11:59 p.m. - Females: Straughn:
3.8% (2)Indiana:
8.0% (107,949)
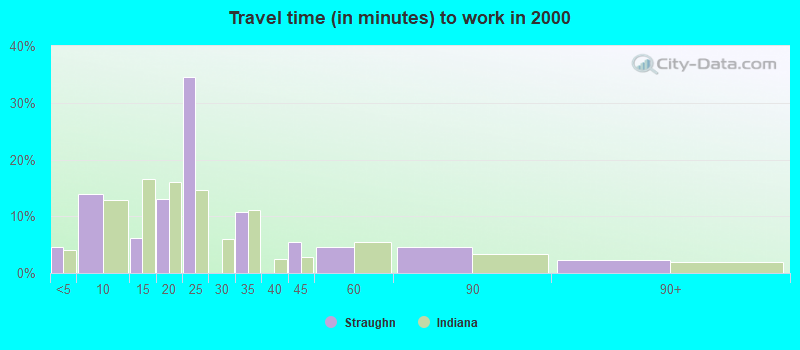
Travel time to work Percentage of workers working in this county: 77.2%Number of people working at home: 15 (12.2% of all workers )
Less than 5 minutes: Straughn:
4.6% (6)Indiana:
4.0% (117,198)
5 to 9 minutes: Straughn:
13.8% (18)Indiana:
12.8% (371,942)
10 to 14 minutes: Straughn:
6.2% (8)Indiana:
16.5% (480,825)
15 to 19 minutes: Straughn:
13.1% (17)Indiana:
16.1% (468,193)
20 to 24 minutes: Straughn:
34.6% (45)Indiana:
14.7% (427,185)
30 to 34 minutes: Straughn:
10.8% (14)Indiana:
11.1% (324,328)
40 to 44 minutes: Straughn:
5.4% (7)Indiana:
2.7% (79,764)
45 to 59 minutes: Straughn:
4.6% (6)Indiana:
5.4% (158,340)
60 to 89 minutes: Straughn:
4.6% (6)Indiana:
3.3% (96,185)
90 or more minutes: Straughn:
2.3% (3)Indiana:
2.0% (57,507)
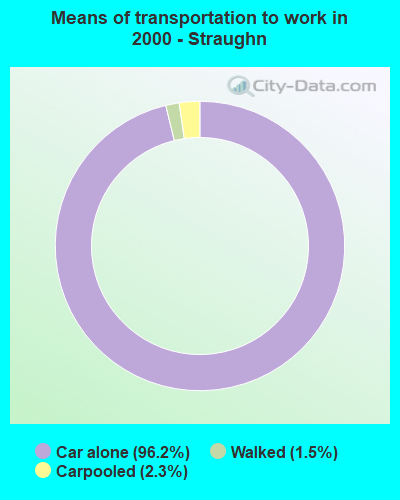
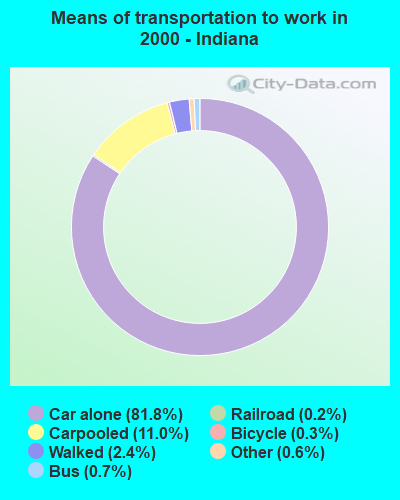
Means of transportation to work Drove car alone: Straughn:
96.2% (125)Indiana:
81.8% (2,379,989)
Carpooled: Straughn:
2.3% (3)Indiana:
11.0% (320,910)
Walked: Straughn:
1.5% (2)Indiana:
2.4% (69,184)
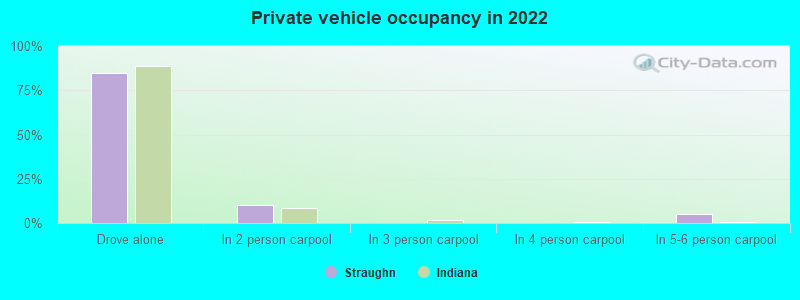
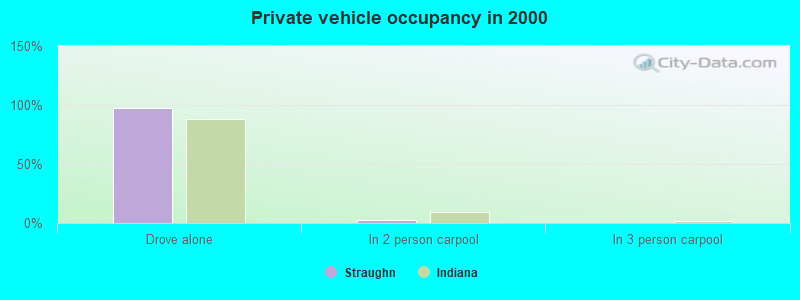
Private vehicle occupancy Drove alone: Straughn:
84.7% (88)Indiana:
88.7% (2,490,798)
In 2 person carpool: Straughn:
10.1% (11)Indiana:
8.4% (235,949)
In 5-6 person carpool: Straughn:
5.2% (5)Indiana:
0.3% (9,650)
Drove alone: Straughn:
97.7% (125)Indiana:
88.1% (2,379,989)
In 2 person carpool: Straughn:
2.3% (3)Indiana:
9.6% (259,143)
Class of workers
Employee of private company: Straughn:
44.7% (56)Indiana:
70.4% (2,362,321)
Self-employed in own incorporated business: Straughn:
4.9% (6)Indiana:
3.2% (106,653)
Private not-for-profit wage and salary workers: Straughn:
4.1% (5)Indiana:
9.9% (332,080)
Local government workers: Straughn:
35.0% (44)Indiana:
6.6% (222,901)
State government workers: Straughn:
1.6% (2)Indiana:
3.3% (109,298)
Federal government workers: Straughn:
0.8% (1)Indiana:
1.9% (62,110)
Self-employed workers in own not incorporated business: Straughn:
8.9% (11)Indiana:
4.6% (154,959)
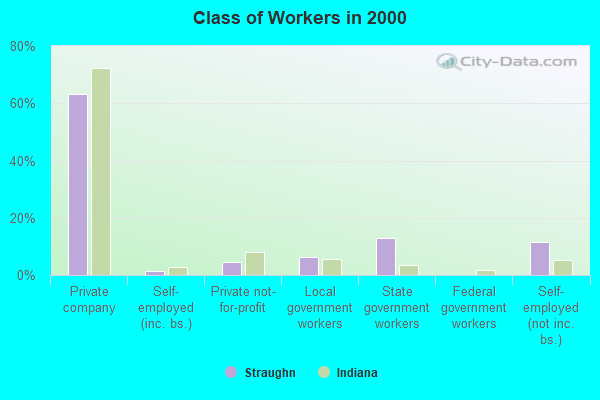
Employee of private company: Straughn:
63.1% (82)Indiana:
72.4% (2,147,867)
Self-employed in own incorporated business: Straughn:
1.5% (2)Indiana:
2.8% (83,352)
Private not-for-profit wage and salary workers: Straughn:
4.6% (6)Indiana:
8.2% (242,396)
Local government workers: Straughn:
6.2% (8)Indiana:
5.5% (164,030)
State government workers: Straughn:
13.1% (17)Indiana:
3.6% (107,895)
Self-employed workers in own not incorporated business: Straughn:
11.5% (15)Indiana:
5.4% (159,849)
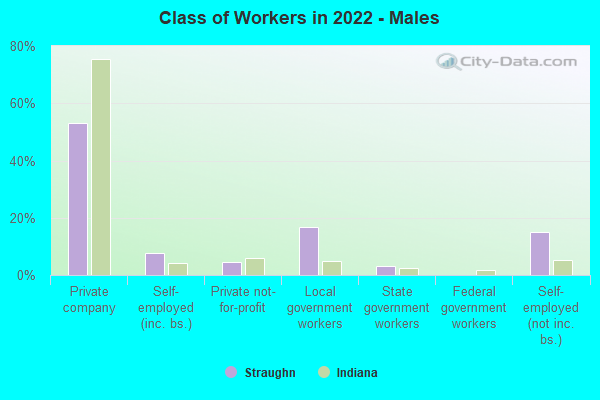
Employee of private company - Males: Straughn:
53.0% (36)Indiana:
75.5% (1,341,967)
Self-employed in own incorporated business - Males: Straughn:
7.6% (5)Indiana:
4.0% (71,499)
Private not-for-profit wage and salary workers - Males: Straughn:
4.5% (3)Indiana:
6.1% (108,552)
Local government workers - Males: Straughn:
16.7% (11)Indiana:
4.9% (87,149)
State government workers - Males: Straughn:
3.0% (2)Indiana:
2.5% (44,697)
Self-employed workers in own not incorporated business - Males: Straughn:
15.2% (10)Indiana:
5.2% (91,870)
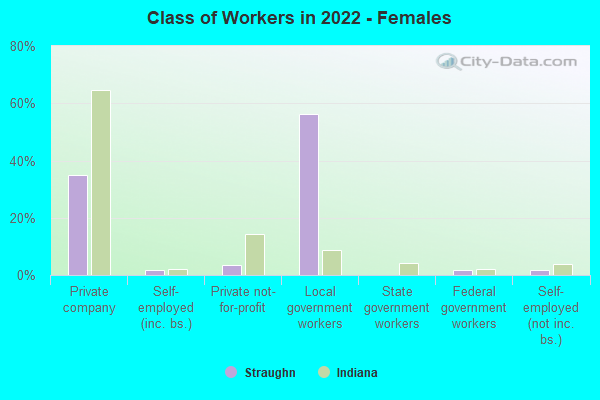
Employee of private company - Females: Straughn:
35.1% (20)Indiana:
64.7% (1,020,354)
Self-employed in own incorporated business - Females: Straughn:
1.8% (1)Indiana:
2.2% (35,154)
Private not-for-profit wage and salary workers - Females: Straughn:
3.5% (2)Indiana:
14.2% (223,528)
Local government workers - Females: Straughn:
56.1% (33)Indiana:
8.6% (135,752)
Federal government workers - Females: Straughn:
1.8% (1)Indiana:
2.0% (31,806)
Self-employed workers in own not incorporated business - Females: Straughn:
1.8% (1)Indiana:
4.0% (63,089)