Work and Jobs in Taft Heights, California (CA) Detailed Stats
Occupations, Industries, Unemployment, Workers, Commute
Settings
X


Discuss Taft Heights, California work on our local forum with over 2,400,000 registered users
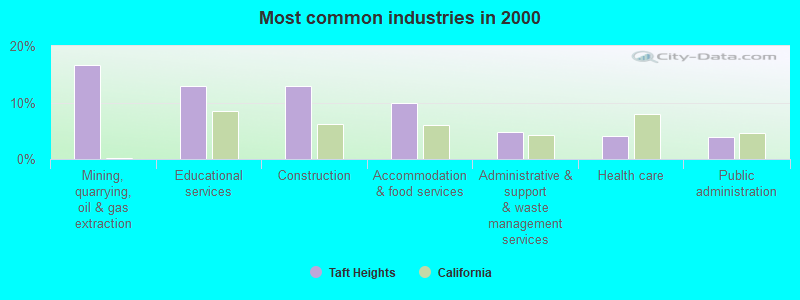
The most common industries in Taft Heights are: Mining, quarrying, oil & gas extraction (16.6% of civilian employees), Educational services (13.0% of civilian employees), Construction (12.9% of civilian employees). 98.8% of workers work in Kern County. 59.9% of workers are employees of private companies, which is 10.9% less than the rate of 66.5% across the entire state of California.
Whole page based on the data from 2000 / 2022 when the population of Taft Heights, California was 1,865 / 1,655
Whole page based on the data from 2000 / 2022 when the population of Taft Heights, California was 1,865 / 1,655
Most common industries
Most common industries | |||
|---|---|---|---|
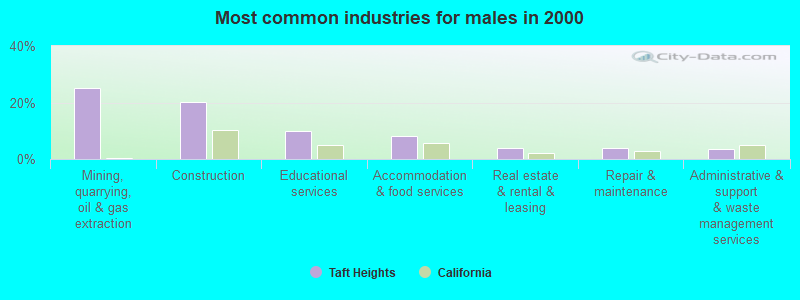
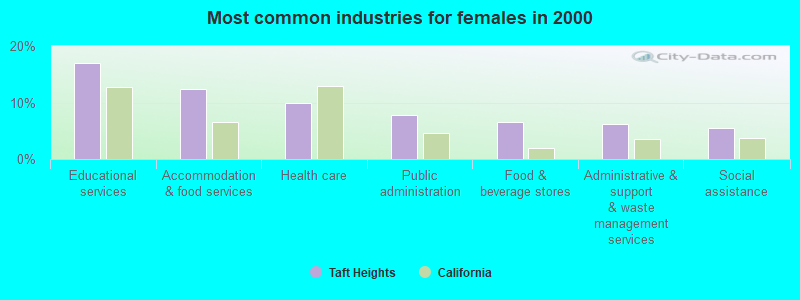
Industry | All | Males | Females |
| Mining, quarrying, and oil and gas extraction | 16.6% (120) | 25.1% (105) | 4.9% (15) |
| Educational services | 13.0% (94) | 10.0% (42) | 17.0% (52) |
| Construction | 12.9% (93) | 20.3% (85) | 2.6% (8) |
| Accommodation and food services | 10.0% (72) | 8.1% (34) | 12.5% (38) |
| Administrative and support and waste management services | 4.7% (34) | 3.6% (15) | 6.2% (19) |
| Health care | 4.1% (30) | 0.0% (0) | 9.8% (30) |
| Public administration | 3.9% (28) | 1.0% (4) | 7.9% (24) |
| Arts, entertainment, and recreation | 3.6% (26) | 2.9% (12) | 4.6% (14) |
| Repair and maintenance | 2.9% (21) | 3.8% (16) | 1.6% (5) |
| Food and beverage stores | 2.8% (20) | 0.0% (0) | 6.6% (20) |
| Real estate and rental and leasing | 2.8% (20) | 3.8% (16) | 1.3% (4) |
| Motor vehicle and parts dealers | 2.4% (17) | 0.5% (2) | 4.9% (15) |
| Social assistance | 2.4% (17) | 0.0% (0) | 5.6% (17) |
| Utilities | 1.9% (14) | 1.9% (8) | 2.0% (6) |
| Department and other general merchandise stores | 1.8% (13) | 2.2% (9) | 1.3% (4) |
| Truck transportation | 1.4% (10) | 2.4% (10) | 0.0% (0) |
| Publishing, and motion picture and sound recording industries | 1.1% (8) | 0.0% (0) | 2.6% (8) |
| Gasoline stations | 1.1% (8) | 0.7% (3) | 1.6% (5) |
| Miscellaneous manufacturing | 1.1% (8) | 1.9% (8) | 0.0% (0) |
| Data processing, libraries, and other information services | 0.8% (6) | 1.0% (4) | 0.7% (2) |
| Chemicals | 0.8% (6) | 0.0% (0) | 2.0% (6) |
| Metal and metal products | 0.8% (6) | 1.4% (6) | 0.0% (0) |
| Machinery, equipment, and supplies merchant wholesalers | 0.8% (6) | 1.4% (6) | 0.0% (0) |
| Petroleum and coal products | 0.7% (5) | 1.2% (5) | 0.0% (0) |
| Office supplies and stationery stores | 0.7% (5) | 1.2% (5) | 0.0% (0) |
| Furniture and home furnishings, and household appliance stores | 0.7% (5) | 1.2% (5) | 0.0% (0) |
| Finance and insurance | 0.7% (5) | 0.0% (0) | 1.6% (5) |
| Broadcasting and telecommunications | 0.6% (4) | 1.0% (4) | 0.0% (0) |
| Other transportation, and support activities, and couriers | 0.6% (4) | 1.0% (4) | 0.0% (0) |
| Nonmetallic mineral products | 0.6% (4) | 1.0% (4) | 0.0% (0) |
| Used merchandise, gift, novelty, and souvenir, and other miscellaneous stores | 0.4% (3) | 0.0% (0) | 1.0% (3) |
| Food | 0.3% (2) | 0.5% (2) | 0.0% (0) |
| Drugs, sundries, and chemical and allied products merchant wholesalers | 0.3% (2) | 0.0% (0) | 0.7% (2) |
| Other direct selling establishments | 0.3% (2) | 0.5% (2) | 0.0% (0) |
| Professional, scientific, and technical services | 0.3% (2) | 0.0% (0) | 0.7% (2) |
| Religious, grantmaking, civic, professional, and similar organizations | 0.3% (2) | 0.5% (2) | 0.0% (0) |
| Personal and laundry services | 0.1% (1) | 0.0% (0) | 0.3% (1) |
Unemployment in Taft Heights
- Unemployment by race in 2022
- Unemployment rate for White non-Hispanic residents
- 12.1%Males
- Unemployment rate for other race residents
- 26.5%Males
- Unemployment rate for Hispanic or Latino residents
- 9.5%Males
- Unemployment by race in 2000
- Unemployment rate for White non-Hispanic residents
- 5.0%Males
- 5.5%Females
- Unemployment rate for other race residents
- 29.5%Males
- 25.0%Females
- Unemployment rate for Hispanic or Latino residents
- 15.9%Males
- 14.6%Females
Time leaving home to go to work

12:00 a.m. to 4:59 a.m.:
| Taft Heights: | 21.0% (166) |
| California: | 6.8% (1,050,902) |
5:00 a.m. to 5:29 a.m.:
| Taft Heights: | 4.4% (35) |
| California: | 4.5% (692,772) |
5:30 a.m. to 5:59 a.m.:
| Taft Heights: | 11.0% (87) |
| California: | 4.3% (665,475) |
6:00 a.m. to 6:29 a.m.:
| Taft Heights: | 24.3% (192) |
| California: | 8.3% (1,273,588) |
6:30 a.m. to 6:59 a.m.:
| Taft Heights: | 5.4% (43) |
| California: | 7.5% (1,156,338) |
7:00 a.m. to 7:29 a.m.:
| Taft Heights: | 1.2% (10) |
| California: | 13.2% (2,027,702) |
7:30 a.m. to 7:59 a.m.:
| Taft Heights: | 3.8% (30) |
| California: | 10.1% (1,550,402) |
8:00 a.m. to 8:29 a.m.:
| Taft Heights: | 15.0% (119) |
| California: | 12.7% (1,953,986) |
9:00 a.m. to 9:59 a.m.:
| Taft Heights: | 1.4% (11) |
| California: | 8.4% (1,288,499) |
10:00 a.m. to 10:59 a.m.:
| Taft Heights: | 0.9% (7) |
| California: | 4.0% (613,193) |
12:00 p.m. to 3:59 p.m.:
| Taft Heights: | 3.0% (23) |
| California: | 7.0% (1,075,505) |
4:00 p.m. to 11:59 p.m.:
| Taft Heights: | 6.4% (50) |
| California: | 5.8% (891,240) |

<5am:
| Taft Heights: | 7.6% (54) |
| California: | 4.2% (606,086) |
5:30am:
| Taft Heights: | 4.8% (34) |
| California: | 3.6% (523,209) |
6am:
| Taft Heights: | 9.1% (65) |
| California: | 4.8% (692,256) |
6:30am:
| Taft Heights: | 12.4% (88) |
| California: | 8.4% (1,216,867) |
7am:
| Taft Heights: | 11.9% (85) |
| California: | 9.4% (1,362,830) |
7:30am:
| Taft Heights: | 13.3% (95) |
| California: | 13.8% (2,006,950) |
8am:
| Taft Heights: | 14.9% (106) |
| California: | 13.7% (1,986,831) |
8:30am:
| Taft Heights: | 8.6% (61) |
| California: | 10.9% (1,577,815) |
9am:
| Taft Heights: | 3.9% (28) |
| California: | 5.4% (778,152) |
10am:
| Taft Heights: | 1.0% (7) |
| California: | 6.7% (972,355) |
11am:
| Taft Heights: | 1.0% (7) |
| California: | 2.9% (414,479) |
12pm:
| Taft Heights: | 0.6% (4) |
| California: | 1.3% (189,005) |
4pm:
| Taft Heights: | 3.9% (28) |
| California: | 6.0% (865,284) |
>4pm:
| Taft Heights: | 4.8% (34) |
| California: | 5.3% (776,167) |

12:00 a.m. to 4:59 a.m. - Males:
| Taft Heights: | 28.4% (140) |
| California: | 8.7% (747,612) |
5:00 a.m. to 5:29 a.m. - Males:
| Taft Heights: | 6.8% (33) |
| California: | 6.0% (509,420) |
5:30 a.m. to 5:59 a.m. - Males:
| Taft Heights: | 16.8% (83) |
| California: | 5.2% (448,269) |
6:00 a.m. to 6:29 a.m. - Males:
| Taft Heights: | 29.6% (146) |
| California: | 9.8% (842,941) |
6:30 a.m. to 6:59 a.m. - Males:
| Taft Heights: | 5.9% (29) |
| California: | 7.7% (657,557) |
12:00 p.m. to 3:59 p.m. - Males:
| Taft Heights: | 4.9% (24) |
| California: | 7.0% (594,847) |
4:00 p.m. to 11:59 p.m. - Males:
| Taft Heights: | 1.7% (9) |
| California: | 5.8% (499,471) |

12:00 a.m. to 4:59 a.m. - Females:
| Taft Heights: | 6.6% (20) |
| California: | 4.4% (303,290) |
6:00 a.m. to 6:29 a.m. - Females:
| Taft Heights: | 15.6% (47) |
| California: | 6.3% (430,647) |
6:30 a.m. to 6:59 a.m. - Females:
| Taft Heights: | 4.3% (13) |
| California: | 7.3% (498,781) |
7:00 a.m. to 7:29 a.m. - Females:
| Taft Heights: | 3.1% (9) |
| California: | 14.1% (969,170) |
7:30 a.m. to 7:59 a.m. - Females:
| Taft Heights: | 10.4% (31) |
| California: | 12.4% (847,675) |
8:00 a.m. to 8:29 a.m. - Females:
| Taft Heights: | 40.8% (122) |
| California: | 14.1% (969,448) |
9:00 a.m. to 9:59 a.m. - Females:
| Taft Heights: | 3.6% (11) |
| California: | 9.2% (633,461) |
10:00 a.m. to 10:59 a.m. - Females:
| Taft Heights: | 2.4% (7) |
| California: | 4.5% (311,768) |
4:00 p.m. to 11:59 p.m. - Females:
| Taft Heights: | 11.3% (34) |
| California: | 5.7% (391,769) |
Travel time to work
Percentage of workers working in this county: 98.8%


Less than 5 minutes:
| Taft Heights: | 3.8% (27) |
| California: | 2.2% (324,703) |
5 to 9 minutes:
| Taft Heights: | 33.3% (237) |
| California: | 8.8% (1,280,443) |
10 to 14 minutes:
| Taft Heights: | 21.9% (156) |
| California: | 13.3% (1,930,263) |
15 to 19 minutes:
| Taft Heights: | 9.0% (64) |
| California: | 14.9% (2,157,970) |
20 to 24 minutes:
| Taft Heights: | 7.9% (56) |
| California: | 13.8% (2,004,060) |
25 to 29 minutes:
| Taft Heights: | 3.5% (25) |
| California: | 5.4% (782,241) |
30 to 34 minutes:
| Taft Heights: | 3.4% (24) |
| California: | 13.9% (2,025,657) |
40 to 44 minutes:
| Taft Heights: | 5.3% (38) |
| California: | 3.6% (528,043) |
45 to 59 minutes:
| Taft Heights: | 4.9% (35) |
| California: | 7.9% (1,151,598) |
60 to 89 minutes:
| Taft Heights: | 4.8% (34) |
| California: | 6.4% (933,123) |
Means of transportation to work


Drove car alone:
| Taft Heights: | 75.3% (536) |
| California: | 71.8% (10,432,462) |
Carpooled:
| Taft Heights: | 20.8% (148) |
| California: | 14.5% (2,113,313) |
Bicycle:
| Taft Heights: | 0.7% (5) |
| California: | 0.8% (120,567) |
Walked:
| Taft Heights: | 1.0% (7) |
| California: | 2.9% (414,581) |
Private vehicle occupancy

Drove alone:
| Taft Heights: | 80.3% (607) |
| California: | 86.9% (12,187,486) |
In 2 person carpool:
| Taft Heights: | 15.6% (118) |
| California: | 9.2% (1,295,561) |
In 3 person carpool:
| Taft Heights: | 2.9% (22) |
| California: | 2.2% (309,969) |
In 4 person carpool:
| Taft Heights: | 1.2% (9) |
| California: | 0.9% (126,987) |

Drove alone:
| Taft Heights: | 78.4% (536) |
| California: | 83.2% (10,432,462) |
In 2 person carpool:
| Taft Heights: | 16.7% (114) |
| California: | 12.5% (1,564,905) |
In 3 person carpool:
| Taft Heights: | 3.5% (24) |
| California: | 2.6% (330,732) |
In 4 person carpool:
| Taft Heights: | 1.5% (10) |
| California: | 1.0% (119,364) |
Class of workers

Employee of private company:
| Taft Heights: | 59.9% (484) |
| California: | 66.5% (12,596,030) |
Private not-for-profit wage and salary workers:
| Taft Heights: | 7.9% (64) |
| California: | 7.5% (1,417,407) |
Local government workers:
| Taft Heights: | 18.7% (151) |
| California: | 8.2% (1,547,056) |
State government workers:
| Taft Heights: | 5.6% (45) |
| California: | 4.1% (780,915) |
Federal government workers:
| Taft Heights: | 2.1% (17) |
| California: | 2.0% (369,858) |
Self-employed workers in own not incorporated business:
| Taft Heights: | 2.8% (23) |
| California: | 7.4% (1,410,735) |
Unpaid family workers:
| Taft Heights: | 3.0% (24) |
| California: | 0.2% (36,267) |

Employee of private company:
| Taft Heights: | 71.9% (520) |
| California: | 68.0% (10,009,465) |
Self-employed in own incorporated business:
| Taft Heights: | 0.6% (4) |
| California: | 2.7% (402,392) |
Private not-for-profit wage and salary workers:
| Taft Heights: | 2.9% (21) |
| California: | 5.7% (845,536) |
Local government workers:
| Taft Heights: | 11.8% (85) |
| California: | 8.3% (1,218,764) |
State government workers:
| Taft Heights: | 4.7% (34) |
| California: | 4.0% (594,953) |
Federal government workers:
| Taft Heights: | 1.7% (12) |
| California: | 2.3% (344,354) |
Self-employed workers in own not incorporated business:
| Taft Heights: | 5.5% (40) |
| California: | 8.5% (1,249,530) |
Unpaid family workers:
| Taft Heights: | 1.0% (7) |
| California: | 0.4% (53,934) |

Employee of private company - Males:
| Taft Heights: | 66.5% (335) |
| California: | 70.3% (7,191,252) |
Private not-for-profit wage and salary workers - Males:
| Taft Heights: | 8.3% (42) |
| California: | 5.2% (529,122) |
Local government workers - Males:
| Taft Heights: | 18.0% (91) |
| California: | 6.0% (610,331) |
State government workers - Males:
| Taft Heights: | 2.5% (13) |
| California: | 3.4% (343,636) |
Federal government workers - Males:
| Taft Heights: | 3.3% (17) |
| California: | 2.1% (209,874) |
Self-employed workers in own not incorporated business - Males:
| Taft Heights: | 1.4% (7) |
| California: | 8.1% (824,359) |

Employee of private company - Females:
| Taft Heights: | 49.1% (149) |
| California: | 62.0% (5,404,778) |
Private not-for-profit wage and salary workers - Females:
| Taft Heights: | 7.2% (22) |
| California: | 10.2% (888,285) |
Local government workers - Females:
| Taft Heights: | 19.9% (61) |
| California: | 10.8% (936,725) |
State government workers - Females:
| Taft Heights: | 10.7% (32) |
| California: | 5.0% (437,279) |
Self-employed workers in own not incorporated business - Females:
| Taft Heights: | 5.2% (16) |
| California: | 6.7% (586,376) |
Unpaid family workers - Females:
| Taft Heights: | 7.9% (24) |
| California: | 0.2% (18,345) |