Work and Jobs in Willington, Connecticut (CT) Detailed Stats
Occupations, Industries, Unemployment, Workers, Commute
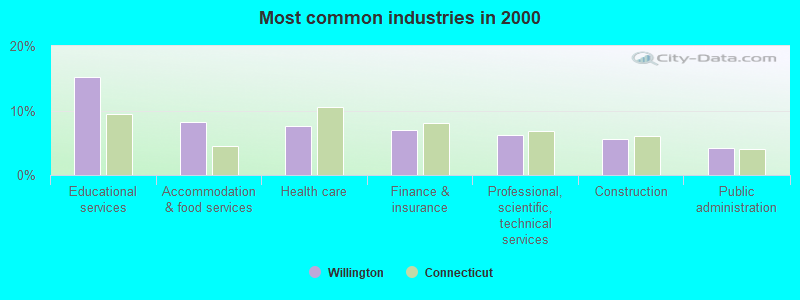
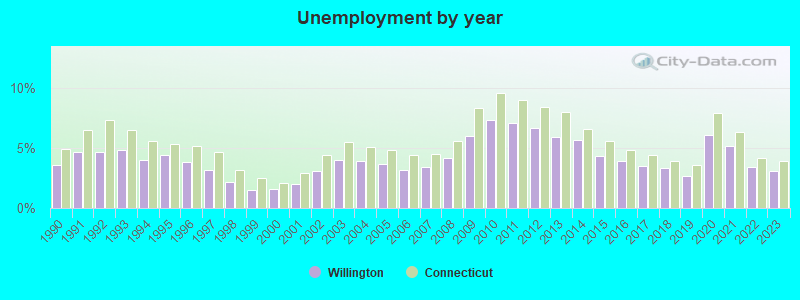
The unemployment rate in 2023 in Willington, CT was 3.1%, which was 25.8% less than the unemployment rate of 3.9% across the entire state of Connecticut. Compared to the unemployment rate of 5.9% in 2013, this represents a decrease of 90.3%. The most common industries in Willington are: Educational services (15.3% of civilian employees), Accommodation & food services (8.2% of civilian employees), Health care (7.7% of civilian employees). 59.7% of workers are employees of private companies, which is 15.0% less than the rate of 68.6% across the entire state of Connecticut.
Most common industries
Most common industries | |||
|---|---|---|---|
Industry | All | Males | Females |
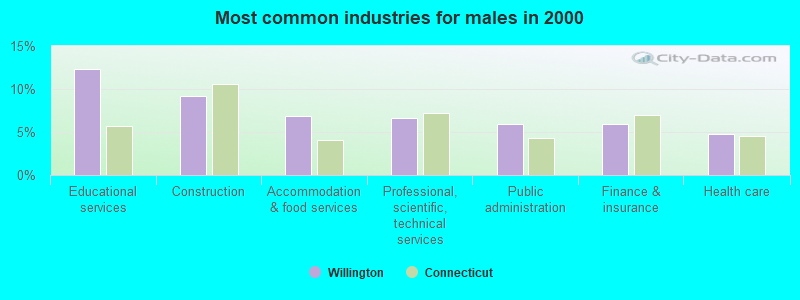
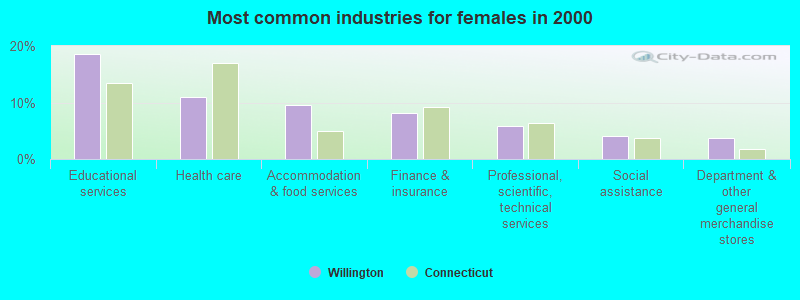
| Educational services | 15.3% (543) | 12.3% (234) | 18.6% (309) |
| Accommodation and food services | 8.2% (291) | 6.9% (131) | 9.6% (160) |
| Health care | 7.7% (273) | 4.8% (91) | 10.9% (182) |
| Finance and insurance | 6.9% (247) | 5.9% (112) | 8.1% (135) |
| Professional, scientific, and technical services | 6.2% (222) | 6.6% (126) | 5.8% (96) |
| Construction | 5.6% (200) | 9.2% (174) | 1.6% (26) |
| Public administration | 4.2% (148) | 6.0% (113) | 2.1% (35) |
| Arts, entertainment, and recreation | 2.5% (88) | 1.5% (29) | 3.5% (59) |
| Other transportation, and support activities, and couriers | 2.3% (81) | 2.2% (41) | 2.4% (40) |
| Administrative and support and waste management services | 2.2% (79) | 3.6% (68) | 0.7% (11) |
| Transportation equipment | 2.0% (72) | 3.4% (65) | 0.4% (7) |
| Social assistance | 1.9% (67) | 0.0% (0) | 4.0% (67) |
| Computer and electronic products | 1.8% (64) | 1.0% (19) | 2.7% (45) |
| Personal and laundry services | 1.8% (64) | 0.8% (16) | 2.9% (48) |
| Department and other general merchandise stores | 1.7% (61) | 0.0% (0) | 3.7% (61) |
| Real estate and rental and leasing | 1.5% (54) | 2.5% (47) | 0.4% (7) |
| Repair and maintenance | 1.5% (52) | 2.7% (52) | 0.0% (0) |
| Printing and related support activities | 1.4% (51) | 1.0% (19) | 1.9% (32) |
| Miscellaneous manufacturing | 1.4% (51) | 1.6% (31) | 1.2% (20) |
| Metal and metal products | 1.4% (49) | 2.6% (49) | 0.0% (0) |
| Machinery | 1.3% (47) | 2.2% (41) | 0.4% (6) |
| Motor vehicle and parts dealers | 1.2% (44) | 2.0% (38) | 0.4% (6) |
| Gasoline stations | 1.2% (43) | 0.8% (16) | 1.6% (27) |
| Music stores | 1.2% (41) | 2.2% (41) | 0.0% (0) |
| Agriculture, forestry, fishing and hunting | 1.1% (40) | 1.2% (23) | 1.0% (17) |
| Pharmacies and drug stores | 1.1% (38) | 0.0% (0) | 2.3% (38) |
| Sporting goods, camera, and hobby and toy stores | 0.9% (32) | 1.1% (21) | 0.7% (11) |
| Furniture and home furnishings, and household appliance stores | 0.9% (31) | 0.8% (16) | 0.9% (15) |
| Building material and garden equipment and supplies dealers | 0.8% (29) | 1.2% (22) | 0.4% (7) |
| Clothing and accessories, including shoe, stores | 0.8% (27) | 0.0% (0) | 1.6% (27) |
| Radio, TV, and computer stores | 0.8% (27) | 1.1% (21) | 0.4% (6) |
| Truck transportation | 0.7% (26) | 1.4% (26) | 0.0% (0) |
| Electrical equipment, appliances, and components | 0.7% (26) | 1.4% (26) | 0.0% (0) |
| Broadcasting and telecommunications | 0.7% (25) | 0.8% (16) | 0.5% (9) |
| Used merchandise, gift, novelty, and souvenir, and other miscellaneous stores | 0.6% (23) | 0.3% (5) | 1.1% (18) |
| U. S. Postal service | 0.6% (23) | 0.8% (16) | 0.4% (7) |
| Retail florists | 0.6% (22) | 0.8% (16) | 0.4% (6) |
| Fuel dealers | 0.6% (20) | 0.5% (9) | 0.7% (11) |
| Plastics and rubber products | 0.6% (20) | 0.4% (7) | 0.8% (13) |
| Food and beverage stores | 0.6% (20) | 0.6% (12) | 0.5% (8) |
| Publishing, and motion picture and sound recording industries | 0.5% (18) | 0.0% (0) | 1.1% (18) |
| Other direct selling establishments | 0.5% (17) | 0.4% (7) | 0.6% (10) |
| Utilities | 0.4% (14) | 0.7% (14) | 0.0% (0) |
| Religious, grantmaking, civic, professional, and similar organizations | 0.4% (13) | 0.3% (6) | 0.4% (7) |
| Book stores and news dealers | 0.3% (12) | 0.6% (12) | 0.0% (0) |
| Apparel, fabrics, and notions merchant wholesalers | 0.3% (12) | 0.0% (0) | 0.7% (12) |
| Air transportation | 0.3% (11) | 0.0% (0) | 0.7% (11) |
| Textile mills and textile products | 0.3% (10) | 0.5% (10) | 0.0% (0) |
| Chemicals | 0.3% (10) | 0.5% (10) | 0.0% (0) |
| Paper and paper products merchant wholesalers | 0.3% (10) | 0.5% (10) | 0.0% (0) |
| Mining, quarrying, and oil and gas extraction | 0.3% (9) | 0.0% (0) | 0.5% (9) |
| Beverage and tobacco products | 0.3% (9) | 0.5% (9) | 0.0% (0) |
| Vending machine operators | 0.3% (9) | 0.0% (0) | 0.5% (9) |
| Petroleum and petroleum products merchant wholesalers | 0.2% (8) | 0.4% (8) | 0.0% (0) |
| Warehousing and storage | 0.2% (8) | 0.0% (0) | 0.5% (8) |
| Hardware, plumbing and heating equipment, and supplies merchant wholesalers | 0.2% (8) | 0.4% (8) | 0.0% (0) |
| Electronic shopping and mail-order houses | 0.2% (7) | 0.0% (0) | 0.4% (7) |
| Nonmetallic mineral products | 0.2% (7) | 0.4% (7) | 0.0% (0) |
| Data processing, libraries, and other information services | 0.1% (5) | 0.3% (5) | 0.0% (0) |
Unemployment in Willington
- Unemployment by race in 2000
- Unemployment rate for White non-Hispanic residents
- 4.3%Males
- 0.7%Females
- Unemployment rate for Asian residents
- 48.0%Females
Unemployment in 2023:
| Willington: | 3.1% |
| Connecticut: | 3.9% |
Unemployment in 2022:
| Willington: | 3.4% |
| Connecticut: | 4.2% |
Unemployment in 2021:
| Willington: | 5.2% |
| Connecticut: | 6.3% |
Unemployment in 2020:
| Willington: | 6.1% |
| Connecticut: | 7.9% |
Unemployment in 2019:
| Willington: | 2.7% |
| Connecticut: | 3.6% |
Unemployment in 2018:
| Willington: | 3.3% |
| Connecticut: | 3.9% |
Unemployment in 2017:
| Willington: | 3.5% |
| Connecticut: | 4.4% |
Unemployment in 2016:
| Willington: | 3.9% |
| Connecticut: | 4.8% |
Unemployment in 2015:
| Willington: | 4.3% |
| Connecticut: | 5.6% |
Unemployment in 2014:
| Willington: | 5.7% |
| Connecticut: | 6.6% |
Unemployment in 2013:
| Willington: | 5.9% |
| Connecticut: | 8.0% |
Unemployment in 2012:
| Willington: | 6.7% |
| Connecticut: | 8.4% |
Unemployment in 2011:
| Willington: | 7.1% |
| Connecticut: | 9.0% |
Unemployment in 2010:
| Willington: | 7.3% |
| Connecticut: | 9.6% |
Unemployment in 2009:
| Willington: | 6.0% |
| Connecticut: | 8.3% |
Unemployment in 2008:
| Willington: | 4.2% |
| Connecticut: | 5.6% |
Unemployment in 2007:
| Willington: | 3.4% |
| Connecticut: | 4.5% |
Unemployment in 2006:
| Willington: | 3.2% |
| Connecticut: | 4.4% |
Unemployment in 2005:
| Willington: | 3.7% |
| Connecticut: | 4.8% |
Unemployment in 2004:
| Willington: | 3.9% |
| Connecticut: | 5.1% |
Unemployment in 2003:
| Willington: | 4.0% |
| Connecticut: | 5.5% |
Unemployment in 2002:
| Willington: | 3.1% |
| Connecticut: | 4.4% |
Unemployment in 2001:
| Willington: | 2.0% |
| Connecticut: | 2.9% |
Unemployment in 2000:
| Willington: | 1.6% |
| Connecticut: | 2.1% |
Unemployment in 1999:
| Willington: | 1.5% |
| Connecticut: | 2.5% |
Unemployment in 1998:
| Willington: | 2.2% |
| Connecticut: | 3.2% |
Unemployment in 1997:
| Willington: | 3.2% |
| Connecticut: | 4.7% |
Unemployment in 1996:
| Willington: | 3.8% |
| Connecticut: | 5.2% |
Unemployment in 1995:
| Willington: | 4.4% |
| Connecticut: | 5.3% |
Unemployment in 1994:
| Willington: | 4.0% |
| Connecticut: | 5.6% |
Unemployment in 1993:
| Willington: | 4.8% |
| Connecticut: | 6.5% |
Unemployment in 1992:
| Willington: | 4.7% |
| Connecticut: | 7.3% |
Unemployment in 1991:
| Willington: | 4.7% |
| Connecticut: | 6.5% |
Unemployment in 1990:
| Willington: | 3.6% |
| Connecticut: | 4.9% |
Time leaving home to go to work
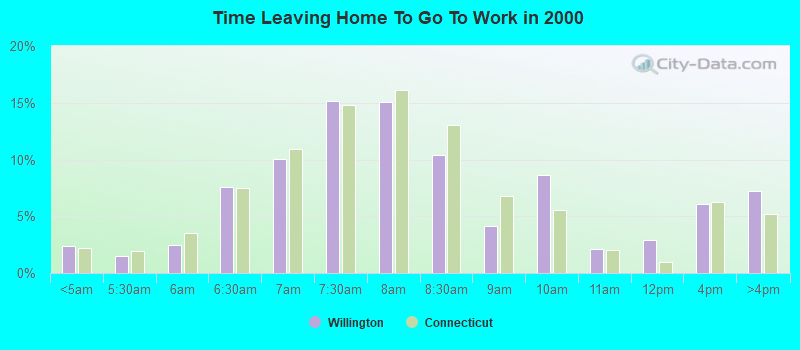
<5am:
| Willington: | 2.4% (83) |
| Connecticut: | 2.2% (35,436) |
5:30am:
| Willington: | 1.5% (52) |
| Connecticut: | 2.0% (32,039) |
6am:
| Willington: | 2.5% (87) |
| Connecticut: | 3.5% (57,499) |
6:30am:
| Willington: | 7.6% (263) |
| Connecticut: | 7.5% (123,062) |
7am:
| Willington: | 10.0% (349) |
| Connecticut: | 10.9% (179,325) |
7:30am:
| Willington: | 15.1% (527) |
| Connecticut: | 14.8% (242,766) |
8am:
| Willington: | 15.1% (525) |
| Connecticut: | 16.2% (265,137) |
8:30am:
| Willington: | 10.4% (362) |
| Connecticut: | 13.1% (214,263) |
9am:
| Willington: | 4.1% (144) |
| Connecticut: | 6.8% (110,992) |
10am:
| Willington: | 8.6% (301) |
| Connecticut: | 5.6% (91,313) |
11am:
| Willington: | 2.1% (73) |
| Connecticut: | 2.0% (33,574) |
12pm:
| Willington: | 2.9% (102) |
| Connecticut: | 1.0% (15,996) |
4pm:
| Willington: | 6.1% (211) |
| Connecticut: | 6.3% (102,744) |
>4pm:
| Willington: | 7.2% (250) |
| Connecticut: | 5.2% (85,259) |
Travel time to work
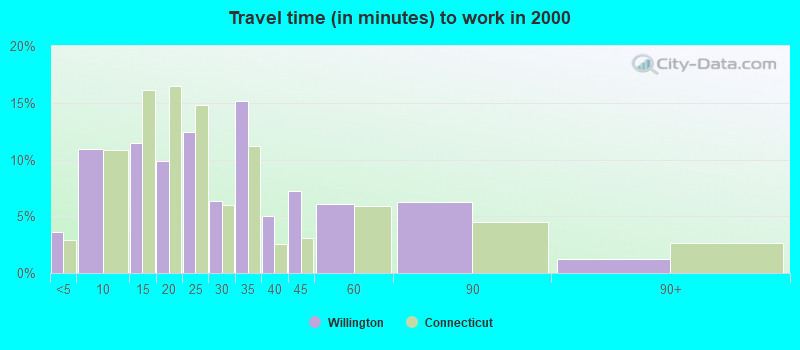
Less than 5 minutes:
| Willington: | 3.6% (127) |
| Connecticut: | 2.9% (47,035) |
5 to 9 minutes:
| Willington: | 10.9% (380) |
| Connecticut: | 10.8% (177,296) |
10 to 14 minutes:
| Willington: | 11.5% (400) |
| Connecticut: | 16.1% (264,948) |
15 to 19 minutes:
| Willington: | 9.9% (343) |
| Connecticut: | 16.4% (269,915) |
20 to 24 minutes:
| Willington: | 12.4% (431) |
| Connecticut: | 14.8% (242,914) |
25 to 29 minutes:
| Willington: | 6.3% (220) |
| Connecticut: | 6.0% (98,144) |
30 to 34 minutes:
| Willington: | 15.1% (527) |
| Connecticut: | 11.2% (184,005) |
35 to 39 minutes:
| Willington: | 5.0% (175) |
| Connecticut: | 2.6% (41,860) |
40 to 44 minutes:
| Willington: | 7.2% (252) |
| Connecticut: | 3.1% (50,084) |
45 to 59 minutes:
| Willington: | 6.1% (211) |
| Connecticut: | 5.9% (96,492) |
60 to 89 minutes:
| Willington: | 6.3% (219) |
| Connecticut: | 4.5% (74,032) |
90 or more minutes:
| Willington: | 1.3% (44) |
| Connecticut: | 2.6% (42,680) |
Means of transportation to work
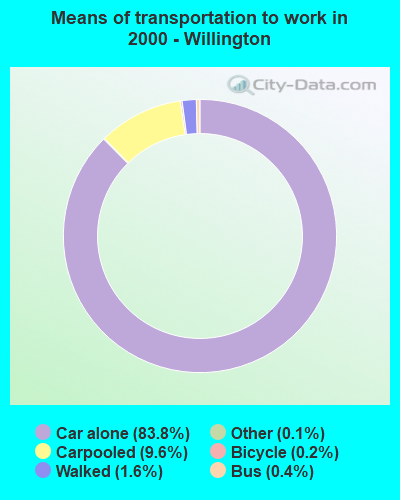
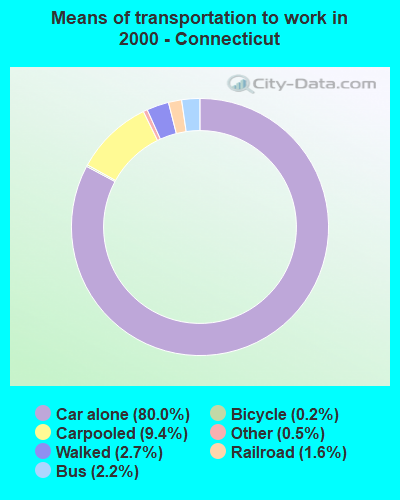
Drove car alone:
| Willington: | 83.8% (2,916) |
| Connecticut: | 80.0% (1,312,700) |
Carpooled:
| Willington: | 9.6% (333) |
| Connecticut: | 9.4% (154,400) |
Bus or trolley bus:
| Willington: | 0.4% (13) |
| Connecticut: | 2.2% (36,097) |
Bicycle:
| Willington: | 0.2% (8) |
| Connecticut: | 0.2% (2,875) |
Walked:
| Willington: | 1.6% (54) |
| Connecticut: | 2.7% (44,348) |
Other means:
| Willington: | 0.1% (5) |
| Connecticut: | 0.5% (8,479) |
Private vehicle occupancy
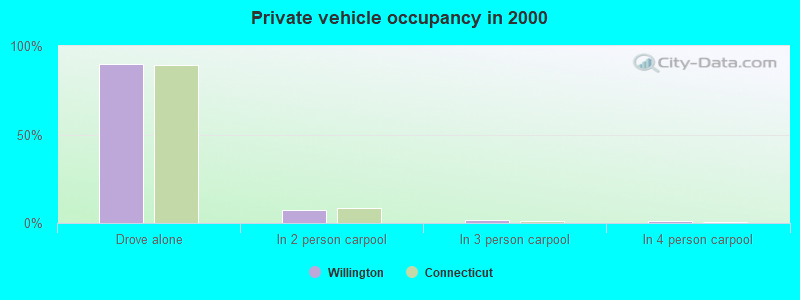
Drove alone:
| Willington: | 89.8% (2,916) |
| Connecticut: | 89.5% (1,312,700) |
In 2 person carpool:
| Willington: | 7.2% (234) |
| Connecticut: | 8.5% (124,051) |
In 3 person carpool:
| Willington: | 1.7% (55) |
| Connecticut: | 1.2% (17,722) |
In 4 person carpool:
| Willington: | 0.9% (28) |
| Connecticut: | 0.4% (5,991) |
In 7+ person carpool:
| Willington: | 0.5% (16) |
| Connecticut: | 0.2% (2,980) |
Class of workers
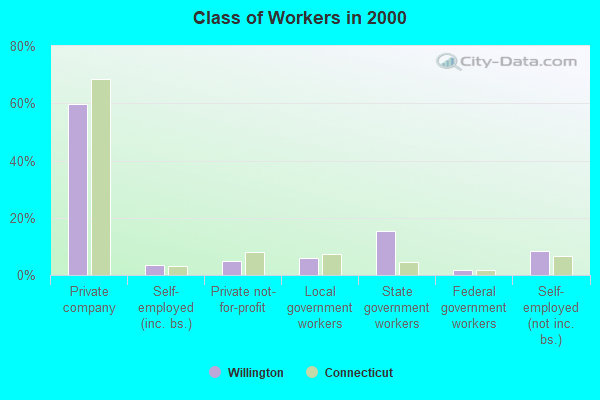
Employee of private company:
| Willington: | 59.7% (2,123) |
| Connecticut: | 68.6% (1,141,965) |
Self-employed in own incorporated business:
| Willington: | 3.5% (126) |
| Connecticut: | 3.3% (54,345) |
Private not-for-profit wage and salary workers:
| Willington: | 4.9% (174) |
| Connecticut: | 8.1% (134,058) |
Local government workers:
| Willington: | 6.0% (215) |
| Connecticut: | 7.3% (121,409) |
State government workers:
| Willington: | 15.5% (552) |
| Connecticut: | 4.4% (73,377) |
Federal government workers:
| Willington: | 1.8% (65) |
| Connecticut: | 1.6% (26,626) |
Self-employed workers in own not incorporated business:
| Willington: | 8.3% (294) |
| Connecticut: | 6.5% (108,945) |
Unpaid family workers:
| Willington: | 0.3% (9) |
| Connecticut: | 0.2% (3,715) |
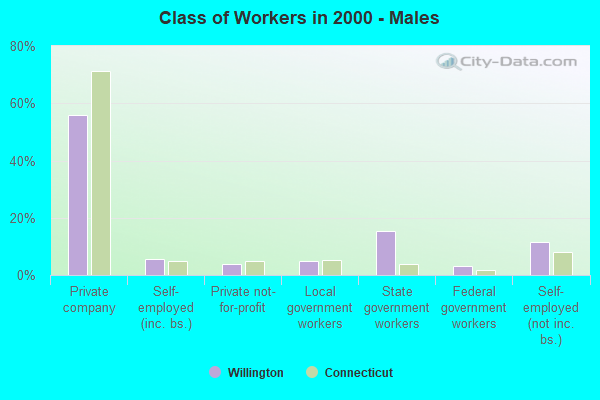
Employee of private company - Males:
| Willington: | 55.7% (1,056) |
| Connecticut: | 71.2% (617,694) |
Self-employed in own incorporated business - Males:
| Willington: | 5.7% (108) |
| Connecticut: | 4.8% (41,677) |
Private not-for-profit wage and salary workers - Males:
| Willington: | 3.7% (70) |
| Connecticut: | 4.9% (42,413) |
Local government workers - Males:
| Willington: | 4.9% (92) |
| Connecticut: | 5.3% (45,840) |
State government workers - Males:
| Willington: | 15.4% (291) |
| Connecticut: | 3.9% (34,214) |
Federal government workers - Males:
| Willington: | 3.1% (58) |
| Connecticut: | 1.8% (15,862) |
Self-employed workers in own not incorporated business - Males:
| Willington: | 11.6% (220) |
| Connecticut: | 7.9% (68,743) |
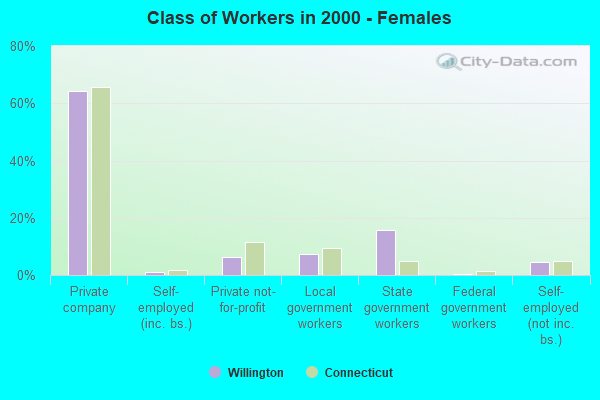
Employee of private company - Females:
| Willington: | 64.2% (1,067) |
| Connecticut: | 65.8% (524,271) |
Self-employed in own incorporated business - Females:
| Willington: | 1.1% (18) |
| Connecticut: | 1.6% (12,668) |
Private not-for-profit wage and salary workers - Females:
| Willington: | 6.3% (104) |
| Connecticut: | 11.5% (91,645) |
Local government workers - Females:
| Willington: | 7.4% (123) |
| Connecticut: | 9.5% (75,569) |
State government workers - Females:
| Willington: | 15.7% (261) |
| Connecticut: | 4.9% (39,163) |
Federal government workers - Females:
| Willington: | 0.4% (7) |
| Connecticut: | 1.4% (10,764) |
Self-employed workers in own not incorporated business - Females:
| Willington: | 4.4% (74) |
| Connecticut: | 5.0% (40,202) |
Unpaid family workers - Females:
| Willington: | 0.5% (9) |
| Connecticut: | 0.3% (2,098) |