Work and Jobs in Woodland, Illinois (IL) Detailed Stats
Occupations, Industries, Unemployment, Workers, Commute
Settings
X


Recent posts about work in Woodland, Illinois on our local forum with over 2,400,000 registered users:
 | Does anyone think we're entering another real estate bubble? (220 replies) |
| Quality of life in Grayslake and Gurnee? (17 replies) |
| What are the densest, most NYC looking neighborhoods in Chicago? (146 replies) |
| Thoughts on the following suburbs.... (16 replies) |
| Potential job in des plaines, where to live??? (13 replies) |
| What's up with Hickory Hills? (12 replies) |
Latest news about work in Woodland, IL collected exclusively by city-data.com from local newspapers, TV, and radio stations
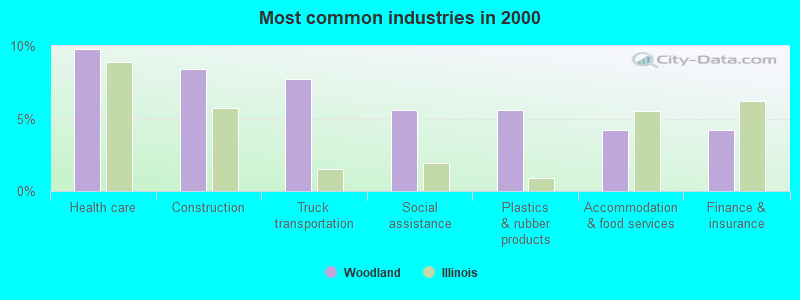
The most common industries in Woodland are: Health care (9.8% of civilian employees), Construction (8.4% of civilian employees), Truck transportation (7.7% of civilian employees). 72.6% of workers work in Iroquois County. 89.6% of workers are employees of private companies, which is 23.8% greater than the rate of 68.3% across the entire state of Illinois.
Whole page based on the data from 2000 / 2022 when the population of Woodland, Illinois was 319 / 306
Whole page based on the data from 2000 / 2022 when the population of Woodland, Illinois was 319 / 306
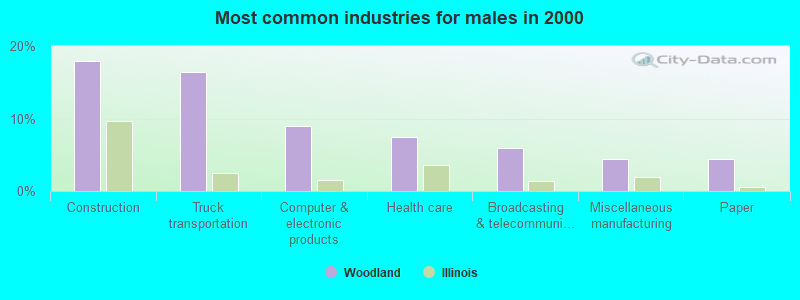
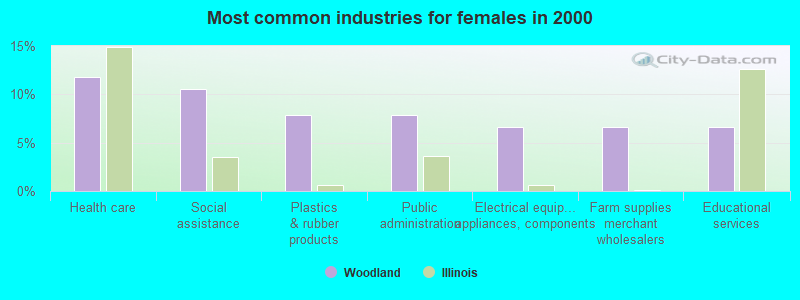
Most common industries
Most common industries | |||
|---|---|---|---|
Industry | All | Males | Females |
| Health care | 9.8% (14) | 7.5% (5) | 11.8% (9) |
| Construction | 8.4% (12) | 17.9% (12) | 0.0% (0) |
| Truck transportation | 7.7% (11) | 16.4% (11) | 0.0% (0) |
| Social assistance | 5.6% (8) | 0.0% (0) | 10.5% (8) |
| Plastics and rubber products | 5.6% (8) | 3.0% (2) | 7.9% (6) |
| Accommodation and food services | 4.2% (6) | 4.5% (3) | 3.9% (3) |
| Finance and insurance | 4.2% (6) | 3.0% (2) | 5.3% (4) |
| Public administration | 4.2% (6) | 0.0% (0) | 7.9% (6) |
| Computer and electronic products | 4.2% (6) | 9.0% (6) | 0.0% (0) |
| Educational services | 3.5% (5) | 0.0% (0) | 6.6% (5) |
| Paper | 3.5% (5) | 4.5% (3) | 2.6% (2) |
| Electrical equipment, appliances, and components | 3.5% (5) | 0.0% (0) | 6.6% (5) |
| Farm supplies merchant wholesalers | 3.5% (5) | 0.0% (0) | 6.6% (5) |
| Miscellaneous manufacturing | 3.5% (5) | 4.5% (3) | 2.6% (2) |
| Broadcasting and telecommunications | 2.8% (4) | 6.0% (4) | 0.0% (0) |
| Printing and related support activities | 2.8% (4) | 3.0% (2) | 2.6% (2) |
| Utilities | 2.8% (4) | 3.0% (2) | 2.6% (2) |
| Other direct selling establishments | 2.8% (4) | 0.0% (0) | 5.3% (4) |
| Personal and laundry services | 2.8% (4) | 0.0% (0) | 5.3% (4) |
| Food and beverage stores | 2.1% (3) | 4.5% (3) | 0.0% (0) |
| Professional, scientific, and technical services | 1.4% (2) | 0.0% (0) | 2.6% (2) |
| Department and other general merchandise stores | 1.4% (2) | 3.0% (2) | 0.0% (0) |
| Other transportation, and support activities, and couriers | 1.4% (2) | 0.0% (0) | 2.6% (2) |
| Metal and metal products | 1.4% (2) | 3.0% (2) | 0.0% (0) |
| Transportation equipment | 1.4% (2) | 0.0% (0) | 2.6% (2) |
| Motor vehicle and parts dealers | 1.4% (2) | 3.0% (2) | 0.0% (0) |
| Fuel dealers | 1.4% (2) | 3.0% (2) | 0.0% (0) |
| Private households | 1.4% (2) | 0.0% (0) | 2.6% (2) |
| Building material and garden equipment and supplies dealers | 0.7% (1) | 1.5% (1) | 0.0% (0) |
| Religious, grantmaking, civic, professional, and similar organizations | 0.7% (1) | 0.0% (0) | 1.3% (1) |
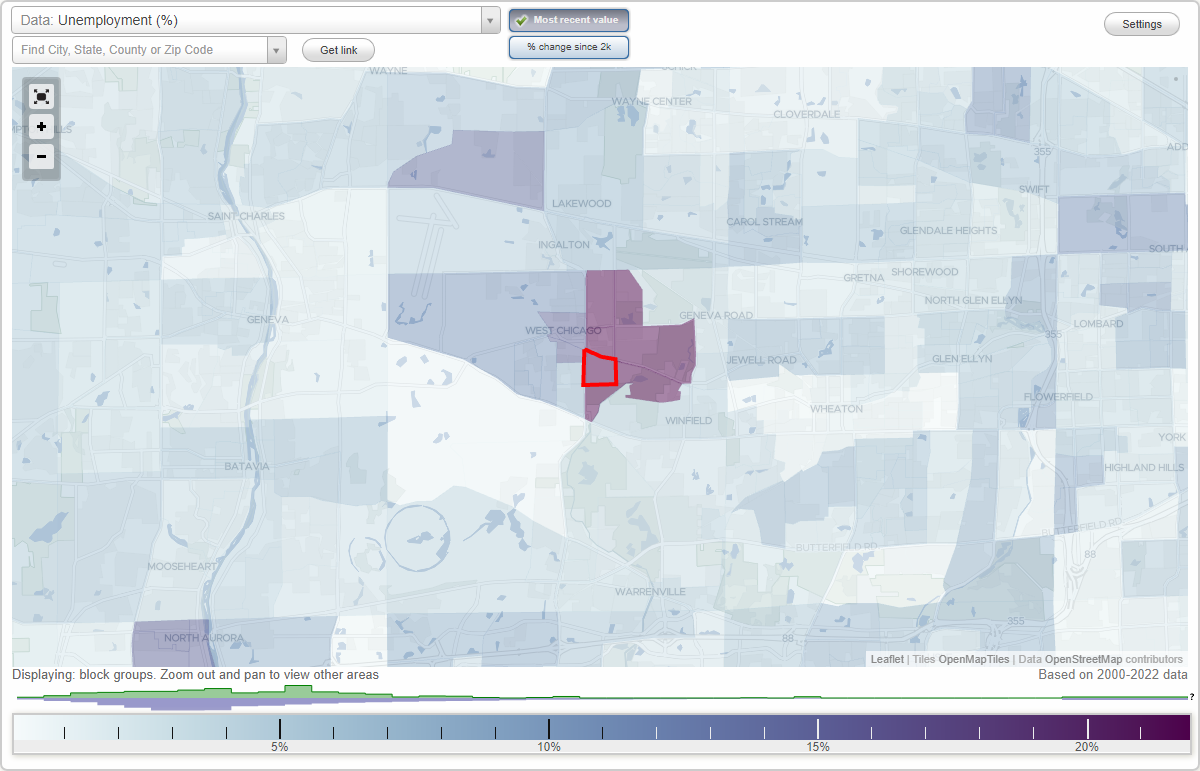
Unemployment in Woodland
- Unemployment by race in 2022
- Unemployment rate for White non-Hispanic residents
- 3.0%Males
- 8.2%Females
- Unemployment by race in 2000
- Unemployment rate for White non-Hispanic residents
- 3.1%Males
- 5.0%Females
Time leaving home to go to work
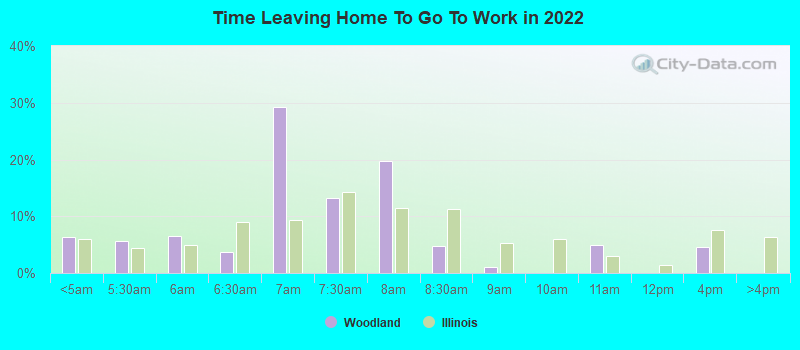
12:00 a.m. to 4:59 a.m.:
| Woodland: | 6.3% (6) |
| Illinois: | 6.0% (313,385) |
5:00 a.m. to 5:29 a.m.:
| Woodland: | 5.7% (6) |
| Illinois: | 4.3% (226,583) |
5:30 a.m. to 5:59 a.m.:
| Woodland: | 6.4% (7) |
| Illinois: | 4.9% (254,951) |
6:00 a.m. to 6:29 a.m.:
| Woodland: | 3.6% (4) |
| Illinois: | 8.9% (466,416) |
6:30 a.m. to 6:59 a.m.:
| Woodland: | 29.2% (30) |
| Illinois: | 9.3% (484,300) |
7:00 a.m. to 7:29 a.m.:
| Woodland: | 13.1% (13) |
| Illinois: | 14.3% (746,798) |
7:30 a.m. to 7:59 a.m.:
| Woodland: | 19.7% (20) |
| Illinois: | 11.5% (597,236) |
8:00 a.m. to 8:29 a.m.:
| Woodland: | 4.8% (5) |
| Illinois: | 11.2% (585,810) |
8:30 a.m. to 8:59 a.m.:
| Woodland: | 1.0% (1) |
| Illinois: | 5.2% (271,981) |
10:00 a.m. to 10:59 a.m.:
| Woodland: | 4.9% (5) |
| Illinois: | 2.9% (153,745) |
12:00 p.m. to 3:59 p.m.:
| Woodland: | 4.6% (5) |
| Illinois: | 7.6% (397,128) |
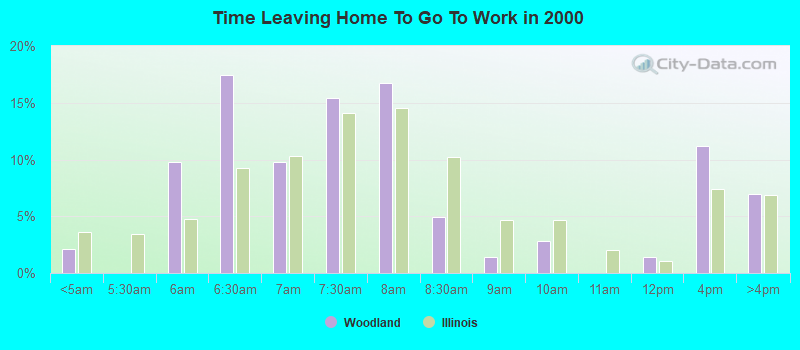
<5am:
| Woodland: | 2.1% (3) |
| Illinois: | 3.6% (205,429) |
6am:
| Woodland: | 9.8% (14) |
| Illinois: | 4.8% (274,395) |
6:30am:
| Woodland: | 17.5% (25) |
| Illinois: | 9.3% (532,224) |
7am:
| Woodland: | 9.8% (14) |
| Illinois: | 10.3% (593,196) |
7:30am:
| Woodland: | 15.4% (22) |
| Illinois: | 14.1% (808,399) |
8am:
| Woodland: | 16.8% (24) |
| Illinois: | 14.5% (834,444) |
8:30am:
| Woodland: | 4.9% (7) |
| Illinois: | 10.2% (588,282) |
9am:
| Woodland: | 1.4% (2) |
| Illinois: | 4.6% (266,648) |
10am:
| Woodland: | 2.8% (4) |
| Illinois: | 4.7% (269,854) |
12pm:
| Woodland: | 1.4% (2) |
| Illinois: | 1.0% (59,913) |
4pm:
| Woodland: | 11.2% (16) |
| Illinois: | 7.4% (425,049) |
>4pm:
| Woodland: | 7.0% (10) |
| Illinois: | 6.8% (393,506) |
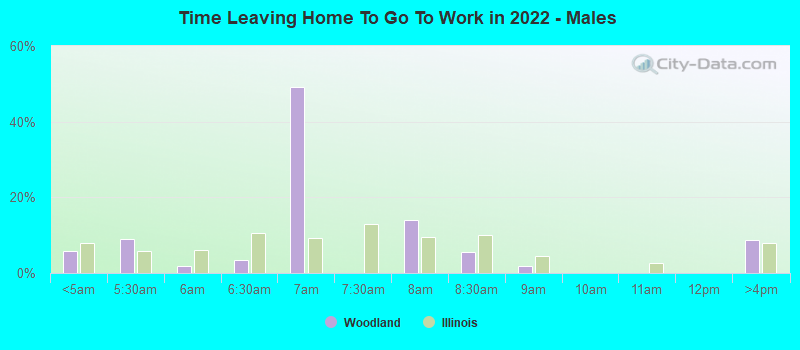
12:00 a.m. to 4:59 a.m. - Males:
| Woodland: | 5.8% (3) |
| Illinois: | 7.8% (217,984) |
5:00 a.m. to 5:29 a.m. - Males:
| Woodland: | 8.9% (5) |
| Illinois: | 5.9% (165,953) |
5:30 a.m. to 5:59 a.m. - Males:
| Woodland: | 1.7% (1) |
| Illinois: | 6.1% (170,969) |
6:00 a.m. to 6:29 a.m. - Males:
| Woodland: | 3.3% (2) |
| Illinois: | 10.5% (292,003) |
6:30 a.m. to 6:59 a.m. - Males:
| Woodland: | 49.1% (27) |
| Illinois: | 9.4% (261,362) |
7:30 a.m. to 7:59 a.m. - Males:
| Woodland: | 14.1% (8) |
| Illinois: | 9.5% (265,464) |
8:00 a.m. to 8:29 a.m. - Males:
| Woodland: | 5.4% (3) |
| Illinois: | 10.1% (280,890) |
8:30 a.m. to 8:59 a.m. - Males:
| Woodland: | 1.8% (1) |
| Illinois: | 4.4% (122,100) |
12:00 p.m. to 3:59 p.m. - Males:
| Woodland: | 8.8% (5) |
| Illinois: | 8.0% (224,733) |
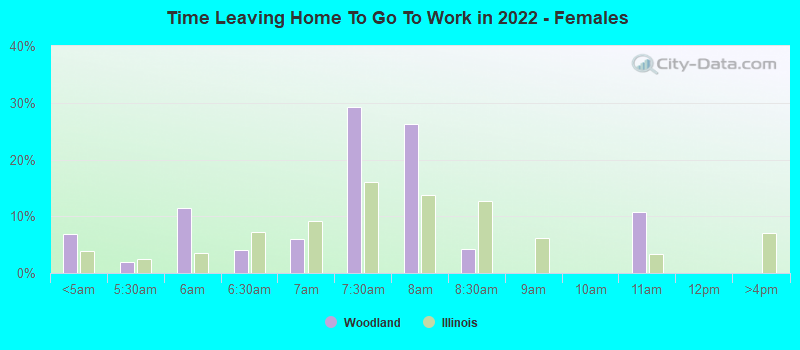
12:00 a.m. to 4:59 a.m. - Females:
| Woodland: | 6.8% (3) |
| Illinois: | 3.9% (95,401) |
5:00 a.m. to 5:29 a.m. - Females:
| Woodland: | 2.0% (1) |
| Illinois: | 2.5% (60,630) |
5:30 a.m. to 5:59 a.m. - Females:
| Woodland: | 11.5% (5) |
| Illinois: | 3.5% (83,982) |
6:00 a.m. to 6:29 a.m. - Females:
| Woodland: | 4.0% (2) |
| Illinois: | 7.2% (174,413) |
6:30 a.m. to 6:59 a.m. - Females:
| Woodland: | 5.9% (3) |
| Illinois: | 9.2% (222,938) |
7:00 a.m. to 7:29 a.m. - Females:
| Woodland: | 29.3% (14) |
| Illinois: | 16.0% (386,700) |
7:30 a.m. to 7:59 a.m. - Females:
| Woodland: | 26.2% (12) |
| Illinois: | 13.7% (331,772) |
8:00 a.m. to 8:29 a.m. - Females:
| Woodland: | 4.1% (2) |
| Illinois: | 12.6% (304,920) |
10:00 a.m. to 10:59 a.m. - Females:
| Woodland: | 10.8% (5) |
| Illinois: | 3.3% (80,943) |
Travel time to work
Percentage of workers working in this county: 72.6%
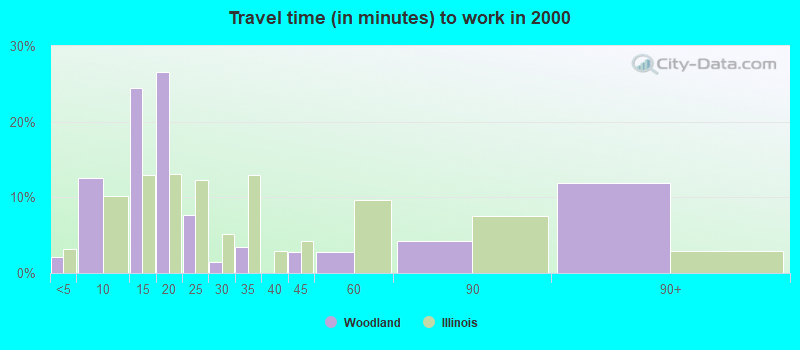
Less than 5 minutes:
| Woodland: | 2.1% (3) |
| Illinois: | 3.2% (183,600) |
5 to 9 minutes:
| Woodland: | 12.6% (18) |
| Illinois: | 10.2% (587,746) |
10 to 14 minutes:
| Woodland: | 24.5% (35) |
| Illinois: | 12.9% (743,149) |
15 to 19 minutes:
| Woodland: | 26.6% (38) |
| Illinois: | 13.0% (748,578) |
20 to 24 minutes:
| Woodland: | 7.7% (11) |
| Illinois: | 12.2% (703,743) |
25 to 29 minutes:
| Woodland: | 1.4% (2) |
| Illinois: | 5.2% (298,361) |
30 to 34 minutes:
| Woodland: | 3.5% (5) |
| Illinois: | 12.9% (741,188) |
40 to 44 minutes:
| Woodland: | 2.8% (4) |
| Illinois: | 4.3% (244,350) |
45 to 59 minutes:
| Woodland: | 2.8% (4) |
| Illinois: | 9.6% (551,290) |
60 to 89 minutes:
| Woodland: | 4.2% (6) |
| Illinois: | 7.5% (432,921) |
90 or more minutes:
| Woodland: | 11.9% (17) |
| Illinois: | 2.9% (168,793) |
Means of transportation to work
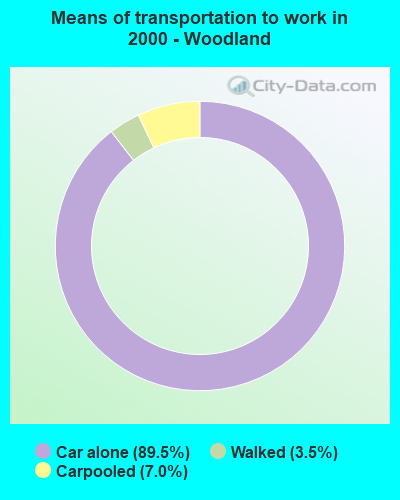
Drove car alone:
| Woodland: | 89.5% (128) |
| Illinois: | 73.2% (4,207,339) |
Carpooled:
| Woodland: | 7.0% (10) |
| Illinois: | 10.9% (625,411) |
Walked:
| Woodland: | 3.5% (5) |
| Illinois: | 3.1% (180,119) |
Private vehicle occupancy
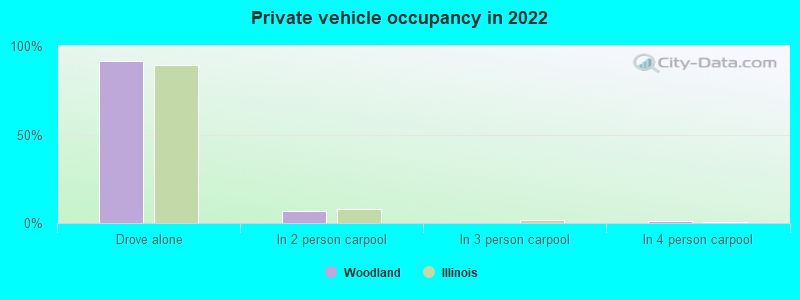
Drove alone:
| Woodland: | 91.8% (94) |
| Illinois: | 89.3% (4,089,987) |
In 2 person carpool:
| Woodland: | 6.9% (7) |
| Illinois: | 7.9% (361,887) |
In 4 person carpool:
| Woodland: | 1.1% (1) |
| Illinois: | 0.7% (31,281) |
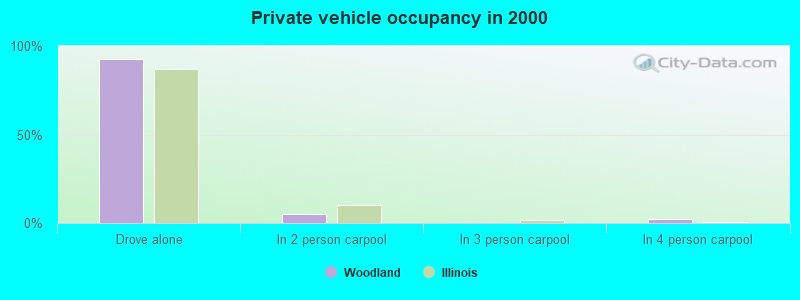
Drove alone:
| Woodland: | 92.8% (128) |
| Illinois: | 87.1% (4,207,339) |
In 2 person carpool:
| Woodland: | 5.1% (7) |
| Illinois: | 10.0% (484,652) |
In 4 person carpool:
| Woodland: | 2.2% (3) |
| Illinois: | 0.6% (30,865) |
Class of workers
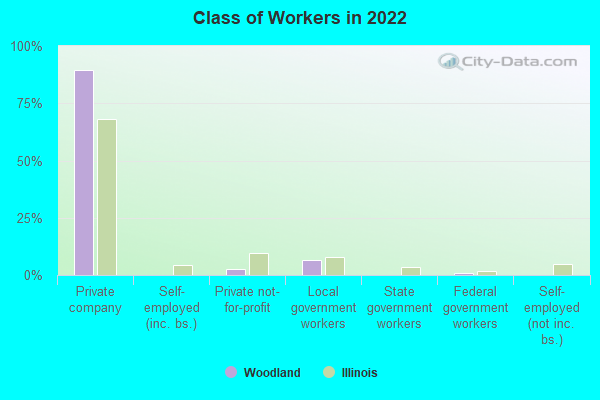
Employee of private company:
| Woodland: | 89.6% (95) |
| Illinois: | 68.3% (4,298,982) |
Private not-for-profit wage and salary workers:
| Woodland: | 2.8% (3) |
| Illinois: | 9.5% (597,909) |
Local government workers:
| Woodland: | 6.6% (7) |
| Illinois: | 7.8% (491,805) |
Federal government workers:
| Woodland: | 0.9% (1) |
| Illinois: | 1.9% (122,680) |
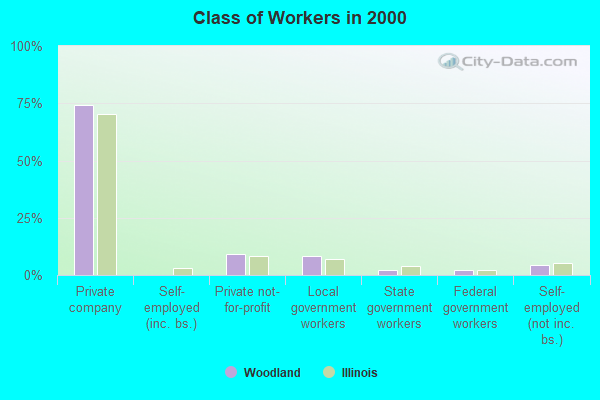
Employee of private company:
| Woodland: | 74.1% (106) |
| Illinois: | 70.3% (4,102,786) |
Private not-for-profit wage and salary workers:
| Woodland: | 9.1% (13) |
| Illinois: | 8.3% (484,163) |
Local government workers:
| Woodland: | 8.4% (12) |
| Illinois: | 6.8% (395,132) |
State government workers:
| Woodland: | 2.1% (3) |
| Illinois: | 3.8% (220,995) |
Federal government workers:
| Woodland: | 2.1% (3) |
| Illinois: | 2.1% (121,776) |
Self-employed workers in own not incorporated business:
| Woodland: | 4.2% (6) |
| Illinois: | 5.3% (307,691) |
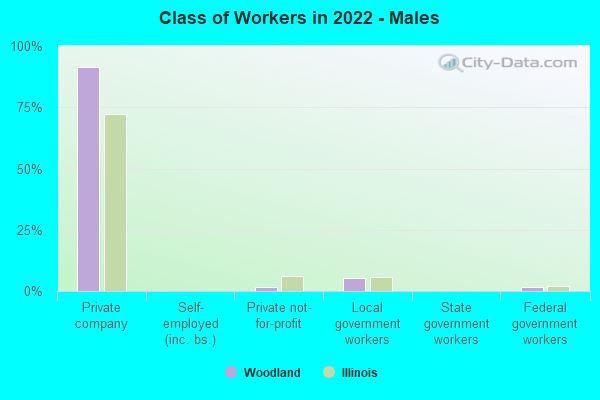
Employee of private company - Males:
| Woodland: | 91.2% (52) |
| Illinois: | 72.3% (2,390,375) |
Private not-for-profit wage and salary workers - Males:
| Woodland: | 1.8% (1) |
| Illinois: | 6.2% (205,628) |
Local government workers - Males:
| Woodland: | 5.3% (3) |
| Illinois: | 5.9% (193,630) |
Federal government workers - Males:
| Woodland: | 1.8% (1) |
| Illinois: | 2.0% (64,842) |
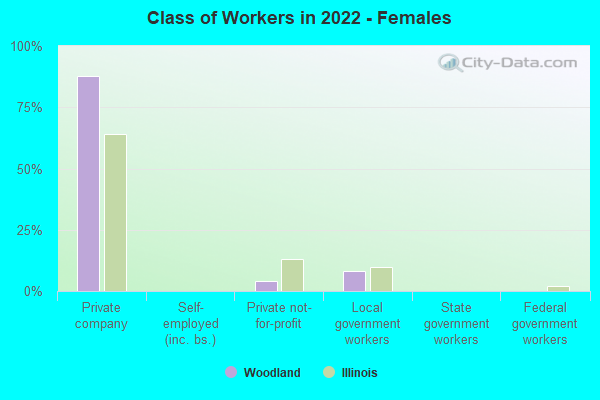
Employee of private company - Females:
| Woodland: | 87.8% (43) |
| Illinois: | 63.9% (1,908,607) |
Private not-for-profit wage and salary workers - Females:
| Woodland: | 4.1% (2) |
| Illinois: | 13.1% (392,281) |
Local government workers - Females:
| Woodland: | 8.2% (4) |
| Illinois: | 10.0% (298,175) |