Work and Jobs in Yoder, Oregon (OR) Detailed Stats
Occupations, Industries, Unemployment, Workers, Commute
The most common industries in Yoder are: Agriculture, forestry, fishing & hunting (13.0% of civilian employees), Health care (8.4% of civilian employees), Construction (7.4% of civilian employees). 60.6% of workers are employees of private companies, which is 7.3% less than the rate of 65.1% across the entire state of Oregon.
Most common industries
Most common industries | |||
|---|---|---|---|
Industry | All | Males | Females |
| Agriculture, forestry, fishing and hunting | 13.0% (410) | 18.0% (312) | 6.9% (98) |
| Health care | 8.4% (264) | 2.9% (51) | 15.0% (213) |
| Construction | 7.4% (234) | 12.4% (215) | 1.3% (19) |
| Educational services | 7.4% (234) | 2.0% (35) | 14.0% (199) |
| Administrative and support and waste management services | 5.0% (157) | 5.3% (92) | 4.6% (65) |
| Public administration | 3.8% (121) | 4.6% (79) | 3.0% (42) |
| Professional, scientific, and technical services | 3.5% (112) | 3.4% (59) | 3.7% (53) |
| Finance and insurance | 2.8% (89) | 0.5% (8) | 5.7% (81) |
| Other transportation, and support activities, and couriers | 2.8% (88) | 3.1% (53) | 2.5% (35) |
| Accommodation and food services | 2.7% (85) | 2.2% (38) | 3.3% (47) |
| Real estate and rental and leasing | 2.6% (82) | 1.2% (20) | 4.4% (62) |
| Food | 2.3% (72) | 3.5% (60) | 0.8% (12) |
| Paper | 1.8% (57) | 2.4% (42) | 1.1% (15) |
| Wood products | 1.7% (55) | 1.9% (33) | 1.5% (22) |
| Utilities | 1.6% (49) | 1.3% (23) | 1.8% (26) |
| Miscellaneous nondurable goods merchant wholesalers | 1.4% (44) | 0.5% (9) | 2.5% (35) |
| Electrical equipment, appliances, and components | 1.4% (44) | 1.6% (27) | 1.2% (17) |
| Transportation equipment | 1.4% (43) | 2.0% (34) | 0.6% (9) |
| Printing and related support activities | 1.4% (43) | 1.2% (21) | 1.5% (22) |
| Food and beverage stores | 1.2% (39) | 1.7% (30) | 0.6% (9) |
| Motor vehicle and parts dealers | 1.2% (39) | 1.2% (21) | 1.3% (18) |
| Repair and maintenance | 1.2% (38) | 2.2% (38) | 0.0% (0) |
| Machinery | 1.2% (38) | 2.2% (38) | 0.0% (0) |
| Metal and metal products | 1.2% (37) | 2.0% (35) | 0.1% (2) |
| Computer and electronic products | 1.1% (35) | 0.3% (5) | 2.1% (30) |
| Department and other general merchandise stores | 1.1% (35) | 0.4% (7) | 2.0% (28) |
| Other direct selling establishments | 1.1% (34) | 0.2% (3) | 2.2% (31) |
| Building material and garden equipment and supplies dealers | 1.0% (33) | 1.6% (28) | 0.4% (5) |
| Groceries and related products merchant wholesalers | 1.0% (32) | 1.8% (32) | 0.0% (0) |
| Religious, grantmaking, civic, professional, and similar organizations | 1.0% (31) | 1.3% (23) | 0.6% (8) |
| Personal and laundry services | 1.0% (30) | 0.9% (16) | 1.0% (14) |
| Broadcasting and telecommunications | 0.9% (28) | 1.0% (18) | 0.7% (10) |
| Used merchandise, gift, novelty, and souvenir, and other miscellaneous stores | 0.8% (24) | 0.0% (0) | 1.7% (24) |
| Miscellaneous manufacturing | 0.8% (24) | 0.9% (15) | 0.6% (9) |
| Lumber and other construction materials merchant wholesalers | 0.7% (22) | 1.3% (22) | 0.0% (0) |
| Pharmacies and drug stores | 0.7% (22) | 0.6% (11) | 0.8% (11) |
| Private households | 0.6% (20) | 0.0% (0) | 1.4% (20) |
| Air transportation | 0.6% (19) | 0.5% (8) | 0.8% (11) |
| Chemicals | 0.5% (17) | 1.0% (17) | 0.0% (0) |
| Furniture and related product manufacturing | 0.5% (16) | 0.7% (13) | 0.2% (3) |
| Truck transportation | 0.5% (16) | 0.9% (16) | 0.0% (0) |
| Health and personal care, except drug, stores | 0.5% (16) | 0.5% (8) | 0.6% (8) |
| Plastics and rubber products | 0.5% (16) | 0.9% (16) | 0.0% (0) |
| U. S. Postal service | 0.5% (15) | 0.7% (13) | 0.1% (2) |
| Nonmetallic mineral products | 0.4% (14) | 0.8% (14) | 0.0% (0) |
| Social assistance | 0.4% (14) | 0.0% (0) | 1.0% (14) |
| Gasoline stations | 0.4% (13) | 0.7% (12) | 0.1% (1) |
| Clothing and accessories, including shoe, stores | 0.4% (12) | 0.0% (0) | 0.8% (12) |
| Machinery, equipment, and supplies merchant wholesalers | 0.4% (12) | 0.5% (9) | 0.2% (3) |
| Recyclable material merchant wholesalers | 0.3% (11) | 0.5% (8) | 0.2% (3) |
| Farm supplies merchant wholesalers | 0.3% (11) | 0.6% (11) | 0.0% (0) |
| Publishing, and motion picture and sound recording industries | 0.3% (10) | 0.2% (3) | 0.5% (7) |
| Warehousing and storage | 0.3% (10) | 0.0% (0) | 0.7% (10) |
| Leather and allied products | 0.3% (9) | 0.0% (0) | 0.6% (9) |
| Office supplies and stationery stores | 0.3% (9) | 0.5% (9) | 0.0% (0) |
| Electronic shopping and mail-order houses | 0.3% (9) | 0.0% (0) | 0.6% (9) |
| Data processing, libraries, and other information services | 0.3% (9) | 0.0% (0) | 0.6% (9) |
| Furniture and home furnishing merchant wholesalers | 0.3% (8) | 0.0% (0) | 0.6% (8) |
| Motor vehicles, parts and supplies merchant wholesalers | 0.2% (7) | 0.4% (7) | 0.0% (0) |
| Alcoholic beverages merchant wholesalers | 0.2% (7) | 0.4% (7) | 0.0% (0) |
| Furniture and home furnishings, and household appliance stores | 0.2% (6) | 0.0% (0) | 0.4% (6) |
| Arts, entertainment, and recreation | 0.2% (6) | 0.0% (0) | 0.4% (6) |
| Hardware, plumbing and heating equipment, and supplies merchant wholesalers | 0.2% (6) | 0.0% (0) | 0.4% (6) |
| Management of companies and enterprises | 0.2% (5) | 0.3% (5) | 0.0% (0) |
| Sporting goods, camera, and hobby and toy stores | 0.1% (4) | 0.2% (4) | 0.0% (0) |
| Mining, quarrying, and oil and gas extraction | 0.1% (2) | 0.1% (2) | 0.0% (0) |
Unemployment in Yoder
- Unemployment by race in 2000
- Unemployment rate for White non-Hispanic residents
- 5.1%Males
- 3.1%Females
- Unemployment rate for other race residents
- 10.9%Males
- 20.8%Females
- Unemployment rate for Hispanic or Latino residents
- 4.7%Males
- 7.6%Females
Time leaving home to go to work
<5am:
| Yoder: | 4.4% (137) |
| Oregon: | 3.7% (58,821) |
5:30am:
| Yoder: | 3.3% (103) |
| Oregon: | 2.8% (44,872) |
6am:
| Yoder: | 8.3% (255) |
| Oregon: | 4.4% (71,163) |
6:30am:
| Yoder: | 10.8% (332) |
| Oregon: | 7.7% (122,707) |
7am:
| Yoder: | 9.7% (300) |
| Oregon: | 10.3% (165,185) |
7:30am:
| Yoder: | 13.4% (413) |
| Oregon: | 13.9% (222,209) |
8am:
| Yoder: | 13.6% (420) |
| Oregon: | 15.3% (245,415) |
8:30am:
| Yoder: | 6.7% (206) |
| Oregon: | 9.8% (156,781) |
9am:
| Yoder: | 4.5% (139) |
| Oregon: | 4.9% (78,436) |
10am:
| Yoder: | 4.1% (125) |
| Oregon: | 5.5% (88,783) |
11am:
| Yoder: | 1.2% (37) |
| Oregon: | 2.6% (41,539) |
12pm:
| Yoder: | 0.7% (22) |
| Oregon: | 1.3% (20,765) |
4pm:
| Yoder: | 4.5% (138) |
| Oregon: | 6.8% (108,927) |
>4pm:
| Yoder: | 3.4% (105) |
| Oregon: | 6.0% (95,989) |
Travel time to work
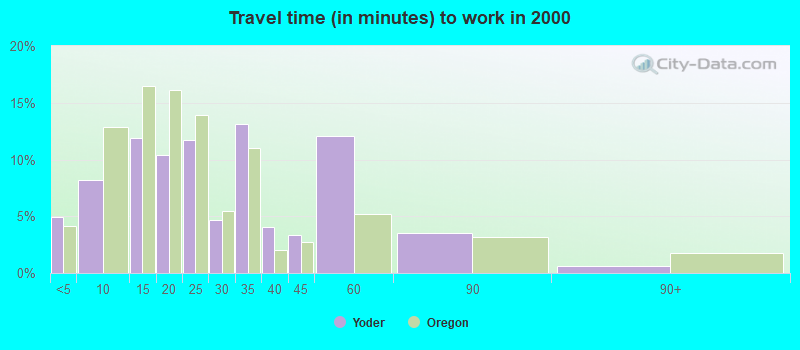
Less than 5 minutes:
| Yoder: | 5.0% (153) |
| Oregon: | 4.1% (66,369) |
5 to 9 minutes:
| Yoder: | 8.2% (254) |
| Oregon: | 12.9% (206,168) |
10 to 14 minutes:
| Yoder: | 11.9% (367) |
| Oregon: | 16.5% (263,466) |
15 to 19 minutes:
| Yoder: | 10.4% (320) |
| Oregon: | 16.1% (258,476) |
20 to 24 minutes:
| Yoder: | 11.7% (361) |
| Oregon: | 13.9% (223,370) |
25 to 29 minutes:
| Yoder: | 4.6% (143) |
| Oregon: | 5.4% (87,147) |
30 to 34 minutes:
| Yoder: | 13.1% (404) |
| Oregon: | 11.0% (176,763) |
35 to 39 minutes:
| Yoder: | 4.0% (124) |
| Oregon: | 2.0% (32,680) |
40 to 44 minutes:
| Yoder: | 3.4% (104) |
| Oregon: | 2.7% (43,262) |
45 to 59 minutes:
| Yoder: | 12.1% (372) |
| Oregon: | 5.2% (83,858) |
60 to 89 minutes:
| Yoder: | 3.6% (110) |
| Oregon: | 3.2% (51,318) |
90 or more minutes:
| Yoder: | 0.6% (20) |
| Oregon: | 1.8% (28,715) |
Means of transportation to work
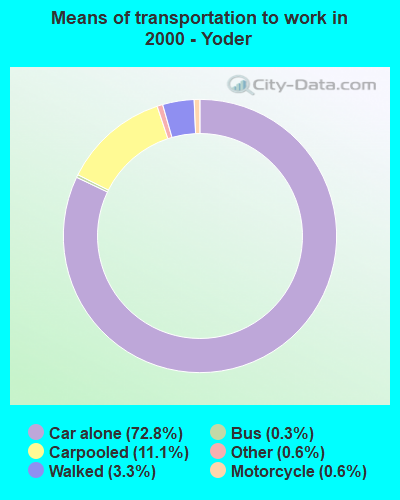

Drove car alone:
| Yoder: | 72.8% (2,244) |
| Oregon: | 73.2% (1,171,641) |
Carpooled:
| Yoder: | 11.1% (342) |
| Oregon: | 12.2% (195,950) |
Bus or trolley bus:
| Yoder: | 0.3% (8) |
| Oregon: | 3.5% (56,795) |
Motorcycle:
| Yoder: | 0.6% (19) |
| Oregon: | 0.1% (1,942) |
Walked:
| Yoder: | 3.3% (101) |
| Oregon: | 3.6% (57,217) |
Other means:
| Yoder: | 0.6% (18) |
| Oregon: | 0.7% (10,882) |
Private vehicle occupancy
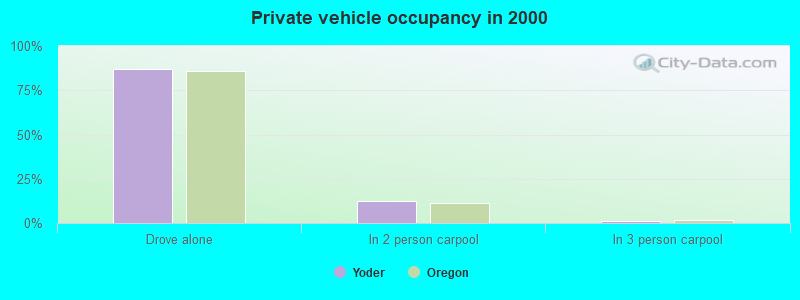
Drove alone:
| Yoder: | 86.8% (2,244) |
| Oregon: | 85.7% (1,171,641) |
In 2 person carpool:
| Yoder: | 12.3% (319) |
| Oregon: | 11.5% (156,754) |
In 3 person carpool:
| Yoder: | 0.9% (23) |
| Oregon: | 1.9% (25,457) |
Class of workers
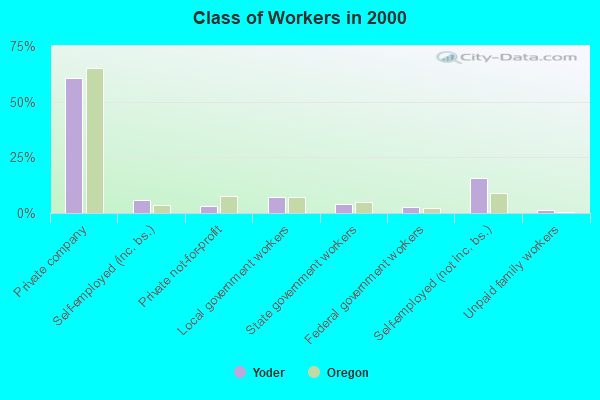
Employee of private company:
| Yoder: | 60.6% (1,913) |
| Oregon: | 65.1% (1,059,139) |
Self-employed in own incorporated business:
| Yoder: | 6.0% (188) |
| Oregon: | 3.8% (61,386) |
Private not-for-profit wage and salary workers:
| Yoder: | 3.0% (96) |
| Oregon: | 7.4% (120,839) |
Local government workers:
| Yoder: | 7.1% (224) |
| Oregon: | 7.2% (116,733) |
State government workers:
| Yoder: | 3.8% (121) |
| Oregon: | 5.0% (81,804) |
Federal government workers:
| Yoder: | 2.6% (83) |
| Oregon: | 2.2% (36,076) |
Self-employed workers in own not incorporated business:
| Yoder: | 15.7% (494) |
| Oregon: | 8.9% (145,020) |
Unpaid family workers:
| Yoder: | 1.1% (36) |
| Oregon: | 0.4% (6,772) |
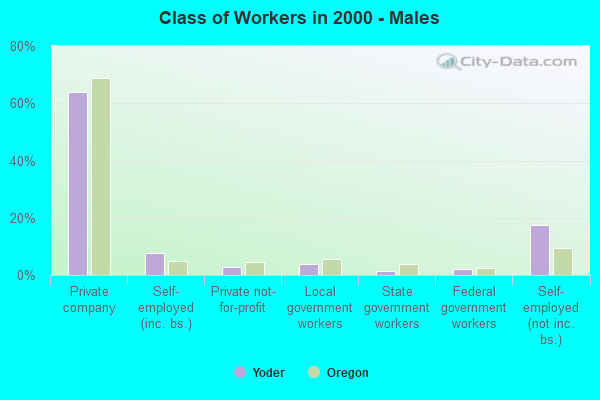
Employee of private company - Males:
| Yoder: | 64.0% (1,110) |
| Oregon: | 68.9% (605,246) |
Self-employed in own incorporated business - Males:
| Yoder: | 7.8% (135) |
| Oregon: | 5.0% (44,188) |
Private not-for-profit wage and salary workers - Males:
| Yoder: | 2.7% (47) |
| Oregon: | 4.5% (39,938) |
Local government workers - Males:
| Yoder: | 3.9% (68) |
| Oregon: | 5.6% (49,371) |
State government workers - Males:
| Yoder: | 1.5% (26) |
| Oregon: | 3.9% (33,917) |
Federal government workers - Males:
| Yoder: | 2.1% (37) |
| Oregon: | 2.3% (20,185) |
Self-employed workers in own not incorporated business - Males:
| Yoder: | 17.6% (306) |
| Oregon: | 9.4% (82,902) |
Unpaid family workers - Males:
| Yoder: | 0.3% (6) |
| Oregon: | 0.3% (2,982) |
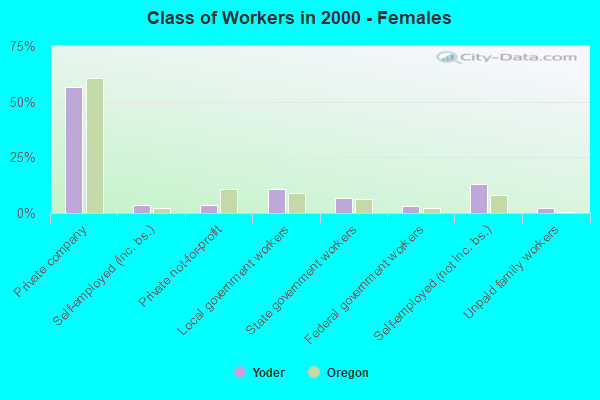
Employee of private company - Females:
| Yoder: | 56.5% (803) |
| Oregon: | 60.6% (453,893) |
Self-employed in own incorporated business - Females:
| Yoder: | 3.7% (53) |
| Oregon: | 2.3% (17,198) |
Private not-for-profit wage and salary workers - Females:
| Yoder: | 3.5% (49) |
| Oregon: | 10.8% (80,901) |
Local government workers - Females:
| Yoder: | 11.0% (156) |
| Oregon: | 9.0% (67,362) |
State government workers - Females:
| Yoder: | 6.7% (95) |
| Oregon: | 6.4% (47,887) |
Federal government workers - Females:
| Yoder: | 3.2% (46) |
| Oregon: | 2.1% (15,891) |
Self-employed workers in own not incorporated business - Females:
| Yoder: | 13.2% (188) |
| Oregon: | 8.3% (62,118) |
Unpaid family workers - Females:
| Yoder: | 2.1% (30) |
| Oregon: | 0.5% (3,790) |