Estimated zip code population in 2022: 8,139 Zip code population in 2010: 7,989 Zip code population in 2000: 8,738
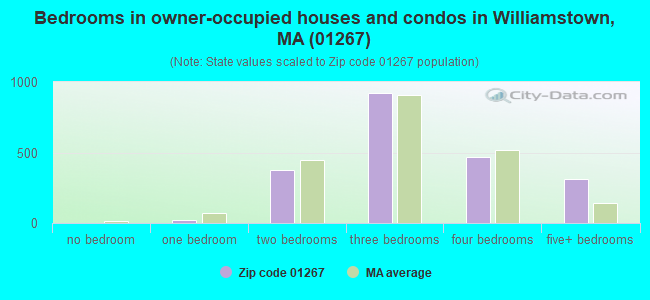
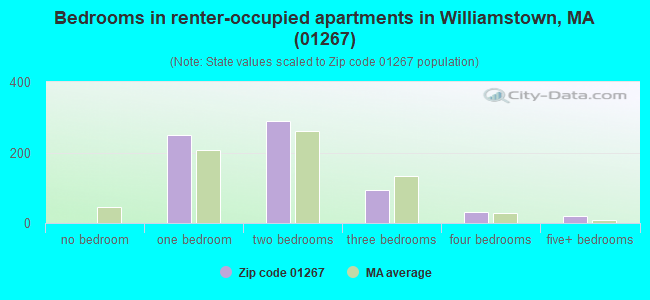
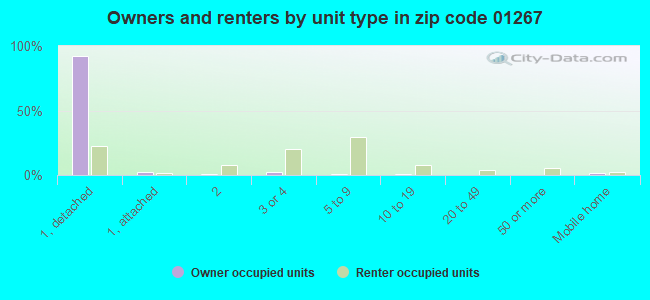
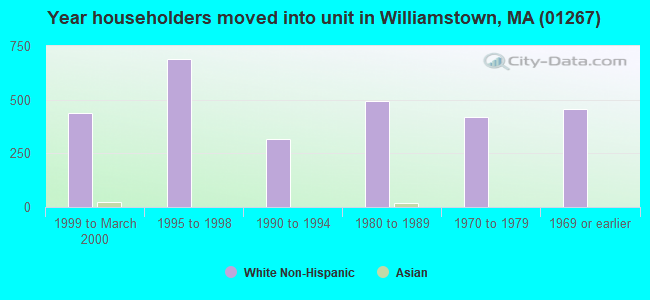
Houses and condos: 3,567 Renter-occupied apartments: 684
% of renters here:
25%
State:
38%
March 2022 cost of living index in zip code 01267: 106.6 (more than average, U.S. average is 100)
Land area: 54.6 sq. mi. Water area: 0.1 sq. mi.
Population density: 149 people per square mile
(very low).
OSM Map
Google Map
MSN Map
OSM Map
General Map
Google Map
MSN Map
OSM Map
Google Map
MSN Map
OSM Map
Google Map
MSN Map
Please wait while loading the map...
Real estate property taxes paid for housing units in 2022:
This zip code:
1.1% ($5,096)
Massachusetts:
1.0% ($5,536)
Median real estate property taxes paid for housing units with mortgages in 2022: $5,286 (1.2%) Median real estate property taxes paid for housing units with no mortgage in 2022: $4,898 (1.2%)
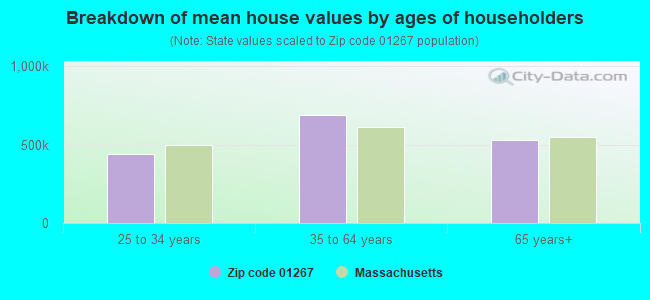
Estimated median house/condo value in 2022: $447,517
01267:
$447,517
Massachusetts:
$534,700
According to our research of Massachusetts and other state lists, there were 3 registered sex offenders living in 01267 zip code as of April 27, 2024. The ratio of all residents to sex offenders in zip code 01267 is 2,653 to 1. The ratio of registered sex offenders to all residents in this zip code is lower than the state average.
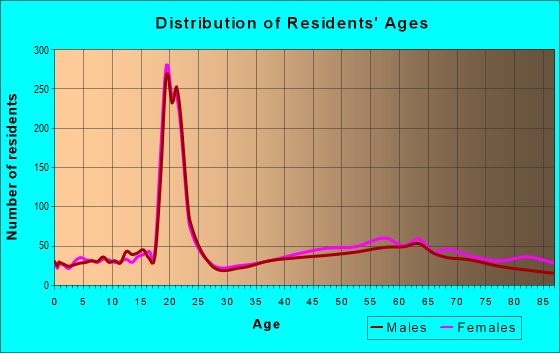
Median resident age:
This zip code:
34.5 years
Massachusetts median age:
40.3 years
Average household size:
This zip code:
2.1 people
Massachusetts:
2.4 people
Averages for the 2020 tax year for zip code 01267, filed in 2021:
Average Adjusted Gross Income (AGI) in 2020: $123,016 (Individual Income Tax Returns)
Here:
$123,016
State:
$105,130
Salary/wage: $83,989 (reported on 73.0% of returns)
Here:
$83,989
State:
$82,951
(% of AGI for various income ranges: 1104.3% for AGIs below $25k, 3346.2% for AGIs $25k-50k, 5921.8% for AGIs $50k-75k, 8134.2% for AGIs $75k-100k, 16699.4% for AGIs $100k-200k, 89538.9% for AGIs over 200k)
Taxable interest for individuals: $2,289 (reported on 53.4% of returns)
This zip code:
$2,289
Massachusetts:
$2,361
(% of AGI for various income ranges: 32.7% for AGIs below $25k, 63.5% for AGIs $25k-50k, 107.3% for AGIs $50k-75k, 131.1% for AGIs $75k-100k, 304.2% for AGIs $100k-200k, 1943.3% for AGIs over 200k)
Ordinary dividends: $14,133 (reported on 42.2% of returns)
Here:
$14,133
State:
$10,365
(% of AGI for various income ranges: 122.5% for AGIs below $25k, 182.7% for AGIs $25k-50k, 419.1% for AGIs $50k-75k, 426.8% for AGIs $75k-100k, 1226.4% for AGIs $100k-200k, 11856.7% for AGIs over 200k)
Net capital gain/loss in AGI: +$43,543 (reported on 36.1% of returns)
Here:
+$43,543
State:
+$48,178
(% of AGI for various income ranges: 58.4% for AGIs below $25k, 134.3% for AGIs $25k-50k, 219.5% for AGIs $50k-75k, 571.1% for AGIs $75k-100k, 1385.2% for AGIs $100k-200k, 44108.9% for AGIs over 200k)
Profit/loss from business: +$26,837 (reported on 21.3% of returns)
Here:
+$26,837
State:
+$20,792
(% of AGI for various income ranges: 111.8% for AGIs below $25k, 290.5% for AGIs $25k-50k, 374.1% for AGIs $50k-75k, 640.0% for AGIs $75k-100k, 876.7% for AGIs $100k-200k, 11564.4% for AGIs over 200k)
Taxable individual retirement arrangement distribution: $27,251 (reported on 15.9% of returns)
01267:
$27,251
Massachusetts:
$22,790
(% of AGI for various income ranges: 85.5% for AGIs below $25k, 157.8% for AGIs $25k-50k, 355.0% for AGIs $50k-75k, 559.5% for AGIs $75k-100k, 1527.3% for AGIs $100k-200k, 5515.6% for AGIs over 200k)
Self-employed (Keogh) retirement plans: $31,100 (reported on 2.4% of returns)
01267:
$31,100
Massachusetts:
$26,868
(% of AGI for various income ranges: 219.1% for AGIs $50k-75k, 1883.3% for AGIs over 200k)
Total itemized deductions: $40,264 (reported on 14.2% of returns)
Here:
$40,264
State:
$36,722
(% of AGI for various income ranges: 87.5% for AGIs below $25k, 155.1% for AGIs $25k-50k, 503.6% for AGIs $50k-75k, 532.1% for AGIs $75k-100k, 1309.4% for AGIs $100k-200k, 10568.9% for AGIs over 200k)
Charity contributions: $17,178 (reported on 12.2% of returns)
Here:
$17,178
State:
$12,529
(% of AGI for various income ranges: 31.6% for AGIs $25k-50k, 42.3% for AGIs $50k-75k, 80.5% for AGIs $75k-100k, 213.3% for AGIs $100k-200k, 5685.6% for AGIs over 200k)
Taxes paid: $8,886 (reported on 14.2% of returns)
01267:
$8,886
State:
$8,782
(% of AGI for various income ranges: 24.5% for AGIs below $25k, 49.2% for AGIs $25k-50k, 141.8% for AGIs $50k-75k, 214.7% for AGIs $75k-100k, 367.0% for AGIs $100k-200k, 1678.9% for AGIs over 200k)
Earned income credit: $1,541 (reported on 5.7% of returns)
Here:
$1,541
State:
$1,909
(% of AGI for various income ranges: 36.6% for AGIs below $25k, 27.3% for AGIs $25k-50k)
Percentage of individuals using paid preparers for their 2020 taxes: 92.9%
Here:
93%
State:
92%
(% for various income ranges: 92.1% for AGIs below $25k, 92.3% for AGIs $25k-50k, 91.7% for AGIs $50k-75k, 93.3% for AGIs $75k-100k, 95.3% for AGIs $100k-200k, 92.1% for AGIs over 200k)
Averages for the 2012 tax year for zip code 01267, filed in 2013:
Average Adjusted Gross Income (AGI) in 2012: $89,601 (Individual Income Tax Returns)
Here:
$89,601
State:
$81,425
Salary/wage: $66,171 (reported on 76.9% of returns)
Here:
$66,171
State:
$64,752
(% of AGI for various income ranges: 66.5% for AGIs below $25k, 66.5% for AGIs $25k-50k, 65.5% for AGIs $50k-75k, 63.9% for AGIs $75k-100k, 65.7% for AGIs $100k-200k, 45.4% for AGIs over 200k)
Taxable interest for individuals: $2,648 (reported on 53.7% of returns)
This zip code:
$2,648
Massachusetts:
$2,136
(% of AGI for various income ranges: 2.3% for AGIs below $25k, 1.4% for AGIs $25k-50k, 1.5% for AGIs $50k-75k, 1.3% for AGIs $75k-100k, 1.5% for AGIs $100k-200k, 1.7% for AGIs over 200k)
Ordinary dividends: $13,278 (reported on 40.8% of returns)
Here:
$13,278
State:
$9,473
(% of AGI for various income ranges: 6.0% for AGIs below $25k, 2.9% for AGIs $25k-50k, 5.3% for AGIs $50k-75k, 4.1% for AGIs $75k-100k, 4.4% for AGIs $100k-200k, 8.2% for AGIs over 200k)
Net capital gain/loss in AGI: +$20,458 (reported on 31.6% of returns)
Here:
+$20,458
State:
+$31,437
(% of AGI for various income ranges: 0.4% for AGIs below $25k, 1.1% for AGIs $25k-50k, 0.6% for AGIs $50k-75k, 0.7% for AGIs $75k-100k, 2.6% for AGIs $100k-200k, 14.5% for AGIs over 200k)
Profit/loss from business: +$20,009 (reported on 22.8% of returns)
Here:
+$20,009
State:
+$20,662
(% of AGI for various income ranges: 7.2% for AGIs below $25k, 2.7% for AGIs $25k-50k, 4.7% for AGIs $50k-75k, 3.8% for AGIs $75k-100k, 4.8% for AGIs $100k-200k, 5.8% for AGIs over 200k)
Taxable individual retirement arrangement distribution: $24,414 (reported on 16.7% of returns)
01267:
$24,414
Massachusetts:
$18,892
(% of AGI for various income ranges: 4.7% for AGIs below $25k, 3.6% for AGIs $25k-50k, 3.4% for AGIs $50k-75k, 5.6% for AGIs $75k-100k, 5.4% for AGIs $100k-200k, 4.1% for AGIs over 200k)
Self-employment retirement plans: $22,475 (reported on 2.7% of returns)
01267:
$22,475
Massachusetts:
$20,669
Total itemized deductions: $31,806 (20% of AGI, reported on 44.2% of returns)
Here:
$31,806
State:
$28,907
Here:
19.9% of AGI
State:
18.2% of AGI
(% of AGI for various income ranges: 18.2% for AGIs below $25k, 10.9% for AGIs $25k-50k, 13.3% for AGIs $50k-75k, 15.0% for AGIs $75k-100k, 16.5% for AGIs $100k-200k, 16.4% for AGIs over 200k)
Charity contributions: $5,596 (reported on 38.8% of returns)
Here:
$5,596
State:
$4,208
(% of AGI for various income ranges: 1.0% for AGIs below $25k, 0.8% for AGIs $25k-50k, 1.3% for AGIs $50k-75k, 1.8% for AGIs $75k-100k, 2.3% for AGIs $100k-200k, 3.3% for AGIs over 200k)
Taxes paid: $15,334 (reported on 43.9% of returns)
01267:
$15,334
State:
$13,303
(% of AGI for various income ranges: 4.5% for AGIs below $25k, 3.7% for AGIs $25k-50k, 5.2% for AGIs $50k-75k, 6.2% for AGIs $75k-100k, 8.0% for AGIs $100k-200k, 8.9% for AGIs over 200k)
Earned income credit: $1,641 (reported on 7.5% of returns)
Here:
$1,641
State:
$1,971
(% of AGI for various income ranges: 2.6% for AGIs below $25k, 0.5% for AGIs $25k-50k)
Percentage of individuals using paid preparers for their 2012 taxes: 58.2%
Here:
58%
State:
56%
(% for various income ranges: 46.4% for AGIs below $25k, 50.0% for AGIs $25k-50k, 63.4% for AGIs $50k-75k, 66.7% for AGIs $75k-100k, 66.7% for AGIs $100k-200k, 81.5% for AGIs over 200k)
Averages for the 2004 tax year for zip code 01267, filed in 2005:
Average Adjusted Gross Income (AGI) in 2004: $77,341 (Individual Income Tax Returns)
Here:
$77,341
State:
$62,877
Salary/wage: $57,971 (reported on 76.6% of returns)
Here:
$57,971
State:
$52,969
(% of AGI for various income ranges: 207.0% for AGIs below $10k, 61.2% for AGIs $10k-25k, 71.0% for AGIs $25k-50k, 66.6% for AGIs $50k-75k, 64.9% for AGIs $75k-100k, 51.4% for AGIs over 100k)
Taxable interest for individuals: $3,658 (reported on 65.1% of returns)
This zip code:
$3,658
Massachusetts:
$1,945
(% of AGI for various income ranges: 25.7% for AGIs below $10k, 4.0% for AGIs $10k-25k, 2.7% for AGIs $25k-50k, 2.6% for AGIs $50k-75k, 2.4% for AGIs $75k-100k, 3.1% for AGIs over 100k)
Taxable dividends: $8,992 (reported on 44.3% of returns)
Here:
$8,992
State:
$5,323
(% of AGI for various income ranges: 22.2% for AGIs below $10k, 4.8% for AGIs $10k-25k, 3.8% for AGIs $25k-50k, 4.6% for AGIs $50k-75k, 4.8% for AGIs $75k-100k, 5.3% for AGIs over 100k)
Net capital gain/loss: +$18,953 (reported on 36.4% of returns)
Here:
+$18,953
State:
+$20,377
(% of AGI for various income ranges: 24.5% for AGIs below $10k, 1.6% for AGIs $10k-25k, 1.0% for AGIs $25k-50k, 2.3% for AGIs $50k-75k, 2.5% for AGIs $75k-100k, 12.4% for AGIs over 100k)
Profit/loss from business: +$19,596 (reported on 19.2% of returns)
Here:
+$19,596
State:
+$17,837
(% of AGI for various income ranges: 0.1% for AGIs below $10k, 5.4% for AGIs $10k-25k, 2.5% for AGIs $25k-50k, 3.7% for AGIs $50k-75k, 5.0% for AGIs $75k-100k, 5.4% for AGIs over 100k)
Profit/loss from farming: +$375 (reported on 0.5% of returns)
Here:
+$375
State:
-$2,642
IRA payment deduction: $3,089 (reported on 3.8% of returns)
01267:
$3,089
Massachusetts:
$3,100
(% of AGI for various income ranges: 0.8% for AGIs $10k-25k, 0.4% for AGIs $25k-50k, 0.4% for AGIs $50k-75k, 0.1% for AGIs $75k-100k, 0.0% for AGIs over 100k)
Self-employed pension: $15,021 (reported on 3.0% of returns)
Here:
$15,021
Massachusetts:
$14,516
Total itemized deductions: $27,161 (18% of AGI, reported on 41.2% of returns)
Here:
$27,161
State:
$22,573
Here:
17.7% of AGI
State:
19.5% of AGI
(% of AGI for various income ranges: 35.5% for AGIs below $10k, 13.9% for AGIs $10k-25k, 12.5% for AGIs $25k-50k, 13.8% for AGIs $50k-75k, 18.2% for AGIs $75k-100k, 14.1% for AGIs over 100k)
Charity contributions deductions: $6,112 (4% of AGI, reported on 37.9% of returns)
Here:
$6,112
State:
$3,295
Here:
3.8% of AGI
State:
2.7% of AGI
(% of AGI for various income ranges: 1.4% for AGIs below $10k, 1.3% for AGIs $10k-25k, 1.4% for AGIs $25k-50k, 2.0% for AGIs $50k-75k, 2.5% for AGIs $75k-100k, 3.6% for AGIs over 100k)
Total tax: $16,039 (reported on 79.4% of returns)
01267:
$16,039
State:
$11,494
(% of AGI for various income ranges: 6.4% for AGIs below $10k, 4.9% for AGIs $10k-25k, 7.9% for AGIs $25k-50k, 9.6% for AGIs $50k-75k, 10.5% for AGIs $75k-100k, 20.5% for AGIs over 100k)
Earned income credit: $1,291 (reported on 6.2% of returns)
Here:
$1,291
State:
$1,518
Percentage of individuals using paid preparers for their 2004 taxes: 59.1%
Here:
59%
State:
58%
(% for various income ranges: 45.7% for AGIs below $10k, 55.2% for AGIs $10k-25k, 56.9% for AGIs $25k-50k, 64.4% for AGIs $50k-75k, 65.5% for AGIs $75k-100k, 75.9% for AGIs over 100k)
Household received Food Stamps/SNAP in the past 12 months: 194 Household did not receive Food Stamps/SNAP in the past 12 months: 2,552
Women who had a birth in the past 12 months: 54 (32 now married, 20 unmarried) Women who did not have a birth in the past 12 months: 2,186 (400 now married, 1,810 unmarried)
Housing units in zip code 01267 with a mortgage: 1,108 (286 second mortgage, 221 both second mortgage and home equity loan) Houses without a mortgage: 57
Median monthly owner costs for units with a mortgage: $2,177 Median monthly owner costs for units without a mortgage: $872
Residents with income below the poverty level in 2022:
This zip code:
11.2%
Whole state:
10.4%
Residents with income below 50% of the poverty level in 2022:
This zip code:
4.8%
Whole state:
5.1%
Median number of rooms in houses and condos:
Here:
6.9
State:
6.5
Median number of rooms in apartments:
Here:
4.1
State:
4.0
Notable locations in this zip code not listed on our city pages
Notable locations in zip code 01267: Bacons Farm (A), Haskin Farm (B), Taconic Golf Course (C), Waubeeka Springs Golf Course (D), Green River Farms (E), Williams College Ski Area (F), Mount Greylock Ski Club (G), Mount Hope Farm (H), Camp Muriel Flagg (I), Williamstown Municipal Building (J), Village Ambulance Service (K), Hancock Fire Department Station 1 Headquarters (L), Williams College Libraries (M), David and Joyce Milne Public Library (N), Bruce R Carlson Library (O), Williamstown House of Local History (P), Sterling and Francine Clark Art Institute (Q), Sweet Brook Nursing Home (R), Adams Memorial Theatre (S), Adams Nursing HOme (T). Display/hide their locations on the map
Churches in zip code 01267 include: First United Methodist Church (A), First Congregational Church (B), First Baptist Church (C), Congregational Church (D), Community Bible Church (E), Carmelite Novitiate (F), Thompson Memorial Chapel (G), Second Congregational Church (H), Saint Raphaels Roman Catholic Church (I). Display/hide their locations on the map
Cemeteries: Gardner Cemetery (1), Southlawn Cemetery (2), Hancock Cemetery (3), College Cemetery (4), Eastlawn Cemetery (5). Display/hide their locations on the map
Streams, rivers, and creeks: Ford Glen Brook (A), Flora Glen Brook (B), Birch Hill Brook (C), Goodell Brook (D), Phoebes Brook (E), Whitman Brook (F), Sweet Brook (G), Roaring Brook (H), Rathburn Brook (I). Display/hide their locations on the map
Parks in zip code 01267 include: Linear Park (1), Mill Village Historic District (2), Mount Hope Park (3), Taconic Trail State Park (4), Forbush Wildlife Sanctuary (5), Blair Hiking Area (6), Buxton Gardens (7), Denison Park (8), Field Park (9). Display/hide their locations on the map
665 married couples with children.
253 single-parent households (62 men, 191 women).
88.5% of residents of 01267 zip code speak English at home.
1.2% of residents speak Spanish at home (96% very well, 1% not well, 3% not at all).
5.3% of residents speak other Indo-European language at home (93% very well, 7% well).
2.9% of residents speak Asian or Pacific Island language at home (96% very well, 4% well).
2.2% of residents speak other language at home (100% very well).
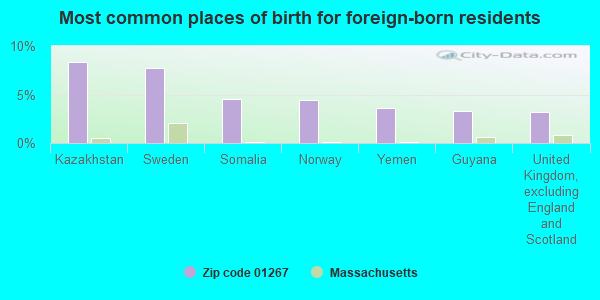
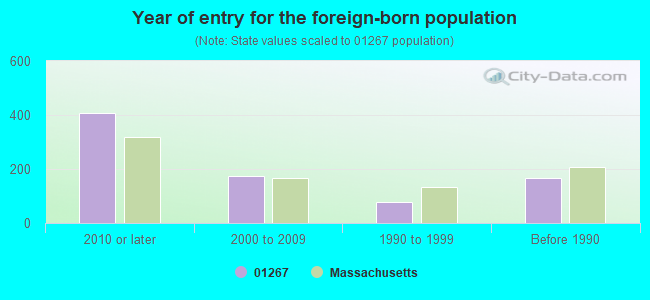
Foreign born population: 721 (8.9%) (46.9% of them are naturalized citizens)
This zip code:
8.9%
Whole state:
18.0%
8%Kazakhstan
8%Sweden
5%Somalia
4%Norway
4%Yemen
3%Guyana
3%United Kingdom, excluding England and Scotland
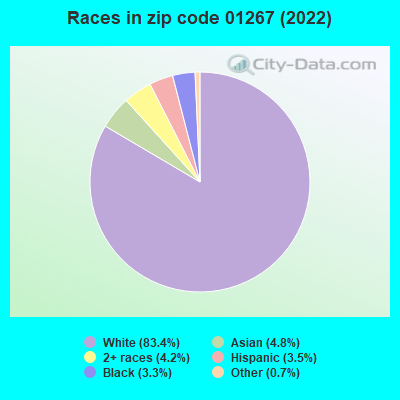
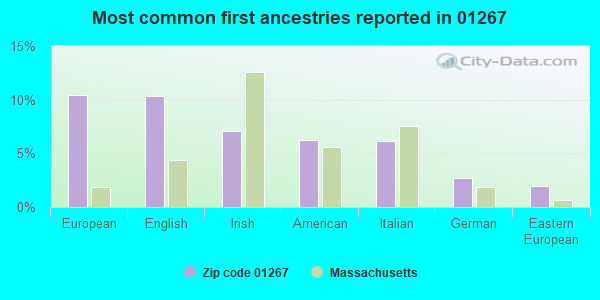
10%European
10%English
7%Irish
6%American
6%Italian
3%German
2%Eastern European
Year of entry for the foreign-born population
4062010 or later
1742000 to 2009
771990 to 1999
167Before 1990
Facilities with environmental interests located in this zip code:
MT GREYLOCK SCHOOL DISTRICT (1781 COLD SPRING ROAD in WILLIAMSTOWN, MA)
AIR MINOR (AIRS/AFS) COMPLIANCE ACTIVITY (Tracking inspections of insecticide, fungicide, and rodenticide, and toxic substances) (National Center for Education Statistics) - STATE ID-715505 CRITERIA AND HAZARDOUS AIR POLLUTANT INVENTORY (Inventory of air pollution sources) Business SIC classification: ELEMENTARY AND SECONDARY SCHOOLS Organizations: MOUNT GREYLOCK (SCHOOL DISTRICT)
Alternative names: MOUNT GREYLOCK REGIONAL HIGH SCHOOL, MT. GREYLOCK REGIONAL H.S., MT. GREYLOCK REGIONAL HIGH SCHOOL, MOUNT GREYLOCK SCH DIST
BICC GENERAL (160 WATER STREET in WILLIAMSTOWN, MA)
AIR MINOR (AIRS/AFS) Conditionally Exempt Small Quantity Generators, less than 100 kg/month of hazardous waste (Resource Conservation and Recovery Act (tracking hazardous waste)) - notification TRI REPORTER (Tracking of toxic chemicals releasing facilities) Business SIC classification: DRAWING AND INSULATING OF NONFERROUS WIRE Organizations: B I C C GENERAL (CONTACT/OWNER)
Alternative names: B I C C GENERAL, CAROL CABLE CO. INC., GENERAL CABLE CORPORATION
BOBS MOBIL STA (259 MAIN ST in WILLIAMSTOWN, MA)
(Resource Conservation and Recovery Act (tracking hazardous waste)) Organizations: ROBERT J BREWER (CONTACT/OWNER)
COMM OF MASS (RTE 7 in WILLIAMSTOWN, MA)
Conditionally Exempt Small Quantity Generators, less than 100 kg/month of hazardous waste (Resource Conservation and Recovery Act (tracking hazardous waste)) - notification Alternative names: COMM OF MA DPW
DRUMMOND CLEANERS INC (66 SPRING ST BOX 652 in WILLIAMSTOWN, MA)
(Resource Conservation and Recovery Act (tracking hazardous waste))
COLE AVENUE DUMP (COLE AVE in WILLIAMSTOWN, MA)
CRITERIA AND HAZARDOUS AIR POLLUTANT INVENTORY (Inventory of air pollution sources) Business SIC classification: REFUSE SYSTEMS Business NAICS classification: SOLID WASTE LANDFILL.
Housing units lacking complete plumbing facilities: 0.7% Housing units lacking complete kitchen facilities: 1.0%
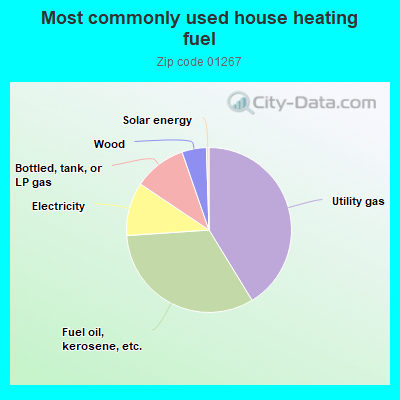
41.3%Utility gas
32.7%Fuel oil, kerosene, etc.
10.5%Electricity
10.3%Bottled, tank, or LP gas
4.8%Wood
0.5%Solar energy
Population in 1990: 8,220. Population change in the 1990s: +518 (+6.3%).
Place of birth for U.S.-born residents:
This state: 2,830
Northeast: 2,410
Midwest: 603
South: 775
West: 794
49% of the 01267 zip code residents lived in the same house 5 years ago. Out of people who lived in different houses, 37% lived in this county. Out of people who lived in different counties, 50% lived in Massachusetts.
87% of the 01267 zip code residents lived in the same house 1 year ago. Out of people who lived in different houses, 38% moved from this county. Out of people who lived in different houses, 28% moved from different county within same state. Out of people who lived in different houses, 32% moved from different state. Out of people who lived in different houses, 2% moved from abroad.
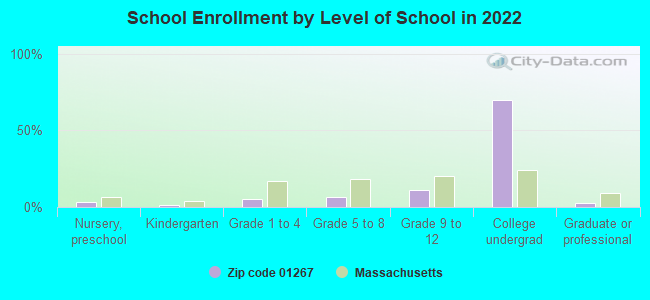
Private vs. public school enrollment:
Students in private schools in grades 1 to 8 (elementary and middle school): 16
Here:
4.2%
Massachusetts:
10.3%
Students in private schools in grades 9 to 12 (high school): 73
Here:
20.2%
Massachusetts:
12.3%
Students in private undergraduate colleges: 1,732
Here:
74.7%
Massachusetts:
51.2%
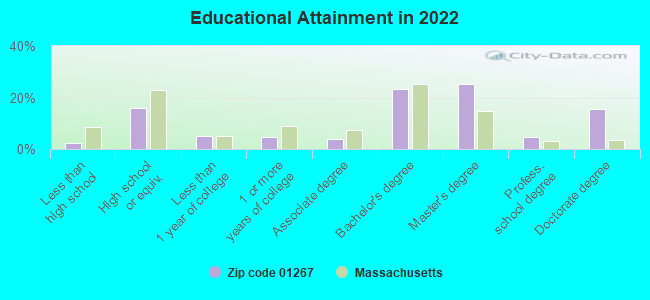
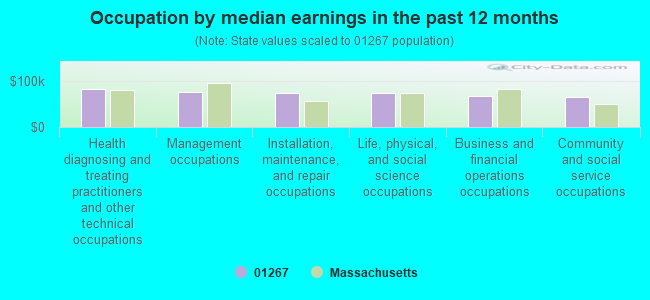
Occupation by median earnings in the past 12 months ($)
82,175Health diagnosing and treating practitioners and other technical occupations
76,147Management occupations
74,365Installation, maintenance, and repair occupations
73,445Life, physical, and social science occupations
68,108Business and financial operations occupations
66,430Community and social service occupations
Companies with federal contracts located in this zip code:
GREEN, STEVEN (228 MAIN ST STE 393 in WILLIAMSTOWN, MA; small business)
$8,125 with Army for Educational Services. Taking place in VA. Signed on 2002-08-07. Completion date: 2002-08-22.
Top industries in this zip code by the number of employees in 2005:
Educational Services: Colleges, Universities, and Professional Schools (over 1000 employees: 1 establishment)
Health Care and Social Assistance: Nursing Care Facilities (100-249: 2)
2002 - 2018 National Fire Incident Reporting System (NFIRS) incidents
Based on the data from the years 2002 - 2018 the average number of fires per year is 18. The highest number of fires - 34 took place in 2006, and the least - 7 in 2010. The data has a dropping trend.
When looking into fire subcategories, the most incidents belonged to: Structure Fires (59.9%), and Outside Fires (23.1%).
Fire incident types reported to NFIRS in Zip Code 01267


+$375
-$2,642
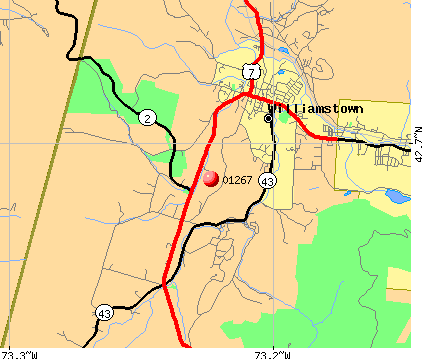 Nearest zip codes: 12022, 12040, 05261, 01237, 05260, 01220.


 Based on the data from the years 2002 - 2018 the average number of fires per year is 18. The highest number of fires - 34 took place in 2006, and the least - 7 in 2010. The data has a dropping trend.
 When looking into fire subcategories, the most incidents belonged to: Structure Fires (59.9%), and Outside Fires (23.1%).