Estimated zip code population in 2022: 1,454 Zip code population in 2010: 1,261 Zip code population in 2000: 1,251
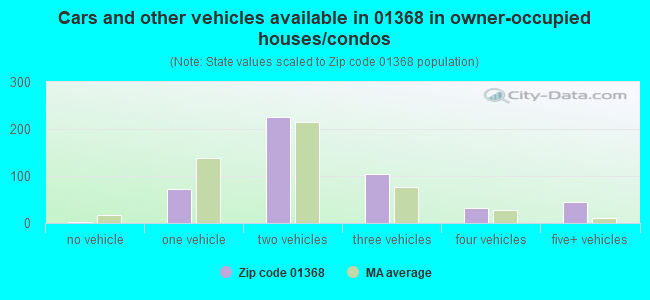
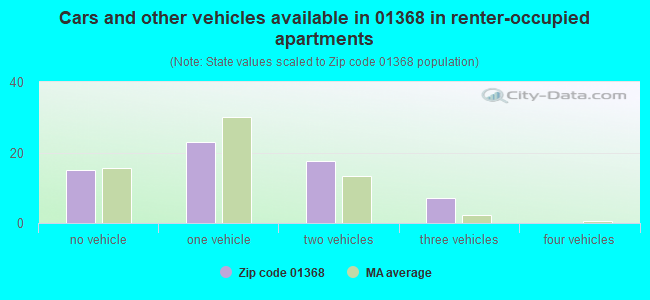
Houses and condos: 621 Renter-occupied apartments: 62
% of renters here:
11%
State:
38%
March 2022 cost of living index in zip code 01368: 109.0 (more than average, U.S. average is 100)
Land area: 41.8 sq. mi. Water area: 0.7 sq. mi.
Population density: 35 people per square mile
(very low).
OSM Map
Google Map
MSN Map
OSM Map
General Map
Google Map
MSN Map
OSM Map
Google Map
MSN Map
OSM Map
Google Map
MSN Map
Please wait while loading the map...
Real estate property taxes paid for housing units in 2022:
This zip code:
0.9% ($3,087)
Massachusetts:
1.0% ($5,536)
Median real estate property taxes paid for housing units with mortgages in 2022: $3,273 (0.9%) Median real estate property taxes paid for housing units with no mortgage in 2022: $2,793 (0.9%)
Business Search- 14 Million verified businesses
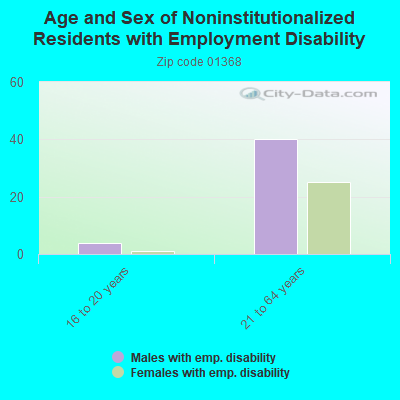
Males: 854
(58.7%)
Females: 600
(41.3%)
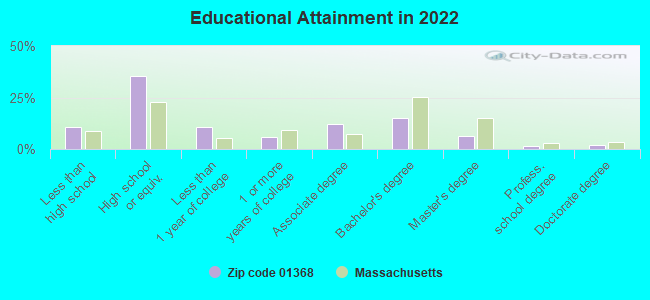
For population 25 years and over in 01368:
High school or higher: 88.8%
Bachelor's degree or higher: 25.3%
Graduate or professional degree: 10.1%
Unemployed: 3.9%
Mean travel time to work (commute): 41.0 minutes
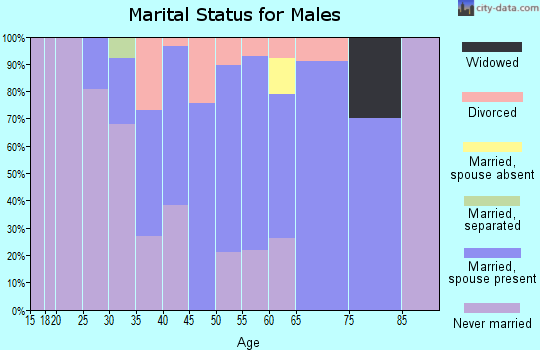
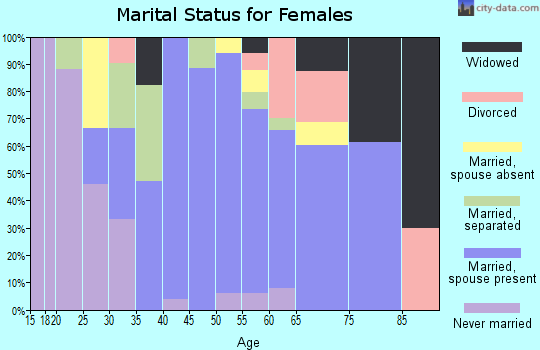
For population 15 years and over in 01368:
Never married: 27.5%
Now married: 57.8%
Separated: 1.3%
Widowed: 3.6%
Divorced: 9.7%
Zip code 01368 compared to state average:
Median house value below state average.
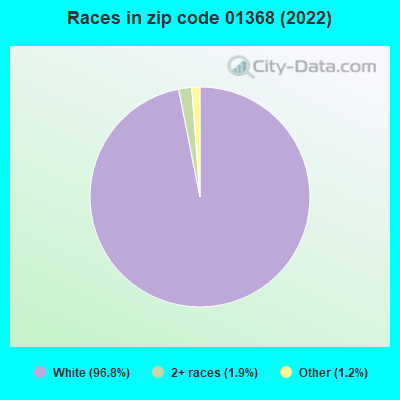
Black race population percentage significantly below state average.
Hispanic race population percentage significantly below state average.
Median age significantly above state average.
Foreign-born population percentage significantly below state average.
Renting percentage significantly below state average.
Length of stay since moving in significantly above state average.
Number of college students below state average.
Percentage of population with a bachelor's degree or higher below state average.
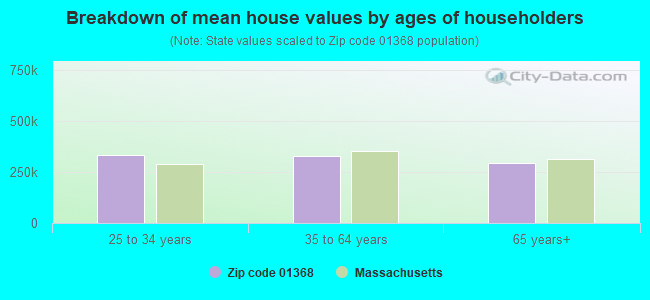
Estimated median house/condo value in 2022: $341,218
01368:
$341,218
Massachusetts:
$534,700
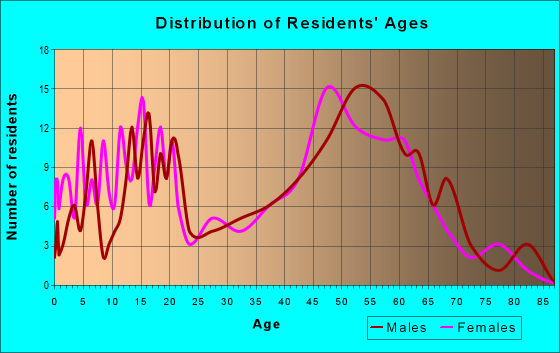
Median resident age:
This zip code:
48.8 years
Massachusetts median age:
40.3 years
Average household size:
This zip code:
2.6 people
Massachusetts:
2.4 people
Averages for the 2020 tax year for zip code 01368, filed in 2021:
Average Adjusted Gross Income (AGI) in 2020: $63,379 (Individual Income Tax Returns)
Here:
$63,379
State:
$105,130
Salary/wage: $56,219 (reported on 77.4% of returns)
Here:
$56,219
State:
$82,951
(% of AGI for various income ranges: 768.2% for AGIs below $25k, 3488.3% for AGIs $25k-50k, 6418.6% for AGIs $50k-75k, 10455.0% for AGIs $75k-100k, 18970.0% for AGIs $100k-200k)
Taxable interest for individuals: $662 (reported on 41.9% of returns)
This zip code:
$662
Massachusetts:
$2,361
(% of AGI for various income ranges: 41.8% for AGIs below $25k, 10.0% for AGIs $25k-50k, 48.6% for AGIs $50k-75k, 40.0% for AGIs $75k-100k, 91.4% for AGIs $100k-200k)
Ordinary dividends: $3,440 (reported on 16.1% of returns)
Here:
$3,440
State:
$10,365
(% of AGI for various income ranges: 36.4% for AGIs below $25k, 20.0% for AGIs $25k-50k, 100.0% for AGIs $50k-75k, 300.0% for AGIs $100k-200k)
Net capital gain/loss in AGI: +$9,633 (reported on 14.5% of returns)
Here:
+$9,633
State:
+$48,178
(% of AGI for various income ranges: 15.5% for AGIs below $25k, 331.4% for AGIs $50k-75k, 882.9% for AGIs $100k-200k)
Profit/loss from business: +$15,680 (reported on 16.1% of returns)
Here:
+$15,680
State:
+$20,792
(% of AGI for various income ranges: 367.3% for AGIs below $25k, 574.3% for AGIs $50k-75k, 1088.6% for AGIs $100k-200k)
Taxable individual retirement arrangement distribution: $15,920 (reported on 8.1% of returns)
01368:
$15,920
Massachusetts:
$22,790
(% of AGI for various income ranges: 274.2% for AGIs $25k-50k, 667.1% for AGIs $100k-200k)
Total itemized deductions: $19,800 (reported on 3.2% of returns)
Here:
$19,800
State:
$36,722
(% of AGI for various income ranges: 565.7% for AGIs $50k-75k)
Taxes paid: $8,900 (reported on 3.2% of returns)
01368:
$8,900
State:
$8,782
(% of AGI for various income ranges: 254.3% for AGIs $50k-75k)
Earned income credit: $2,117 (reported on 9.7% of returns)
Here:
$2,117
State:
$1,909
(% of AGI for various income ranges: 61.8% for AGIs below $25k, 49.2% for AGIs $25k-50k)
Percentage of individuals using paid preparers for their 2020 taxes: 87.1%
Here:
87%
State:
92%
(% for various income ranges: 87.5% for AGIs below $25k, 86.7% for AGIs $25k-50k, 90.0% for AGIs $50k-75k, 85.7% for AGIs $75k-100k, 85.7% for AGIs $100k-200k)
Averages for the 2012 tax year for zip code 01368, filed in 2013:
Average Adjusted Gross Income (AGI) in 2012: $51,109 (Individual Income Tax Returns)
Here:
$51,109
State:
$81,425
Salary/wage: $45,255 (reported on 86.0% of returns)
Here:
$45,255
State:
$64,752
(% of AGI for various income ranges: 68.6% for AGIs below $25k, 78.8% for AGIs $25k-50k, 78.9% for AGIs $50k-75k, 83.2% for AGIs $75k-100k, 69.5% for AGIs $100k-200k)
Taxable interest for individuals: $368 (reported on 38.6% of returns)
This zip code:
$368
Massachusetts:
$2,136
(% of AGI for various income ranges: 0.9% for AGIs below $25k, 0.2% for AGIs $25k-50k, 0.3% for AGIs $50k-75k, 0.1% for AGIs $75k-100k, 0.3% for AGIs $100k-200k)
Ordinary dividends: $1,456 (reported on 15.8% of returns)
Here:
$1,456
State:
$9,473
(% of AGI for various income ranges: 1.2% for AGIs $25k-50k, 0.5% for AGIs $50k-75k, 0.4% for AGIs $100k-200k)
Profit/loss from business: +$10,218 (reported on 19.3% of returns)
Here:
+$10,218
State:
+$20,662
(% of AGI for various income ranges: 8.3% for AGIs below $25k, 4.8% for AGIs $25k-50k, 9.1% for AGIs $50k-75k, 3.0% for AGIs $75k-100k)
Taxable individual retirement arrangement distribution: $5,100 (reported on 5.3% of returns)
01368:
$5,100
Massachusetts:
$18,892
Total itemized deductions: $16,995 (20% of AGI, reported on 35.1% of returns)
Here:
$16,995
State:
$28,907
Here:
19.9% of AGI
State:
18.2% of AGI
(% of AGI for various income ranges: 12.6% for AGIs $25k-50k, 11.5% for AGIs $50k-75k, 12.1% for AGIs $75k-100k, 13.4% for AGIs $100k-200k)
Charity contributions: $1,221 (reported on 24.6% of returns)
Here:
$1,221
State:
$4,208
(% of AGI for various income ranges: 0.4% for AGIs $25k-50k, 0.4% for AGIs $50k-75k, 0.4% for AGIs $75k-100k, 1.0% for AGIs $100k-200k)
Taxes paid: $7,140 (reported on 35.1% of returns)
01368:
$7,140
State:
$13,303
(% of AGI for various income ranges: 3.9% for AGIs $25k-50k, 4.5% for AGIs $50k-75k, 5.1% for AGIs $75k-100k, 6.6% for AGIs $100k-200k)
Earned income credit: $1,356 (reported on 15.8% of returns)
Here:
$1,356
State:
$1,971
(% of AGI for various income ranges: 3.5% for AGIs below $25k, 1.0% for AGIs $25k-50k)
Percentage of individuals using paid preparers for their 2012 taxes: 52.6%
Here:
53%
State:
56%
(% for various income ranges: 44.4% for AGIs below $25k, 53.3% for AGIs $25k-50k, 55.6% for AGIs $50k-75k, 62.5% for AGIs $75k-100k, 57.1% for AGIs $100k-200k)
Averages for the 2004 tax year for zip code 01368, filed in 2005:
Average Adjusted Gross Income (AGI) in 2004: $43,217 (Individual Income Tax Returns)
Here:
$43,217
State:
$62,877
Salary/wage: $37,881 (reported on 85.3% of returns)
Here:
$37,881
State:
$52,969
(% of AGI for various income ranges: 127.1% for AGIs below $10k, 69.6% for AGIs $10k-25k, 84.7% for AGIs $25k-50k, 85.7% for AGIs $50k-75k, 76.5% for AGIs $75k-100k, 51.0% for AGIs over 100k)
Taxable interest for individuals: $732 (reported on 50.8% of returns)
This zip code:
$732
Massachusetts:
$1,945
(% of AGI for various income ranges: 2.9% for AGIs below $10k, 3.6% for AGIs $10k-25k, 0.4% for AGIs $25k-50k, 0.3% for AGIs $50k-75k, 1.0% for AGIs $75k-100k, 0.6% for AGIs over 100k)
Taxable dividends: $1,626 (reported on 19.7% of returns)
Here:
$1,626
State:
$5,323
(% of AGI for various income ranges: 1.1% for AGIs below $10k, 1.1% for AGIs $10k-25k, 0.5% for AGIs $25k-50k, 0.0% for AGIs $50k-75k, 0.3% for AGIs $75k-100k, 2.0% for AGIs over 100k)
Net capital gain/loss: +$4,515 (reported on 12.5% of returns)
Here:
+$4,515
State:
+$20,377
(% of AGI for various income ranges: -0.4% for AGIs $10k-25k, 0.1% for AGIs $25k-50k, 0.9% for AGIs $50k-75k, 4.6% for AGIs over 100k)
Profit/loss from business: +$17,803 (reported on 21.5% of returns)
Here:
+$17,803
State:
+$17,837
(% of AGI for various income ranges: 9.6% for AGIs below $10k, 14.1% for AGIs $10k-25k, 5.8% for AGIs $25k-50k, 5.2% for AGIs $50k-75k, 20.5% for AGIs over 100k)
IRA payment deduction: $3,077 (reported on 2.4% of returns)
01368:
$3,077
Massachusetts:
$3,100
Total itemized deductions: $16,120 (21% of AGI, reported on 33.7% of returns)
Here:
$16,120
State:
$22,573
Here:
21.3% of AGI
State:
19.5% of AGI
(% of AGI for various income ranges: 9.6% for AGIs $10k-25k, 11.9% for AGIs $25k-50k, 13.3% for AGIs $50k-75k, 11.0% for AGIs $75k-100k, 15.2% for AGIs over 100k)
Charity contributions deductions: $1,628 (2% of AGI, reported on 28.7% of returns)
Here:
$1,628
State:
$3,295
Here:
2.1% of AGI
State:
2.7% of AGI
(% of AGI for various income ranges: 0.3% for AGIs $10k-25k, 0.6% for AGIs $25k-50k, 0.9% for AGIs $50k-75k, 0.7% for AGIs $75k-100k, 2.3% for AGIs over 100k)
Total tax: $5,944 (reported on 78.6% of returns)
01368:
$5,944
State:
$11,494
(% of AGI for various income ranges: 2.9% for AGIs below $10k, 5.6% for AGIs $10k-25k, 7.1% for AGIs $25k-50k, 9.2% for AGIs $50k-75k, 11.5% for AGIs $75k-100k, 17.9% for AGIs over 100k)
Earned income credit: $2,046 (reported on 12.0% of returns)
Here:
$2,046
State:
$1,518
Percentage of individuals using paid preparers for their 2004 taxes: 56.4%
Here:
56%
State:
58%
(% for various income ranges: 48.0% for AGIs below $10k, 55.3% for AGIs $10k-25k, 55.9% for AGIs $25k-50k, 63.5% for AGIs $50k-75k, 58.3% for AGIs $75k-100k, 61.8% for AGIs over 100k)
Household received Food Stamps/SNAP in the past 12 months: 62 Household did not receive Food Stamps/SNAP in the past 12 months: 482
Women who had a birth in the past 12 months: 3 (4 now married, 0 unmarried) Women who did not have a birth in the past 12 months: 256 (122 now married, 132 unmarried)
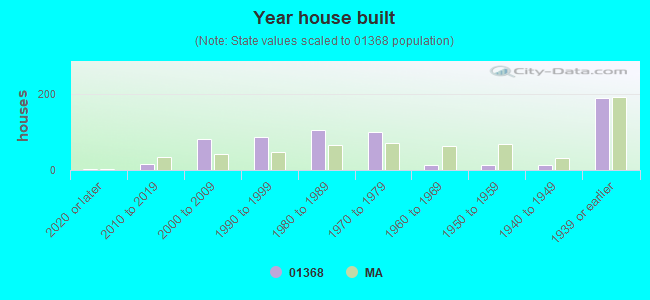
Housing units in zip code 01368 with a mortgage: 312 (57 second mortgage, 58 both second mortgage and home equity loan) Houses without a mortgage: 22
Median monthly owner costs for units with a mortgage: $1,626 Median monthly owner costs for units without a mortgage: $616
Residents with income below the poverty level in 2022:
This zip code:
11.7%
Whole state:
10.4%
Residents with income below 50% of the poverty level in 2022:
This zip code:
5.9%
Whole state:
5.1%
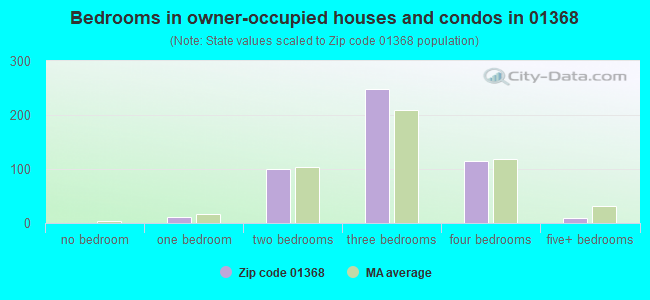
Median number of rooms in houses and condos:
Here:
6.2
State:
6.5
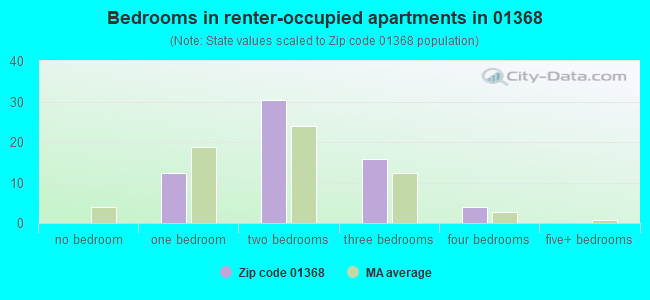
Median number of rooms in apartments:
Here:
4.4
State:
4.0
Notable locations in this zip code not listed on our city pages
Notable locations in zip code 01368: Royalston Fire Department Station 1 Headquarters (A), Royalston Fire Department (B). Display/hide their locations on the map
Cemeteries: Lawrence Brook Cemetery (1), Riverside Cemetery (2), Center Cemetery (3), Newton Cemetery (4), Royalston Center Cemetery (5). Display/hide their locations on the map
Lakes, reservoirs, and swamps: Long Pond (A), Little Pond (B), Beaver Pond (C), Tully Lake (D), Paine Swamp (E), Albee Meadow (F). Display/hide their locations on the map
Streams, rivers, and creeks: Scott Brook (A), Dunham Brook (B), Kenny Brook (C), Lawrence Brook (D), Stockwell Brook (E), Towne Brook (F), Boyce Brook (G), Shepardson Brook (H). Display/hide their locations on the map
Parks in zip code 01368 include: Birch Hill State Wildlife Management Area (1), Royalston Common Historic District (2), Millers River Wildlife Management Area (3), Lawrence Brook Wildlife Management Area (4). Display/hide their locations on the map
Size of family households: 168 2-persons, 101 3-persons, 44 4-persons, 35 5-persons, 37 6-persons
Size of nonfamily households: 120 1-person, 38 2-persons, 1 3-persons
202 married couples with children.
73 single-parent households (29 men, 44 women).
98.4% of residents of 01368 zip code speak English at home.
0.3% of residents speak Spanish at home (100% very well).
0.7% of residents speak other Indo-European language at home (100% very well).
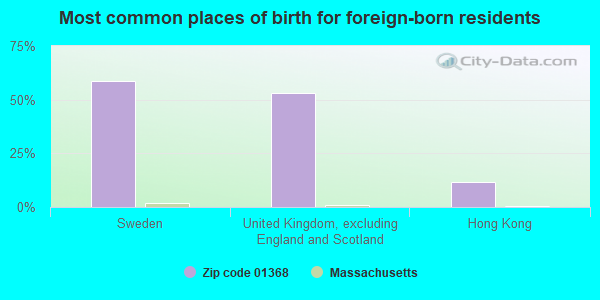
Foreign born population: 17 (1.2%) (41.7% of them are naturalized citizens)
This zip code:
1.2%
Whole state:
18.0%
59%Sweden
53%United Kingdom, excluding England and Scotland
12%Hong Kong
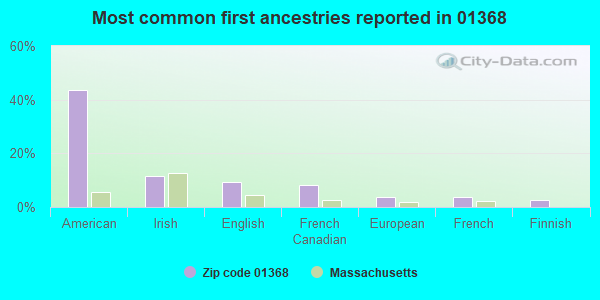
44%American
12%Irish
9%English
8%French Canadian
4%European
4%French
3%Finnish
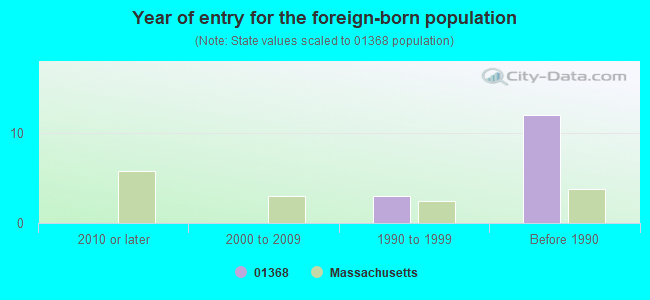
Year of entry for the foreign-born population
02010 or later
02000 to 2009
31990 to 1999
12Before 1990
Facilities with environmental interests located in this zip code:
ROYALSTON WASTEWATER TREATMENT PLANT (15 BLOSSOM STREET in ROYALSTON, MA)
STATE MASTER (MA-EPICS) - RCRAINFO-, HAZARDOUS WASTE PROGRAM National Pollutant Discharge Elimination System NON-MAJOR (Tracking pollutant discharge elimination systems) - permit - ICIS-, ENFORCEMENT/COMPLIANCE ACTIVITY Business SIC classification: SEWERAGE SYSTEMS Organizations: MARK A. DAY (CONTACT/OPERATOR)
, ROYALSTON WWTP (CONTACT/OWNER)
Alternative names: ROYALSTON WASTE WATER TREATMEN, ROYALSTON WWTP, ROYLASTON WWTP
ROYALSTON LANDFILL (6 TOWN DUMP RD in ROYALSTON, MA)
STATE MASTER (MA-EPICS) - RCRAINFO-MV5082493617, HAZARDOUS WASTE PROGRAM CRITERIA AND HAZARDOUS AIR POLLUTANT INVENTORY (Inventory of air pollution sources) Business SIC classification: REFUSE SYSTEMS Business NAICS classification: SOLID WASTE LANDFILL.
ROYALSTON COMMUNITY SCH (96 WINCHENDON RD in ROYALSTON, MA)
(National Center for Education Statistics) - STATE ID-615050 Organizations: ATHOL-ROYALSTON (SCHOOL DISTRICT)
ROYALSTON (ROYALSTON in ROYALSTON, MA)
AIR MINOR (AIRS/AFS) Business SIC classification: GENERAL GOVERNMENT
Housing units lacking complete plumbing facilities: 0.5% Housing units lacking complete kitchen facilities: 2.2%
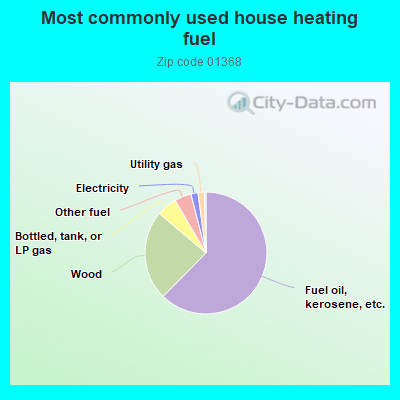
62.8%Fuel oil, kerosene, etc.
23.9%Wood
5.4%Bottled, tank, or LP gas
4.5%Other fuel
1.9%Electricity
1.7%Utility gas
Place of birth for U.S.-born residents:
This state: 1,220
Northeast: 143
Midwest: 20
South: 18
West: 21
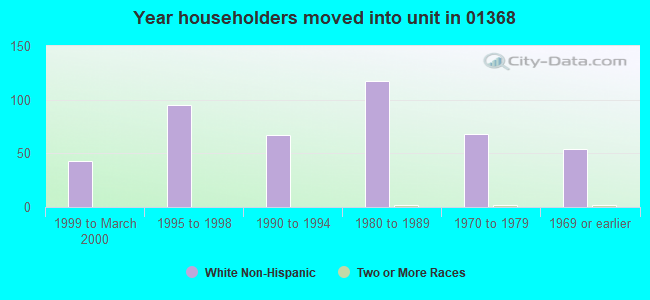
72% of the 01368 zip code residents lived in the same house 5 years ago. Out of people who lived in different houses, 61% lived in this county. Out of people who lived in different counties, 50% lived in Massachusetts.
92% of the 01368 zip code residents lived in the same house 1 year ago. Out of people who lived in different houses, 64% moved from this county. Out of people who lived in different houses, 22% moved from different county within same state. Out of people who lived in different houses, 5% moved from different state. Out of people who lived in different houses, 4% moved from abroad.
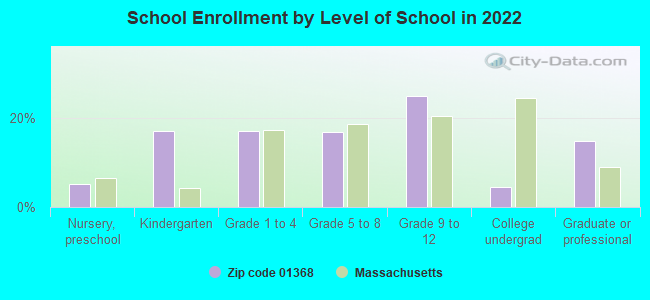
Private vs. public school enrollment:
Students in private schools in grades 1 to 8 (elementary and middle school): 6
Here:
7.1%
Massachusetts:
10.3%
Students in private schools in grades 9 to 12 (high school): 11
Here:
16.5%
Massachusetts:
12.3%
Students in private undergraduate colleges: 12
Here:
93.0%
Massachusetts:
51.2%
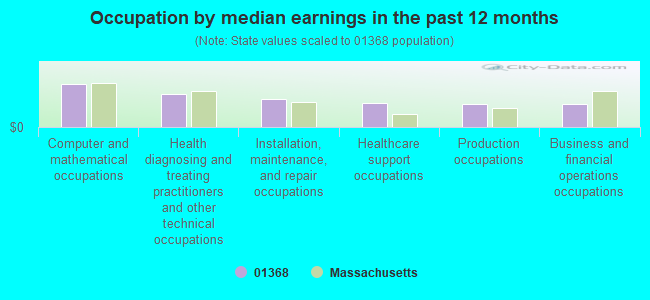
Occupation by median earnings in the past 12 months ($)
126,971Computer and mathematical occupations
96,350Health diagnosing and treating practitioners and other technical occupations
80,645Installation, maintenance, and repair occupations
68,691Healthcare support occupations
67,877Production occupations
66,556Business and financial operations occupations
Companies with federal contracts located in this zip code:
WAYNE R NEWTON BUILDING & EXC (62 N FITZWILLIAMS ROAD in ROYALSTON, MA; small business) : $6,020 in 9 contractsfrom 2001 to 2004
Contracts for Snow Removal/Salt Service (also spreading aggregate or other snow melting material) by U.S. Army Corps of Engineers - civil program financing only, Army Signed by year:2000: $0; 2001: $2,400; 2002: $1,320; 2003: $5,050; 2004: -$2,750; 2005: $0; 2006: $0.
Biggest contracts:
$2,400 with U.S. Army Corps of Engineers - civil program financing only for Snow Removal/Salt Service (also spreading aggregate or other snow melting material). Signed on 2001-10-25. Completion date: 2002-04-16.
$2,375 with Army for Snow Removal/Salt Service (also spreading aggregate or other snow melting material). Signed on 2003-10-31. Completion date: 2004-04-16.
$2,375 with U.S. Army Corps of Engineers - civil program financing only for Snow Removal/Salt Service (also spreading aggregate or other snow melting material). Signed on 2003-10-31. Completion date: 2004-04-16.
$2,375, same as above.Signed on 2002-11-04. Completion date: 2003-04-16.
DELFI EXCAVATING INCORPORATED (146 WINCHENDON ROAD in ROYALSTON, MA; small business) : $0 in 2 contractsfrom 2001 to 2002
$5,850 with U.S. Army Corps of Engineers - civil program financing only for Maintenance, Repair or Alteration of Real Property -- Dams. Signed on 2001-04-19. Completion date: 2001-08-31.
-$5,850, same as above.Signed on 2002-01-29. Completion date: 2001-08-31.
Top industries in this zip code by the number of employees in 2005:
Accommodation and Food Services: Full-Service Restaurants (10-19 employees: 1 establishment)
Educational Services: Elementary and Secondary Schools (10-19: 1)
Professional, Scientific, and Technical Services: All Other Professional, Scientific, and Technical Services (5-9: 1)
Health Care and Social Assistance: Other Individual and Family Services (1-4: 1)
Other Services (except Public Administration): Religious Organizations (1-4: 1)
Construction: New Single-Family Housing Construction (except Operative Builders) (1-4: 1)
Construction: Residential Remodelers (1-4: 1)
Construction: Site Preparation Contractors (1-4: 1)
Fatal accident statistics in 2013:
Fatal accident count: 1
Vehicles involved in fatal accidents: 1
Fatal accidents caused by drunken drivers: 0
Fatalities: 1
Persons involved in fatal accidents: 1
Pedestrians involved in fatal accidents: 0
Home Mortgage Disclosure Act Aggregated Statistics For Year 2009 (Based on 2 partial tracts)
A) FHA, FSA/RHS & VA Home Purchase Loans
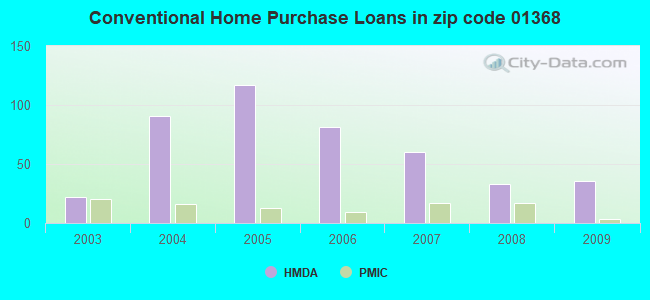
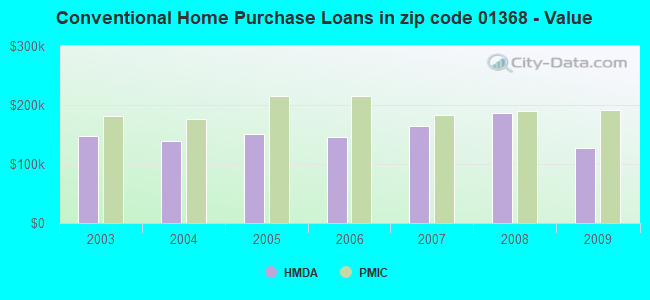
B) Conventional Home Purchase Loans
C) Refinancings
D) Home Improvement Loans
F) Non-occupant Loans on < 5 Family Dwellings (A B C & D)
Number
Average Value
Number
Average Value
Number
Average Value
Number
Average Value
Number
Average Value
LOANS ORIGINATED
14
$153,639
36
$126,546
89
$164,352
20
$40,654
6
$79,635
APPLICATIONS APPROVED, NOT ACCEPTED
0
$0
2
$39,165
8
$191,321
2
$19,580
2
$39,165
APPLICATIONS DENIED
2
$138,645
8
$145,890
49
$202,187
6
$6,267
0
$0
APPLICATIONS WITHDRAWN
0
$0
2
$84,595
23
$171,304
0
$0
0
$0
FILES CLOSED FOR INCOMPLETENESS
0
$0
2
$54,830
13
$190,041
0
$0
0
$0
Aggregated Statistics For Year 2008 (Based on 2 partial tracts)
A) FHA, FSA/RHS & VA Home Purchase Loans
B) Conventional Home Purchase Loans
C) Refinancings
D) Home Improvement Loans
F) Non-occupant Loans on < 5 Family Dwellings (A B C & D)
G) Loans On Manufactured Home Dwelling (A B C & D)
Number
Average Value
Number
Average Value
Number
Average Value
Number
Average Value
Number
Average Value
Number
Average Value
LOANS ORIGINATED
19
$160,947
33
$186,663
53
$170,080
36
$45,170
6
$236,557
0
$0
APPLICATIONS APPROVED, NOT ACCEPTED
2
$76,765
5
$160,106
13
$155,696
6
$21,410
0
$0
0
$0
APPLICATIONS DENIED
9
$131,247
6
$160,055
70
$190,454
17
$118,969
2
$184,075
2
$45,430
APPLICATIONS WITHDRAWN
0
$0
5
$104,962
19
$204,647
0
$0
0
$0
0
$0
FILES CLOSED FOR INCOMPLETENESS
0
$0
2
$137,075
3
$182,770
0
$0
0
$0
0
$0
Aggregated Statistics For Year 2007 (Based on 2 partial tracts)
A) FHA, FSA/RHS & VA Home Purchase Loans
B) Conventional Home Purchase Loans
C) Refinancings
D) Home Improvement Loans
F) Non-occupant Loans on < 5 Family Dwellings (A B C & D)
G) Loans On Manufactured Home Dwelling (A B C & D)
Number
Average Value
Number
Average Value
Number
Average Value
Number
Average Value
Number
Average Value
Number
Average Value
LOANS ORIGINATED
0
$0
60
$163,579
125
$148,977
25
$53,264
3
$150,393
0
$0
APPLICATIONS APPROVED, NOT ACCEPTED
0
$0
11
$109,093
13
$146,296
3
$92,430
3
$74,153
0
$0
APPLICATIONS DENIED
2
$107,310
11
$122,622
105
$197,436
13
$97,370
3
$120,107
2
$16,450
APPLICATIONS WITHDRAWN
0
$0
8
$164,689
49
$180,734
2
$133,160
0
$0
0
$0
FILES CLOSED FOR INCOMPLETENESS
0
$0
2
$133,945
9
$174,589
0
$0
0
$0
0
$0
Aggregated Statistics For Year 2006 (Based on 2 partial tracts)
A) FHA, FSA/RHS & VA Home Purchase Loans
B) Conventional Home Purchase Loans
C) Refinancings
D) Home Improvement Loans
E) Loans on Dwellings For 5+ Families
F) Non-occupant Loans on < 5 Family Dwellings (A B C & D)
G) Loans On Manufactured Home Dwelling (A B C & D)
Number
Average Value
Number
Average Value
Number
Average Value
Number
Average Value
Number
Average Value
Number
Average Value
Number
Average Value
LOANS ORIGINATED
0
$0
81
$145,056
157
$158,336
53
$74,015
3
$209,403
6
$214,885
0
$0
APPLICATIONS APPROVED, NOT ACCEPTED
0
$0
13
$116,892
28
$151,065
2
$72,845
0
$0
0
$0
2
$77,545
APPLICATIONS DENIED
2
$155,095
30
$130,393
110
$159,337
30
$91,281
0
$0
5
$87,730
3
$174,413
APPLICATIONS WITHDRAWN
0
$0
19
$125,493
77
$167,118
5
$112,168
0
$0
2
$134,730
2
$41,515
FILES CLOSED FOR INCOMPLETENESS
2
$63,445
5
$130,342
27
$197,043
2
$39,165
0
$0
0
$0
0
$0
Aggregated Statistics For Year 2005 (Based on 2 partial tracts)
A) FHA, FSA/RHS & VA Home Purchase Loans
B) Conventional Home Purchase Loans
C) Refinancings
D) Home Improvement Loans
F) Non-occupant Loans on < 5 Family Dwellings (A B C & D)
G) Loans On Manufactured Home Dwelling (A B C & D)
Number
Average Value
Number
Average Value
Number
Average Value
Number
Average Value
Number
Average Value
Number
Average Value
LOANS ORIGINATED
5
$218,698
117
$150,367
199
$159,337
39
$102,432
11
$134,443
2
$21,930
APPLICATIONS APPROVED, NOT ACCEPTED
0
$0
20
$119,140
16
$196,021
5
$21,620
3
$98,697
0
$0
APPLICATIONS DENIED
2
$159,010
19
$131,429
128
$153,661
23
$56,534
0
$0
2
$21,150
APPLICATIONS WITHDRAWN
0
$0
20
$131,516
81
$143,972
14
$142,673
2
$146,475
0
$0
FILES CLOSED FOR INCOMPLETENESS
0
$0
14
$131,147
55
$188,191
0
$0
3
$224,547
0
$0
Aggregated Statistics For Year 2004 (Based on 2 partial tracts)
A) FHA, FSA/RHS & VA Home Purchase Loans
B) Conventional Home Purchase Loans
C) Refinancings
D) Home Improvement Loans
F) Non-occupant Loans on < 5 Family Dwellings (A B C & D)
G) Loans On Manufactured Home Dwelling (A B C & D)
Number
Average Value
Number
Average Value
Number
Average Value
Number
Average Value
Number
Average Value
Number
Average Value
LOANS ORIGINATED
5
$180,786
91
$138,876
202
$137,023
44
$97,307
16
$135,119
8
$42,886
APPLICATIONS APPROVED, NOT ACCEPTED
0
$0
6
$182,248
28
$136,574
3
$3,133
5
$155,094
0
$0
APPLICATIONS DENIED
0
$0
30
$145,589
72
$147,848
22
$48,992
8
$142,952
11
$43,295
APPLICATIONS WITHDRAWN
2
$100,260
17
$109,570
74
$157,443
8
$117,104
3
$104,963
0
$0
FILES CLOSED FOR INCOMPLETENESS
0
$0
5
$112,482
55
$165,832
5
$141,308
2
$65,795
0
$0
Aggregated Statistics For Year 2003 (Based on 2 partial tracts)
A) FHA, FSA/RHS & VA Home Purchase Loans
B) Conventional Home Purchase Loans
C) Refinancings
D) Home Improvement Loans
F) Non-occupant Loans on < 5 Family Dwellings (A B C & D)


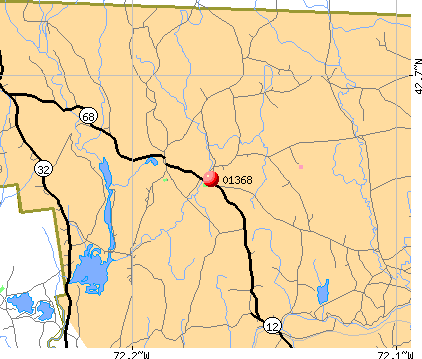 Nearest zip codes: 03447, 01436, 01331, 01475, 01364, 03465.