Estimated zip code population in 2022: 9,444 Zip code population in 2010: 8,512 Zip code population in 2000: 6,959
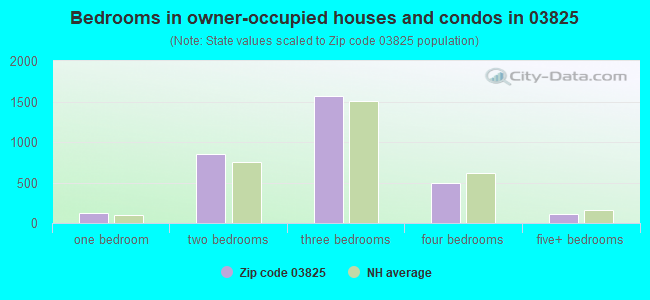
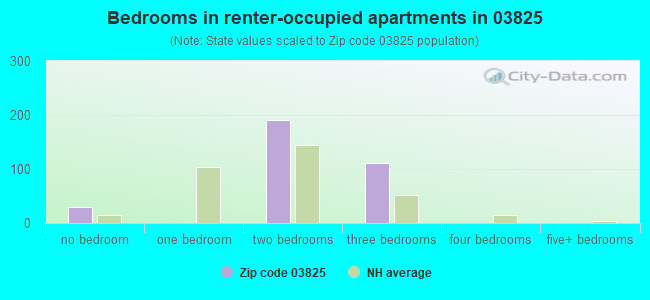
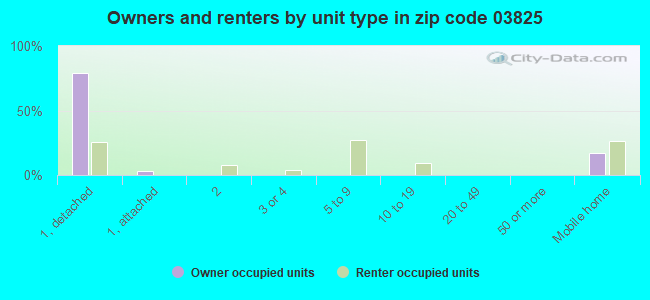
Houses and condos: 3,697 Renter-occupied apartments: 334
% of renters here:
10%
State:
28%
March 2022 cost of living index in zip code 03825: 112.5 (more than average, U.S. average is 100)
Land area: 46.1 sq. mi. Water area: 1.9 sq. mi.
Population density: 205 people per square mile
(very low).
OSM Map
Google Map
MSN Map
OSM Map
General Map
Google Map
MSN Map
OSM Map
Google Map
MSN Map
OSM Map
Google Map
MSN Map
Please wait while loading the map...
Real estate property taxes paid for housing units in 2022:
This zip code:
1.7% ($6,513)
New Hampshire:
1.6% ($6,209)
Median real estate property taxes paid for housing units with mortgages in 2022: $7,351 (1.8%) Median real estate property taxes paid for housing units with no mortgage in 2022: $5,510 (2.0%)
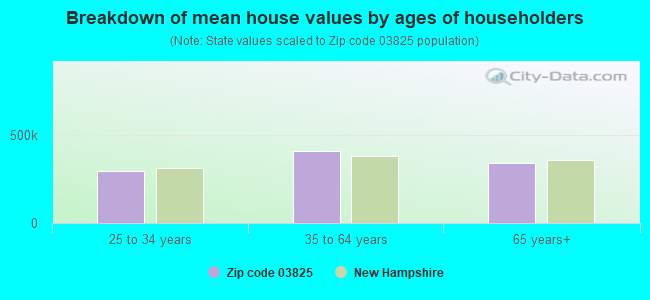
Estimated median house/condo value in 2022: $372,489
03825:
$372,489
New Hampshire:
$384,700
According to our research of New Hampshire and other state lists, there were 11 registered sex offenders living in 03825 zip code as of April 26, 2024. The ratio of all residents to sex offenders in zip code 03825 is 820 to 1. The ratio of registered sex offenders to all residents in this zip code is lower than the state average.
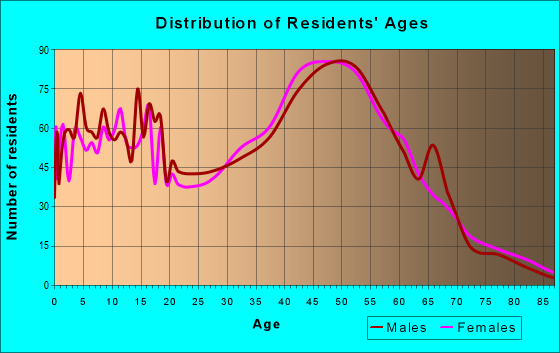
Median resident age:
This zip code:
39.2 years
New Hampshire median age:
43.3 years
Average household size:
This zip code:
2.7 people
New Hampshire:
2.4 people
Averages for the 2020 tax year for zip code 03825, filed in 2021:
Average Adjusted Gross Income (AGI) in 2020: $83,866 (Individual Income Tax Returns)
Here:
$83,866
State:
$88,845
Salary/wage: $73,233 (reported on 86.2% of returns)
Here:
$73,233
State:
$71,693
(% of AGI for various income ranges: 1199.9% for AGIs below $25k, 3598.8% for AGIs $25k-50k, 6443.2% for AGIs $50k-75k, 9553.2% for AGIs $75k-100k, 18558.9% for AGIs $100k-200k, 59970.0% for AGIs over 200k)
Taxable interest for individuals: $1,066 (reported on 36.7% of returns)
This zip code:
$1,066
New Hampshire:
$1,640
(% of AGI for various income ranges: 13.7% for AGIs below $25k, 33.6% for AGIs $25k-50k, 46.2% for AGIs $50k-75k, 52.7% for AGIs $75k-100k, 71.7% for AGIs $100k-200k, 497.5% for AGIs over 200k)
Ordinary dividends: $4,039 (reported on 21.8% of returns)
Here:
$4,039
State:
$8,258
(% of AGI for various income ranges: 26.3% for AGIs below $25k, 32.8% for AGIs $25k-50k, 86.0% for AGIs $50k-75k, 97.6% for AGIs $75k-100k, 241.1% for AGIs $100k-200k, 1141.7% for AGIs over 200k)
Net capital gain/loss in AGI: +$18,948 (reported on 18.6% of returns)
Here:
+$18,948
State:
+$28,952
(% of AGI for various income ranges: 21.0% for AGIs below $25k, 13.7% for AGIs $25k-50k, 60.0% for AGIs $50k-75k, 130.7% for AGIs $75k-100k, 375.7% for AGIs $100k-200k, 11543.3% for AGIs over 200k)
Profit/loss from business: +$25,561 (reported on 14.8% of returns)
Here:
+$25,561
State:
+$24,424
(% of AGI for various income ranges: 147.0% for AGIs below $25k, 208.3% for AGIs $25k-50k, 285.5% for AGIs $50k-75k, 585.9% for AGIs $75k-100k, 843.4% for AGIs $100k-200k, 5135.0% for AGIs over 200k)
Taxable individual retirement arrangement distribution: $15,685 (reported on 9.4% of returns)
03825:
$15,685
New Hampshire:
$21,952
(% of AGI for various income ranges: 60.0% for AGIs below $25k, 105.3% for AGIs $25k-50k, 218.3% for AGIs $50k-75k, 287.8% for AGIs $75k-100k, 450.6% for AGIs $100k-200k, 429.2% for AGIs over 200k)
Self-employed (Keogh) retirement plans: $20,900 (reported on 0.8% of returns)
03825:
$20,900
New Hampshire:
$24,779
(% of AGI for various income ranges: 119.4% for AGIs $100k-200k)
Total itemized deductions: $26,250 (reported on 8.4% of returns)
Here:
$26,250
State:
$32,702
(% of AGI for various income ranges: 138.7% for AGIs $25k-50k, 362.3% for AGIs $50k-75k, 339.3% for AGIs $75k-100k, 512.0% for AGIs $100k-200k, 2482.5% for AGIs over 200k)
Charity contributions: $5,344 (reported on 5.4% of returns)
Here:
$5,344
State:
$9,866
(% of AGI for various income ranges: 6.3% for AGIs below $25k, 30.2% for AGIs $50k-75k, 45.4% for AGIs $75k-100k, 62.0% for AGIs $100k-200k, 509.2% for AGIs over 200k)
Taxes paid: $7,893 (reported on 8.2% of returns)
03825:
$7,893
State:
$8,247
(% of AGI for various income ranges: 40.1% for AGIs $25k-50k, 85.7% for AGIs $50k-75k, 127.8% for AGIs $75k-100k, 171.1% for AGIs $100k-200k, 605.8% for AGIs over 200k)
Earned income credit: $1,657 (reported on 7.0% of returns)
Here:
$1,657
State:
$1,831
(% of AGI for various income ranges: 39.9% for AGIs below $25k, 30.5% for AGIs $25k-50k)
Percentage of individuals using paid preparers for their 2020 taxes: 92.4%
Here:
92%
State:
92%
(% for various income ranges: 88.9% for AGIs below $25k, 93.3% for AGIs $25k-50k, 93.1% for AGIs $50k-75k, 93.1% for AGIs $75k-100k, 93.2% for AGIs $100k-200k, 96.8% for AGIs over 200k)
Averages for the 2012 tax year for zip code 03825, filed in 2013:
Average Adjusted Gross Income (AGI) in 2012: $61,671 (Individual Income Tax Returns)
Here:
$61,671
State:
$66,185
Salary/wage: $55,126 (reported on 87.7% of returns)
Here:
$55,126
State:
$55,674
(% of AGI for various income ranges: 76.1% for AGIs below $25k, 79.2% for AGIs $25k-50k, 78.3% for AGIs $50k-75k, 82.6% for AGIs $75k-100k, 83.7% for AGIs $100k-200k, 59.9% for AGIs over 200k)
Taxable interest for individuals: $1,089 (reported on 36.1% of returns)
This zip code:
$1,089
New Hampshire:
$1,674
(% of AGI for various income ranges: 0.8% for AGIs below $25k, 0.7% for AGIs $25k-50k, 0.6% for AGIs $50k-75k, 0.5% for AGIs $75k-100k, 0.4% for AGIs $100k-200k, 1.4% for AGIs over 200k)
Ordinary dividends: $3,079 (reported on 21.7% of returns)
Here:
$3,079
State:
$6,774
(% of AGI for various income ranges: 3.1% for AGIs below $25k, 0.6% for AGIs $25k-50k, 0.8% for AGIs $50k-75k, 1.1% for AGIs $75k-100k, 0.6% for AGIs $100k-200k, 2.1% for AGIs over 200k)
Net capital gain/loss in AGI: +$10,166 (reported on 15.2% of returns)
Here:
+$10,166
State:
+$13,759
(% of AGI for various income ranges: 0.1% for AGIs $25k-50k, 0.7% for AGIs $50k-75k, 0.9% for AGIs $75k-100k, 0.7% for AGIs $100k-200k, 14.4% for AGIs over 200k)
Profit/loss from business: +$16,489 (reported on 15.7% of returns)
Here:
+$16,489
State:
+$19,298
(% of AGI for various income ranges: 8.7% for AGIs below $25k, 5.4% for AGIs $25k-50k, 5.3% for AGIs $50k-75k, 3.4% for AGIs $75k-100k, 4.6% for AGIs $100k-200k)
Taxable individual retirement arrangement distribution: $14,895 (reported on 8.5% of returns)
03825:
$14,895
New Hampshire:
$16,908
(% of AGI for various income ranges: 2.7% for AGIs below $25k, 2.6% for AGIs $25k-50k, 1.8% for AGIs $50k-75k, 2.3% for AGIs $75k-100k, 2.6% for AGIs $100k-200k)
Self-employment retirement plans: $10,367 (reported on 0.7% of returns)
03825:
$10,367
New Hampshire:
$18,791
Total itemized deductions: $19,455 (19% of AGI, reported on 38.1% of returns)
Here:
$19,455
State:
$22,617
Here:
19.4% of AGI
State:
18.1% of AGI
(% of AGI for various income ranges: 10.0% for AGIs below $25k, 11.3% for AGIs $25k-50k, 13.2% for AGIs $50k-75k, 13.8% for AGIs $75k-100k, 12.3% for AGIs $100k-200k, 9.1% for AGIs over 200k)
Charity contributions: $2,052 (reported on 26.2% of returns)
Here:
$2,052
State:
$2,860
(% of AGI for various income ranges: 0.5% for AGIs below $25k, 0.5% for AGIs $25k-50k, 0.8% for AGIs $50k-75k, 1.1% for AGIs $75k-100k, 0.9% for AGIs $100k-200k, 1.2% for AGIs over 200k)
Taxes paid: $7,472 (reported on 37.9% of returns)
03825:
$7,472
State:
$8,830
(% of AGI for various income ranges: 3.4% for AGIs below $25k, 3.9% for AGIs $25k-50k, 4.7% for AGIs $50k-75k, 5.0% for AGIs $75k-100k, 4.9% for AGIs $100k-200k, 4.3% for AGIs over 200k)
Earned income credit: $1,764 (reported on 10.5% of returns)
Here:
$1,764
State:
$1,863
(% of AGI for various income ranges: 3.6% for AGIs below $25k, 0.7% for AGIs $25k-50k)
Percentage of individuals using paid preparers for their 2012 taxes: 38.6%
Here:
39%
State:
45%
(% for various income ranges: 31.0% for AGIs below $25k, 37.1% for AGIs $25k-50k, 43.3% for AGIs $50k-75k, 42.4% for AGIs $75k-100k, 43.7% for AGIs $100k-200k, 70.0% for AGIs over 200k)
Averages for the 2004 tax year for zip code 03825, filed in 2005:
Average Adjusted Gross Income (AGI) in 2004: $50,306 (Individual Income Tax Returns)
Here:
$50,306
State:
$54,348
Salary/wage: $46,544 (reported on 89.0% of returns)
Here:
$46,544
State:
$46,966
(% of AGI for various income ranges: 94.5% for AGIs below $10k, 76.9% for AGIs $10k-25k, 82.8% for AGIs $25k-50k, 85.6% for AGIs $50k-75k, 87.2% for AGIs $75k-100k, 76.9% for AGIs over 100k)
Taxable interest for individuals: $772 (reported on 49.3% of returns)
This zip code:
$772
New Hampshire:
$1,634
(% of AGI for various income ranges: 2.8% for AGIs below $10k, 1.3% for AGIs $10k-25k, 0.9% for AGIs $25k-50k, 0.6% for AGIs $50k-75k, 0.4% for AGIs $75k-100k, 0.8% for AGIs over 100k)
Taxable dividends: $1,778 (reported on 26.1% of returns)
Here:
$1,778
State:
$3,855
(% of AGI for various income ranges: 2.3% for AGIs below $10k, 1.1% for AGIs $10k-25k, 0.6% for AGIs $25k-50k, 1.0% for AGIs $50k-75k, 0.4% for AGIs $75k-100k, 1.3% for AGIs over 100k)
Net capital gain/loss: +$6,949 (reported on 21.1% of returns)
Here:
+$6,949
State:
+$13,739
(% of AGI for various income ranges: -1.6% for AGIs below $10k, -0.4% for AGIs $10k-25k, 0.3% for AGIs $25k-50k, 1.0% for AGIs $50k-75k, 1.0% for AGIs $75k-100k, 8.0% for AGIs over 100k)
Profit/loss from business: +$15,724 (reported on 18.1% of returns)
Here:
+$15,724
State:
+$16,641
(% of AGI for various income ranges: 8.8% for AGIs below $10k, 7.4% for AGIs $10k-25k, 7.3% for AGIs $25k-50k, 4.0% for AGIs $50k-75k, 3.8% for AGIs $75k-100k, 6.8% for AGIs over 100k)
IRA payment deduction: $3,158 (reported on 4.3% of returns)
03825:
$3,158
New Hampshire:
$3,013
(% of AGI for various income ranges: 0.2% for AGIs $10k-25k, 0.5% for AGIs $25k-50k, 0.4% for AGIs $50k-75k, 0.2% for AGIs $75k-100k, 0.1% for AGIs over 100k)
Self-employed pension: $8,089 (reported on 1.2% of returns)
Here:
$8,089
New Hampshire:
$13,003
Total itemized deductions: $16,468 (21% of AGI, reported on 39.9% of returns)
Here:
$16,468
State:
$18,832
Here:
21.2% of AGI
State:
19.6% of AGI
(% of AGI for various income ranges: 12.0% for AGIs below $10k, 12.2% for AGIs $10k-25k, 12.8% for AGIs $25k-50k, 14.2% for AGIs $50k-75k, 13.4% for AGIs $75k-100k, 12.4% for AGIs over 100k)
Charity contributions deductions: $1,824 (2% of AGI, reported on 33.4% of returns)
Here:
$1,824
State:
$2,473
Here:
2.2% of AGI
State:
2.4% of AGI
(% of AGI for various income ranges: 0.4% for AGIs below $10k, 0.6% for AGIs $10k-25k, 0.8% for AGIs $25k-50k, 1.1% for AGIs $50k-75k, 1.1% for AGIs $75k-100k, 1.8% for AGIs over 100k)
Total tax: $6,856 (reported on 82.3% of returns)
03825:
$6,856
State:
$8,835
(% of AGI for various income ranges: 2.7% for AGIs below $10k, 5.2% for AGIs $10k-25k, 7.8% for AGIs $25k-50k, 9.0% for AGIs $50k-75k, 10.7% for AGIs $75k-100k, 16.7% for AGIs over 100k)
Earned income credit: $1,408 (reported on 9.0% of returns)
Here:
$1,408
State:
$1,447
Percentage of individuals using paid preparers for their 2004 taxes: 46.6%
Here:
47%
State:
51%
(% for various income ranges: 32.6% for AGIs below $10k, 44.6% for AGIs $10k-25k, 53.5% for AGIs $25k-50k, 48.5% for AGIs $50k-75k, 47.1% for AGIs $75k-100k, 53.0% for AGIs over 100k)
Household received Food Stamps/SNAP in the past 12 months: 121 Household did not receive Food Stamps/SNAP in the past 12 months: 3,347
Women who had a birth in the past 12 months: 98 (36 now married, 71 unmarried) Women who did not have a birth in the past 12 months: 1,941 (1,060 now married, 886 unmarried)
Housing units in zip code 03825 with a mortgage: 1,758 (114 second mortgage, 120 both second mortgage and home equity loan) Houses without a mortgage: 131
Median monthly owner costs for units with a mortgage: $2,195 Median monthly owner costs for units without a mortgage: $860
Residents with income below the poverty level in 2022:
This zip code:
5.4%
Whole state:
7.2%
Residents with income below 50% of the poverty level in 2022:
This zip code:
3.4%
Whole state:
3.7%
Median number of rooms in houses and condos:
Here:
5.9
State:
6.4
Median number of rooms in apartments:
Here:
4.8
State:
4.0
Notable locations in this zip code not listed on our city pages
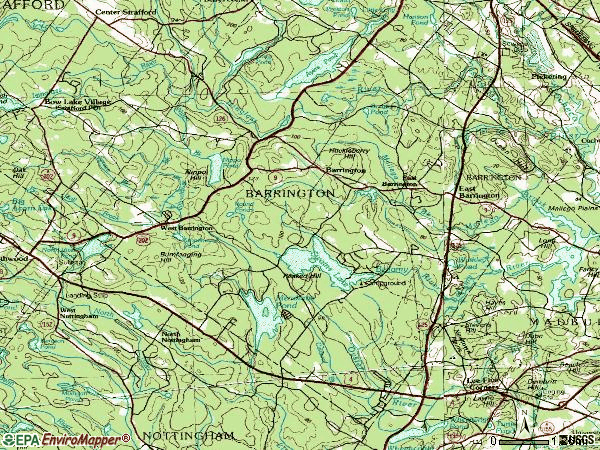
Notable locations in zip code 03825: Ayers Lake Campground (A), Camp Don Bosco (B), Len Kay Camping Area (C), Camp Speedwell (D), Nippo Lake Golf Club (E), Nippo Lake Ski Touring Center (F), Barrington Ambulance Service (G), Barrington Fire and Rescue (H). Display/hide their locations on the map
Churches in zip code 03825 include: Gerrish Chapel (A), Green Hill Chapel (B), First Congregational Church (C), Barrington Evangelical Church (D), Canaan Chapel (E), Chapel of the Nativity (F). Display/hide their locations on the map
Cemeteries: Clark Cemetery (1), Locke Cemetery (2), Pine Grove Cemetery (3), Capon Cemetery (4), Evans Cemetery (5). Display/hide their locations on the map
Lakes and reservoirs: Hale Pond (A), Little Long Pond (B), Long Pond (C), Creek Pond (D), Cate Pond (E), Round Pond (F), Round Ponds (G), Winkley Pond (H). Display/hide their locations on the map
Streams, rivers, and creeks: Stonehouse Brook (A), Spruce Brook (B), Wentworth Brook (C), Pierce Brook (D), Nippo Brook (E), Hall Brook (F), Green Hill Brook (G), Drew Brook (H), Calef Brook (I). Display/hide their locations on the map
Size of family households: 1,265 2-persons, 500 3-persons, 462 4-persons, 265 5-persons, 45 6-persons, 67 7-or-more-persons
Size of nonfamily households: 633 1-person, 217 2-persons, 3 3-persons
1,344 married couples with children.
375 single-parent households (195 men, 180 women).
98.2% of residents of 03825 zip code speak English at home.
0.5% of residents speak other Indo-European language at home (80% very well, 9% well, 11% not well).
0.3% of residents speak Asian or Pacific Island language at home (100% very well).
0.4% of residents speak other language at home (100% very well).
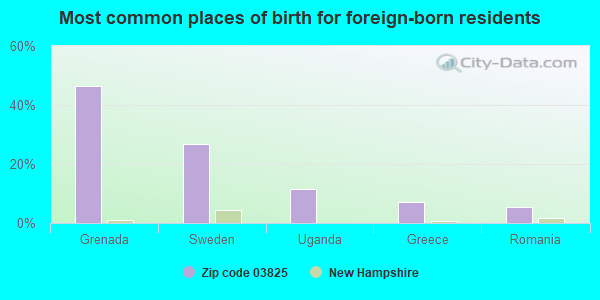
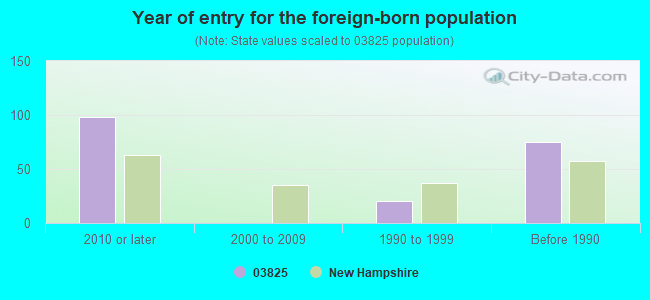
Foreign born population: 112 (1.2%) (26.2% of them are naturalized citizens)
This zip code:
1.2%
Whole state:
6.2%
46%Grenada
27%Sweden
12%Uganda
7%Greece
5%Romania
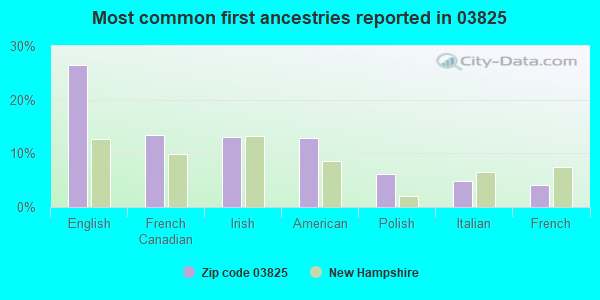
26%English
13%French Canadian
13%Irish
13%American
6%Polish
5%Italian
4%French
Year of entry for the foreign-born population
982010 or later
02000 to 2009
201990 to 1999
75Before 1990
Major facilities with environmental interests located in this zip code:
BARRINGTON FAMILY PRACTICE & URGENT CARE (425 RTE 125 in BARRINGTON, NH)
STATE MASTER (New Hampshire water, air, and waste tracking) - HAZARDOUS WASTE PROGRAM, DRINKING WATER SYSTEM (Resource Conservation and Recovery Act (tracking hazardous waste)) Organizations: FRISBIE MEMORIAL HOSPITAL (CONTACT/OPERATOR)
, FRISBIE FOUNDATION (CONTACT/OWNER)
Alternative names: BARRINGTON FAMILY PRACTICE & URGENT CARE CENTER
BARRINGTON MIDDLE SCHOOL (37 PROVINCE LANE in BARRINGTON, NH)
COMPLIANCE ACTIVITY (Tracking inspections of insecticide, fungicide, and rodenticide, and toxic substances) (National Center for Education Statistics) - STATE ID-87403303322030 Organizations: BARRINGTON SCHOOL DISTRICT (SCHOOL DISTRICT)
Alternative names: BARRINGTON MIDDLE SCHOOL ANNEXE, BARRINGTON MIDDLE SCHOOL ANNEX
EASTERN POWER EQUIPMENT (285 RTE 9 in BARRINGTON, NH)
STATE MASTER (New Hampshire water, air, and waste tracking) - HAZARDOUS WASTE PROGRAM (Resource Conservation and Recovery Act (tracking hazardous waste))
SAGEBRUSH VETERINARY HEALTHCARE PC (417 RTE 125 in BARRINGTON, NH)
STATE MASTER (New Hampshire water, air, and waste tracking) - HAZARDOUS WASTE PROGRAM Conditionally Exempt Small Quantity Generators, less than 100 kg/month of hazardous waste (Resource Conservation and Recovery Act (tracking hazardous waste)) Organizations: CANUSA PROPERTIES LLC (CONTACT/OPERATOR)
BARRINGTON ELEMENTARY SCHOOL (347 STATE ROUTE 125 in BARRINGTON, NH)
COMPLIANCE ACTIVITY (Tracking inspections of insecticide, fungicide, and rodenticide, and toxic substances) (National Center for Education Statistics) - STATE ID-87403303322045 Organizations: BARRINGTON SCHOOL DISTRICT (SCHOOL DISTRICT)
BINGHAM JACK STUDIO (181 SCRUTON POND RD in BARRINGTON, NH)
HAZARDOUS WASTE BIENNIAL REPORTER (Resource Conservation and Recovery Act (tracking hazardous waste)) (Resource Conservation and Recovery Act (tracking hazardous waste))
BARRINGTON TOWN OF (244 BEAUTY HILL RD in BARRINGTON, NH)
HAZARDOUS WASTE BIENNIAL REPORTER (Resource Conservation and Recovery Act (tracking hazardous waste)) (Resource Conservation and Recovery Act (tracking hazardous waste))
STEVES ACCURATE AUTOMOTIVE REPAIR (14 B CALEF HWY in BARRINGTON, NH)
(Resource Conservation and Recovery Act (tracking hazardous waste)) Business NAICS classification: GENERAL AUTOMOTIVE REPAIR. Organizations: JODY PERSSON (CONTACT/OWNER)
PERSSON AUTO BODY (14A RTE 125 in BARRINGTON, NH)
HAZARDOUS WASTE BIENNIAL REPORTER (Resource Conservation and Recovery Act (tracking hazardous waste)) (Resource Conservation and Recovery Act (tracking hazardous waste)) Business NAICS classification: AUTOMOTIVE BODY, PAINT, AND INTERIOR REPAIR AND MAINTENANCE. Alternative names: PERSSON AUTOBODY
BAY STATE CARBIDE CORP (CHAMPMAN DR in ROCHESTER, NH)
(Resource Conservation and Recovery Act (tracking hazardous waste)) Alternative names: BAY STATE CARBIDE PRODUCTS CORP
BELL ATLANTIC (SECOND CROWN PT RD in BARRINGTON, NH)
(Resource Conservation and Recovery Act (tracking hazardous waste))
Housing units lacking complete plumbing facilities: 2.6% Housing units lacking complete kitchen facilities: 0.2%
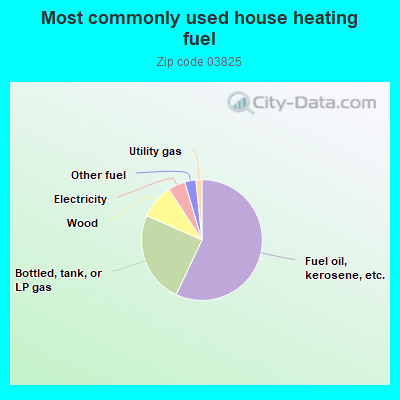
57.1%Fuel oil, kerosene, etc.
24.6%Bottled, tank, or LP gas
9.2%Wood
4.6%Electricity
3.0%Other fuel
1.6%Utility gas
Population in 1990: 5,842. Population change in the 1990s: +1,117 (+19.1%).
Place of birth for U.S.-born residents:
This state: 4,984
Northeast: 3,234
Midwest: 287
South: 457
West: 303
61% of the 03825 zip code residents lived in the same house 5 years ago. Out of people who lived in different houses, 46% lived in this county. Out of people who lived in different counties, 50% lived in New Hampshire.
95% of the 03825 zip code residents lived in the same house 1 year ago. Out of people who lived in different houses, 41% moved from this county. Out of people who lived in different houses, 18% moved from different county within same state. Out of people who lived in different houses, 41% moved from different state. Out of people who lived in different houses, 10% moved from abroad.
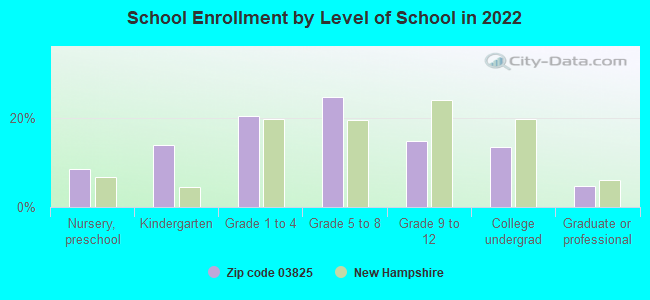
Private vs. public school enrollment:
Students in private schools in grades 1 to 8 (elementary and middle school): 162
Here:
17.0%
New Hampshire:
11.4%
Students in private schools in grades 9 to 12 (high school): 10
Here:
3.5%
New Hampshire:
14.0%
Students in private undergraduate colleges: 83
Here:
29.9%
New Hampshire:
38.0%
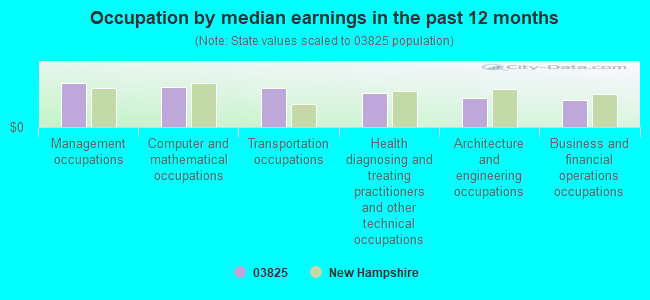
Occupation by median earnings in the past 12 months ($)
103,288Management occupations
94,386Computer and mathematical occupations
91,863Transportation occupations
80,084Health diagnosing and treating practitioners and other technical occupations
67,539Architecture and engineering occupations
64,301Business and financial operations occupations
Companies with federal contracts located in this zip code:
SEAN BOYLE GENERAL CONTRACTOR (2 BOYLE LANE in BARRINGTON, NH; small business) : $20,825 in 2 contractsfrom 2004 to 2006
$14,975 with Navy for Maintenance, Repair or Alteration of Real Property -- Miscellaneous Buildings. Taking place in ME. Signed on 2006-03-22. Completion date: 2006-09-29.
$5,850, same as above.Signed on 2004-02-10. Completion date: 2004-03-01.
PAUL SACCOCCIA (6 JAMES HENRY DRIVE in BARRINGTON, NH; small business)
$4,301 with Navy for Maintenance, Repair or Alteration of Real Property -- Other Non-Building Facilities. Signed on 2001-09-07. Completion date: 2001-09-28.
Top industries in this zip code by the number of employees in 2005:
Health Care and Social Assistance: Offices of Physicians (except Mental Health Specialists) (20-49 employees: 2 establishments, 10-19 employees: 2 establishments, 5-9 employees: 1 establishment, 1-4 employees: 1 establishment)
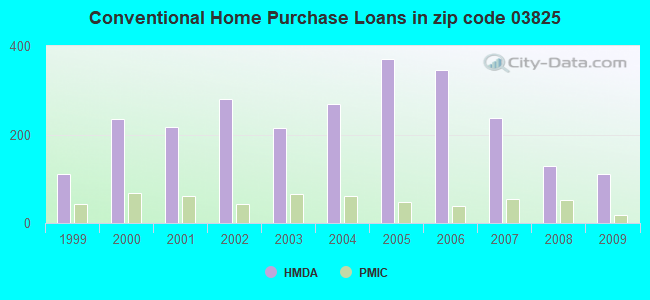
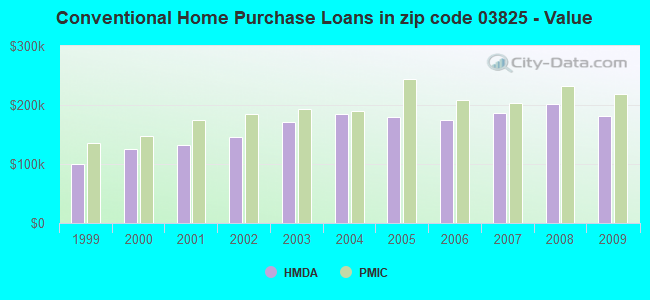
Detailed PMIC statistics for the following Tracts:0850.00
2002 - 2018 National Fire Incident Reporting System (NFIRS) incidents
According to the data from the years 2002 - 2018 the average number of fire incidents per year is 17. The highest number of fires - 41 took place in 2018, and the least - 0 in 2004. The data has a growing trend.
When looking into fire subcategories, the most reports belonged to: Structure Fires (61.8%), and Outside Fires (20.1%).
Fire incident types reported to NFIRS in Zip Code 03825


 Nearest zip codes: 03839, 03861, 03867, 03823, 03291, 03290.


 According to the data from the years 2002 - 2018 the average number of fire incidents per year is 17. The highest number of fires - 41 took place in 2018, and the least - 0 in 2004. The data has a growing trend.
 When looking into fire subcategories, the most reports belonged to: Structure Fires (61.8%), and Outside Fires (20.1%).