Estimated zip code population in 2022: 2,007 Zip code population in 2010: 1,680 Zip code population in 2000: 1,551
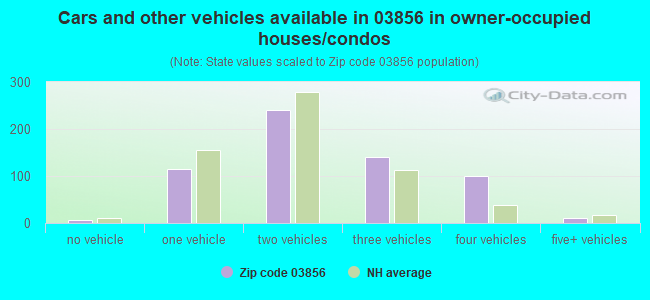
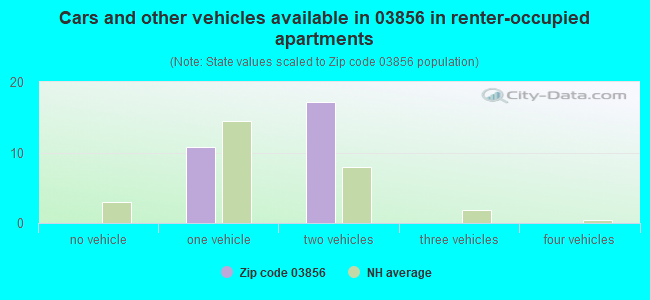
Houses and condos: 655 Renter-occupied apartments: 28
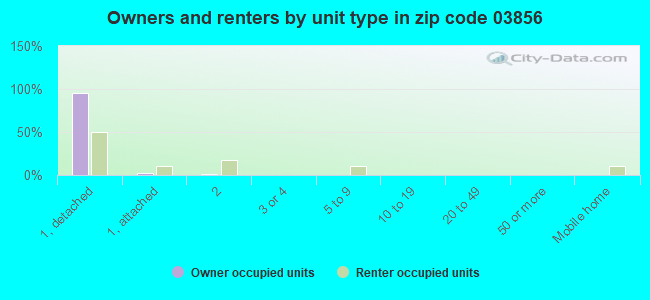
% of renters here:
4%
State:
28%
March 2022 cost of living index in zip code 03856: 113.9 (more than average, U.S. average is 100)
Land area: 7.1 sq. mi. Water area: 0.2 sq. mi.
Population density: 283 people per square mile
(very low).
OSM Map
Google Map
MSN Map
OSM Map
General Map
Google Map
MSN Map
OSM Map
Google Map
MSN Map
OSM Map
Google Map
MSN Map
Please wait while loading the map...
Real estate property taxes paid for housing units in 2022:
This zip code:
1.5% ($9,745)
New Hampshire:
1.6% ($6,209)
Median real estate property taxes paid for housing units with mortgages in 2022: $9,721 (1.5%) Median real estate property taxes paid for housing units with no mortgage in 2022: $9,820 (1.5%)
Business Search- 14 Million verified businesses
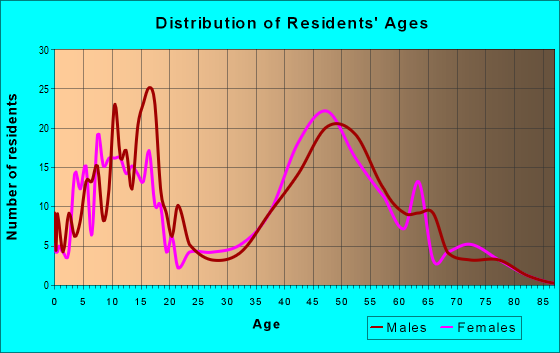
Males: 1,140
(56.8%)
Females: 866
(43.2%)
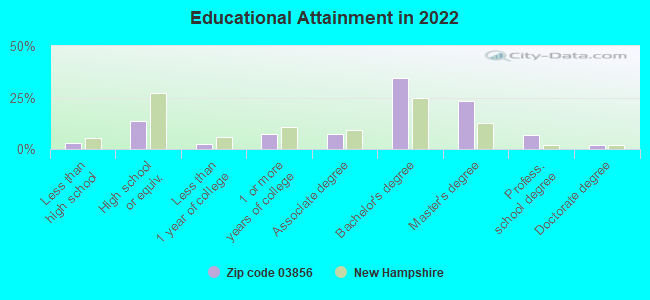
For population 25 years and over in 03856:
High school or higher: 98.3%
Bachelor's degree or higher: 67.1%
Graduate or professional degree: 32.0%
Unemployed: 1.8%
Mean travel time to work (commute): 27.4 minutes
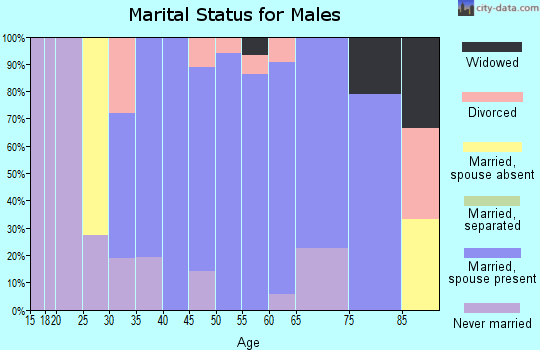
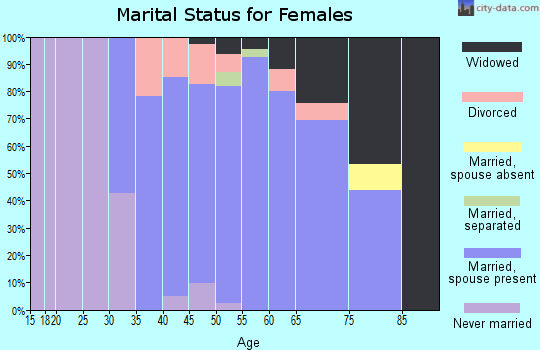
For population 15 years and over in 03856:
Never married: 27.7%
Now married: 61.3%
Separated: 0.4%
Widowed: 2.6%
Divorced: 8.1%
Zip code 03856 compared to state average:
Median household income above state average.
Median house value above state average.
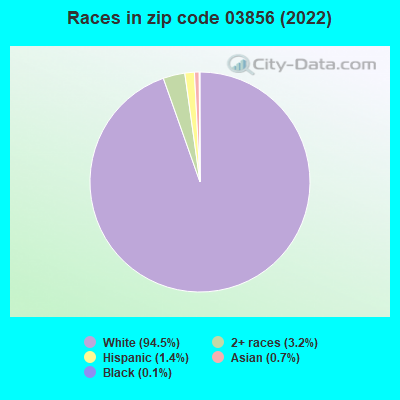
Black race population percentage significantly below state average.
Hispanic race population percentage significantly below state average.
Foreign-born population percentage significantly below state average.
Renting percentage significantly below state average.
Length of stay since moving in significantly above state average.
Number of rooms per house above state average.
Percentage of population with a bachelor's degree or higher above state average.
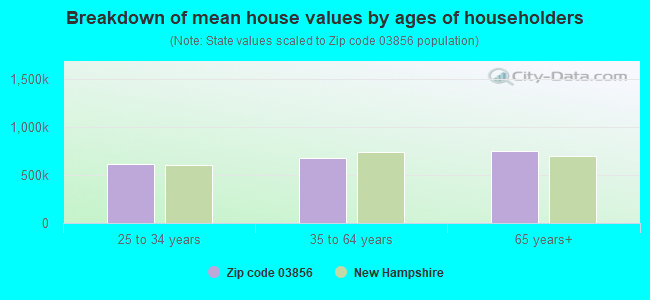
Estimated median house/condo value in 2022: $665,208
03856:
$665,208
New Hampshire:
$384,700
Median resident age:
This zip code:
45.3 years
New Hampshire median age:
43.3 years
Average household size:
This zip code:
3.1 people
New Hampshire:
2.4 people
Averages for the 2020 tax year for zip code 03856, filed in 2021:
Average Adjusted Gross Income (AGI) in 2020: $136,022 (Individual Income Tax Returns)
Here:
$136,022
State:
$88,845
Salary/wage: $112,234 (reported on 85.1% of returns)
Here:
$112,234
State:
$71,693
(% of AGI for various income ranges: 1426.9% for AGIs below $25k, 4110.9% for AGIs $25k-50k, 7526.7% for AGIs $50k-75k, 8652.5% for AGIs $75k-100k, 19631.8% for AGIs $100k-200k, 89730.0% for AGIs over 200k)
Taxable interest for individuals: $1,783 (reported on 50.0% of returns)
This zip code:
$1,783
New Hampshire:
$1,640
(% of AGI for various income ranges: 13.8% for AGIs below $25k, 13.6% for AGIs $25k-50k, 35.0% for AGIs $50k-75k, 22.5% for AGIs $75k-100k, 285.5% for AGIs $100k-200k, 768.3% for AGIs over 200k)
Ordinary dividends: $11,391 (reported on 35.1% of returns)
Here:
$11,391
State:
$8,258
(% of AGI for various income ranges: 23.1% for AGIs below $25k, 164.5% for AGIs $25k-50k, 53.3% for AGIs $50k-75k, 150.0% for AGIs $75k-100k, 730.0% for AGIs $100k-200k, 4421.7% for AGIs over 200k)
Net capital gain/loss in AGI: +$24,203 (reported on 33.0% of returns)
Here:
+$24,203
State:
+$28,952
(% of AGI for various income ranges: 40.0% for AGIs below $25k, 46.4% for AGIs $25k-50k, 211.7% for AGIs $50k-75k, 770.9% for AGIs $100k-200k, 10708.3% for AGIs over 200k)
Profit/loss from business: +$27,289 (reported on 20.2% of returns)
Here:
+$27,289
State:
+$24,424
(% of AGI for various income ranges: 240.8% for AGIs below $25k, 151.8% for AGIs $25k-50k, 1078.3% for AGIs $50k-75k, 1668.2% for AGIs $100k-200k, 3705.0% for AGIs over 200k)
Taxable individual retirement arrangement distribution: $25,255 (reported on 11.7% of returns)
03856:
$25,255
New Hampshire:
$21,952
(% of AGI for various income ranges: 1008.3% for AGIs $50k-75k, 953.6% for AGIs $100k-200k, 1873.3% for AGIs over 200k)
Total itemized deductions: $28,825 (reported on 17.0% of returns)
Here:
$28,825
State:
$32,702
(% of AGI for various income ranges: 1586.7% for AGIs $50k-75k, 1123.6% for AGIs $100k-200k, 4040.0% for AGIs over 200k)
Charity contributions: $4,475 (reported on 12.8% of returns)
Here:
$4,475
State:
$9,866
(% of AGI for various income ranges: 141.8% for AGIs $100k-200k, 635.0% for AGIs over 200k)
Taxes paid: $8,800 (reported on 17.0% of returns)
03856:
$8,800
State:
$8,247
(% of AGI for various income ranges: 536.7% for AGIs $50k-75k, 311.8% for AGIs $100k-200k, 1238.3% for AGIs over 200k)
Earned income credit: $1,640 (reported on 5.3% of returns)
Here:
$1,640
State:
$1,831
(% of AGI for various income ranges: 63.1% for AGIs below $25k)
Percentage of individuals using paid preparers for their 2020 taxes: 90.4%
Here:
90%
State:
92%
(% for various income ranges: 82.6% for AGIs below $25k, 93.3% for AGIs $25k-50k, 100.0% for AGIs $50k-75k, 85.7% for AGIs $75k-100k, 90.5% for AGIs $100k-200k, 94.7% for AGIs over 200k)
Averages for the 2012 tax year for zip code 03856, filed in 2013:
Average Adjusted Gross Income (AGI) in 2012: $103,630 (Individual Income Tax Returns)
Here:
$103,630
State:
$66,185
Salary/wage: $91,663 (reported on 87.6% of returns)
Here:
$91,663
State:
$55,674
(% of AGI for various income ranges: 83.3% for AGIs below $25k, 76.0% for AGIs $25k-50k, 69.9% for AGIs $50k-75k, 76.0% for AGIs $75k-100k, 82.1% for AGIs $100k-200k, 75.6% for AGIs over 200k)
Taxable interest for individuals: $1,618 (reported on 42.7% of returns)
This zip code:
$1,618
New Hampshire:
$1,674
(% of AGI for various income ranges: 1.4% for AGIs below $25k, 1.8% for AGIs $25k-50k, 0.2% for AGIs $50k-75k, 0.3% for AGIs $75k-100k, 0.5% for AGIs $100k-200k, 0.7% for AGIs over 200k)
Ordinary dividends: $6,193 (reported on 33.7% of returns)
Here:
$6,193
State:
$6,774
(% of AGI for various income ranges: 2.7% for AGIs below $25k, 3.1% for AGIs $25k-50k, 2.1% for AGIs $50k-75k, 1.1% for AGIs $75k-100k, 1.8% for AGIs $100k-200k, 2.1% for AGIs over 200k)
Net capital gain/loss in AGI: +$15,774 (reported on 25.8% of returns)
Here:
+$15,774
State:
+$13,759
(% of AGI for various income ranges: 1.5% for AGIs $100k-200k, 7.2% for AGIs over 200k)
Profit/loss from business: +$25,705 (reported on 21.3% of returns)
Here:
+$25,705
State:
+$19,298
(% of AGI for various income ranges: 7.8% for AGIs below $25k, 10.6% for AGIs $25k-50k, 7.0% for AGIs $50k-75k, 8.0% for AGIs $75k-100k, 6.0% for AGIs $100k-200k, 3.5% for AGIs over 200k)
Taxable individual retirement arrangement distribution: $17,710 (reported on 11.2% of returns)
03856:
$17,710
New Hampshire:
$16,908
(% of AGI for various income ranges: 4.8% for AGIs below $25k, 5.6% for AGIs $50k-75k, 1.8% for AGIs $100k-200k, 1.9% for AGIs over 200k)
Self-employment retirement plans: $17,900 (reported on 2.2% of returns)
03856:
$17,900
New Hampshire:
$18,791
(% of AGI for various income ranges: 5.2% for AGIs $75k-100k)
Total itemized deductions: $25,722 (16% of AGI, reported on 51.7% of returns)
Here:
$25,722
State:
$22,617
Here:
15.5% of AGI
State:
18.1% of AGI
(% of AGI for various income ranges: 21.6% for AGIs $25k-50k, 18.7% for AGIs $50k-75k, 19.0% for AGIs $75k-100k, 16.0% for AGIs $100k-200k, 9.1% for AGIs over 200k)
Charity contributions: $2,540 (reported on 39.3% of returns)
Here:
$2,540
State:
$2,860
(% of AGI for various income ranges: 0.8% for AGIs $25k-50k, 1.0% for AGIs $50k-75k, 1.7% for AGIs $75k-100k, 1.2% for AGIs $100k-200k, 0.8% for AGIs over 200k)
Taxes paid: $11,743 (reported on 51.7% of returns)
03856:
$11,743
State:
$8,830
(% of AGI for various income ranges: 9.1% for AGIs $25k-50k, 7.6% for AGIs $50k-75k, 7.9% for AGIs $75k-100k, 7.5% for AGIs $100k-200k, 4.3% for AGIs over 200k)
Earned income credit: $1,580 (reported on 5.6% of returns)
Here:
$1,580
State:
$1,863
(% of AGI for various income ranges: 2.9% for AGIs below $25k)
Percentage of individuals using paid preparers for their 2012 taxes: 52.8%
Here:
53%
State:
45%
(% for various income ranges: 42.9% for AGIs below $25k, 46.2% for AGIs $25k-50k, 62.5% for AGIs $50k-75k, 50.0% for AGIs $75k-100k, 55.0% for AGIs $100k-200k, 75.0% for AGIs over 200k)
Averages for the 2004 tax year for zip code 03856, filed in 2005:
Average Adjusted Gross Income (AGI) in 2004: $73,483 (Individual Income Tax Returns)
Here:
$73,483
State:
$54,348
Salary/wage: $69,633 (reported on 83.8% of returns)
Here:
$69,633
State:
$46,966
(% of AGI for various income ranges: 86.9% for AGIs below $10k, 65.1% for AGIs $10k-25k, 76.5% for AGIs $25k-50k, 77.9% for AGIs $50k-75k, 76.3% for AGIs $75k-100k, 81.6% for AGIs over 100k)
Taxable interest for individuals: $1,107 (reported on 61.4% of returns)
This zip code:
$1,107
New Hampshire:
$1,634
(% of AGI for various income ranges: 4.0% for AGIs below $10k, 2.0% for AGIs $10k-25k, 1.8% for AGIs $25k-50k, 0.9% for AGIs $50k-75k, 0.6% for AGIs $75k-100k, 0.8% for AGIs over 100k)
Taxable dividends: $2,488 (reported on 39.2% of returns)
Here:
$2,488
State:
$3,855
(% of AGI for various income ranges: 6.1% for AGIs below $10k, 1.3% for AGIs $10k-25k, 1.7% for AGIs $25k-50k, 1.0% for AGIs $50k-75k, 1.1% for AGIs $75k-100k, 1.3% for AGIs over 100k)
Net capital gain/loss: +$10,242 (reported on 28.7% of returns)
Here:
+$10,242
State:
+$13,739
(% of AGI for various income ranges: -4.2% for AGIs below $10k, 0.9% for AGIs $10k-25k, -0.2% for AGIs $25k-50k, 0.4% for AGIs $50k-75k, 0.4% for AGIs $75k-100k, 6.4% for AGIs over 100k)
Profit/loss from business: +$23,245 (reported on 21.3% of returns)
Here:
+$23,245
State:
+$16,641
(% of AGI for various income ranges: 18.1% for AGIs $10k-25k, 8.6% for AGIs $25k-50k, 10.1% for AGIs $50k-75k, 9.2% for AGIs $75k-100k, 4.7% for AGIs over 100k)
IRA payment deduction: $3,188 (reported on 4.3% of returns)
03856:
$3,188
New Hampshire:
$3,013
Self-employed pension: $9,500 (reported on 2.1% of returns)
Here:
$9,500
New Hampshire:
$13,003
Total itemized deductions: $22,081 (20% of AGI, reported on 52.7% of returns)
Here:
$22,081
State:
$18,832
Here:
19.6% of AGI
State:
19.6% of AGI
(% of AGI for various income ranges: 14.3% for AGIs $10k-25k, 16.5% for AGIs $25k-50k, 19.3% for AGIs $50k-75k, 19.3% for AGIs $75k-100k, 14.6% for AGIs over 100k)
Charity contributions deductions: $2,087 (2% of AGI, reported on 47.7% of returns)
Here:
$2,087
State:
$2,473
Here:
1.8% of AGI
State:
2.4% of AGI
(% of AGI for various income ranges: 1.0% for AGIs $10k-25k, 0.7% for AGIs $25k-50k, 1.9% for AGIs $50k-75k, 2.0% for AGIs $75k-100k, 1.3% for AGIs over 100k)
Total tax: $12,297 (reported on 83.7% of returns)
03856:
$12,297
State:
$8,835
(% of AGI for various income ranges: 3.5% for AGIs below $10k, 6.9% for AGIs $10k-25k, 8.0% for AGIs $25k-50k, 9.2% for AGIs $50k-75k, 10.2% for AGIs $75k-100k, 17.2% for AGIs over 100k)
Earned income credit: $921 (reported on 5.1% of returns)
Here:
$921
State:
$1,447
Percentage of individuals using paid preparers for their 2004 taxes: 51.7%
Here:
52%
State:
51%
(% for various income ranges: 32.5% for AGIs below $10k, 46.2% for AGIs $10k-25k, 53.2% for AGIs $25k-50k, 54.5% for AGIs $50k-75k, 55.2% for AGIs $75k-100k, 63.2% for AGIs over 100k)
Household received Food Stamps/SNAP in the past 12 months: 16 Household did not receive Food Stamps/SNAP in the past 12 months: 632
Women who had a birth in the past 12 months: 6 (5 now married, 0 unmarried) Women who did not have a birth in the past 12 months: 351 (211 now married, 140 unmarried)
Housing units in zip code 03856 with a mortgage: 454 (89 second mortgage, 84 both second mortgage and home equity loan) Houses without a mortgage: 9
Median monthly owner costs for units with a mortgage: $2,755 Median monthly owner costs for units without a mortgage: $1,390
Residents with income below the poverty level in 2022:
This zip code:
1.1%
Whole state:
7.2%
Residents with income below 50% of the poverty level in 2022:
This zip code:
0.6%
Whole state:
3.7%
Median number of rooms in houses and condos:
Here:
7.6
State:
6.4
Median number of rooms in apartments:
Here:
4.8
State:
4.0
Notable locations in this zip code not listed on our city pages
Size of family households: 181 2-persons, 142 3-persons, 140 4-persons, 62 5-persons, 11 7-or-more-persons
Size of nonfamily households: 100 1-person, 11 2-persons
316 married couples with children.
36 single-parent households (23 men, 13 women).
97.5% of residents of 03856 zip code speak English at home.
1.1% of residents speak Spanish at home (100% very well).
0.7% of residents speak other Indo-European language at home (86% very well, 14% well).
0.1% of residents speak other language at home (100% very well).
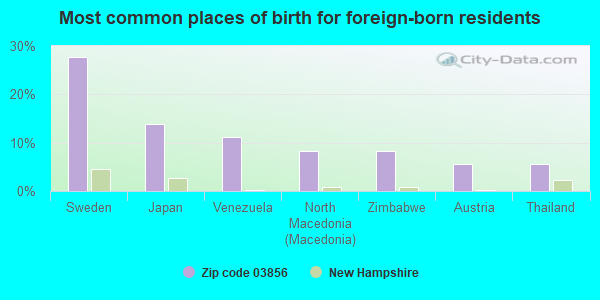
Foreign born population: 37 (1.9%) (70.3% of them are naturalized citizens)
This zip code:
1.9%
Whole state:
6.2%
28%Sweden
14%Japan
11%Venezuela
8%North Macedonia (Macedonia)
8%Zimbabwe
6%Austria
6%Thailand
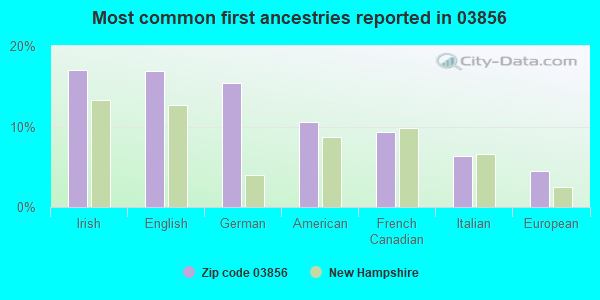
17%Irish
17%English
15%German
11%American
9%French Canadian
6%Italian
4%European
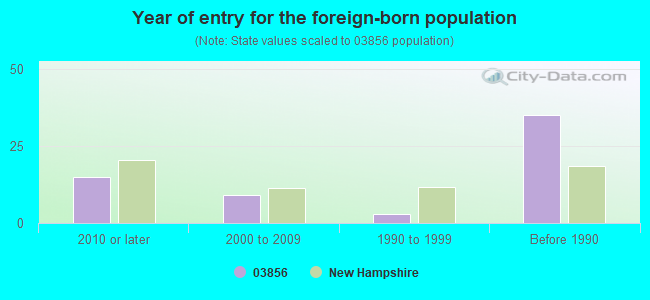
Year of entry for the foreign-born population
152010 or later
92000 to 2009
31990 to 1999
35Before 1990
Facilities with environmental interests located in this zip code:
COLLEGE AUTO & TRUCK (31 RTE 108 in NEWFIELDS, NH)
STATE MASTER (New Hampshire water, air, and waste tracking) - HAZARDOUS WASTE PROGRAM (Resource Conservation and Recovery Act (tracking hazardous waste))
CO-ED SPORTSWEAR INC (27 PLEASANT ST in NEWFIELDS, NH)
HAZARDOUS WASTE BIENNIAL REPORTER (Resource Conservation and Recovery Act (tracking hazardous waste)) Small Quantity Generators, between 100 kg and 1000 kg of hazardous waste/month (Resource Conservation and Recovery Act (tracking hazardous waste)) Business NAICS classification: BROADWOVEN FABRIC FINISHING MILLS. Organizations: MARK LANE (CONTACT/OPERATOR)
STRATHAM VETERINARY PRACTICE (RTE 108 in NEWFIELDS, NH)
HAZARDOUS WASTE BIENNIAL REPORTER (Resource Conservation and Recovery Act (tracking hazardous waste)) (Resource Conservation and Recovery Act (tracking hazardous waste))
US DEPT OF DEFENSE (16 SWAMSCOTT ST in NEWFIELDS, NH)
HAZARDOUS WASTE BIENNIAL REPORTER (Resource Conservation and Recovery Act (tracking hazardous waste)) (Resource Conservation and Recovery Act (tracking hazardous waste))
OHTOO RACING ENTERPRISES INC (392 PISCASSIC RD in NEWFIELDS, NH)
Conditionally Exempt Small Quantity Generators, less than 100 kg/month of hazardous waste (Resource Conservation and Recovery Act (tracking hazardous waste)) - notification HAZARDOUS WASTE BIENNIAL REPORTER (Resource Conservation and Recovery Act (tracking hazardous waste)) Business NAICS classification: OTHER AUTOMOTIVE MECHANICAL AND ELECTRICAL REPAIR AND MAINTENANCE. Organizations: WILLIAM CHICK (CONTACT/OPERATOR)
PRINTED MATTER INC (27 PLEASANT ST in NEWFIELDS, NH)
HAZARDOUS WASTE BIENNIAL REPORTER (Resource Conservation and Recovery Act (tracking hazardous waste)) (Resource Conservation and Recovery Act (tracking hazardous waste)) Business NAICS classification: OTHER COMMERCIAL PRINTING.
B R BUILDERS (88 BALD HILL RD in NEWFIELDS, NH)
(Resource Conservation and Recovery Act (tracking hazardous waste))
CHAPMAN RAY RESIDENCE (27 RTE 108 in NEWFIELDS, NH)
(Resource Conservation and Recovery Act (tracking hazardous waste))
CHICK DOUG CO (216 PISCASSIC RD in NEWFIELDS, NH)
(Resource Conservation and Recovery Act (tracking hazardous waste))
WATSON PAUL RESIDENCE (62 HALLS MILL RD in NEWFIELDS, NH)
(Resource Conservation and Recovery Act (tracking hazardous waste))
NYNEX (BALD HILL RD in NEWFIELDS, NH)
(Resource Conservation and Recovery Act (tracking hazardous waste))
STRATHAM NEWFIELD VETERINARY HOSPITAL (8 MAIN ST in NEWFIELDS, NH)
Conditionally Exempt Small Quantity Generators, less than 100 kg/month of hazardous waste (Resource Conservation and Recovery Act (tracking hazardous waste)) Organizations: SONNYA DENNIS (CONTACT/OWNER)
Housing units lacking complete plumbing facilities: 1.4%
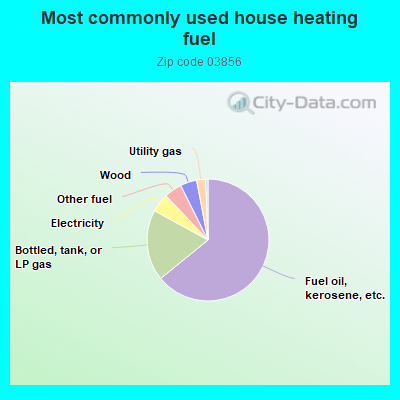
64.4%Fuel oil, kerosene, etc.
18.9%Bottled, tank, or LP gas
5.0%Electricity
4.7%Other fuel
4.4%Wood
2.4%Utility gas
0.6%Coal or coke
Place of birth for U.S.-born residents:
This state: 769
Northeast: 889
Midwest: 118
South: 124
West: 36
58% of the 03856 zip code residents lived in the same house 5 years ago. Out of people who lived in different houses, 47% lived in this county. Out of people who lived in different counties, 50% lived in New Hampshire.
98% of the 03856 zip code residents lived in the same house 1 year ago. Out of people who lived in different houses, 58% moved from this county. Out of people who lived in different houses, 21% moved from different county within same state. Out of people who lived in different houses, 52% moved from different state.
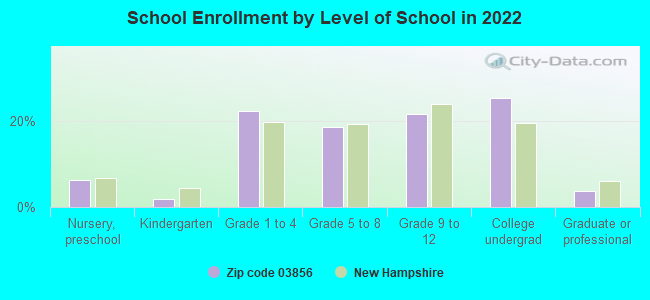
Private vs. public school enrollment:
Students in private schools in grades 1 to 8 (elementary and middle school): 61
Here:
31.7%
New Hampshire:
11.4%
Students in private schools in grades 9 to 12 (high school): 32
Here:
30.6%
New Hampshire:
14.0%
Students in private undergraduate colleges: 107
Here:
82.2%
New Hampshire:
38.0%
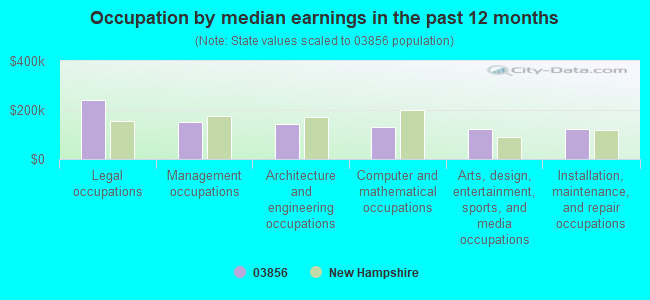
Occupation by median earnings in the past 12 months ($)
239,764Legal occupations
151,198Management occupations
143,515Architecture and engineering occupations
132,220Computer and mathematical occupations
124,388Arts, design, entertainment, sports, and media occupations
120,614Installation, maintenance, and repair occupations
Companies with federal contracts located in this zip code:
INERT CORPORATION (16 SWAMSCOTT STREET in NEWFIELDS, NH; small business) : $3,621,248 in 13 contractsfrom 2001 to 2002
Contracts for Preparation and Disposal of Excess and Surplus Property by Defense Logistics Agency Signed by year:2000: $0; 2001: $2,618,749; 2002: $1,002,499; 2003: $0; 2004: $0; 2005: $0; 2006: $0.
Biggest contracts:
$1,557,517 with Defense Logistics Agency for Preparation and Disposal of Excess and Surplus Property. Signed on 2001-03-20. Completion date: 2001-09-30.
$496,019, same as above.Signed on 2001-06-05. Completion date: 2001-09-30.
$412,039, same as above.Signed on 2002-04-18. Completion date: 2002-04-18.
$378,460, same as above.Signed on 2002-04-18. Completion date: 2002-05-28.
IMBODY, INC (167 EXETER RD in NEWFIELDS, NH; small business) : $6,381 in 3 contractsfrom 2003 to 2004
$3,029 with Navy for Drugs and Biologicals. Signed on 2004-01-29. Completion date: 2004-02-04.
$2,856 with Navy for Medical and Surgical Instruments, Equipment, and Supplies. Signed on 2003-12-29. Completion date: 2003-12-27.
$496 with Navy for Drugs and Biologicals. Signed on 2004-02-11. Completion date: 2004-02-04.
HUTCHINSON SEALING SYSTEMS INC (171 ROUTE 85 in NEWFIELDS, NH)
$3,543 with Air Force for O-Ring. Signed on 2005-05-31. Completion date: 2005-07-25.
Top industries in this zip code by the number of employees in 2005:
Administrative and Support and Waste Management and Remediation Services: Temporary Help Services (100-249 employees: 1 establishment, 1-4 employees: 1 establishment)
Accommodation and Food Services: Full-Service Restaurants (20-49: 1, 10-19: 1)
Wholesale Trade: Men's and Boys' Clothing and Furnishings Merchant Wholesalers (20-49: 1)
Health Care and Social Assistance: Child Day Care Services (10-19: 2, 1-4: 1)
Professional, Scientific, and Technical Services: Veterinary Services (10-19: 1)
Other Services (except Public Administration): Pet Care (except Veterinary) Services (5-9: 1)
Home Mortgage Disclosure Act Aggregated Statistics For Year 2009 (Based on 2 partial tracts)
A) FHA, FSA/RHS & VA Home Purchase Loans
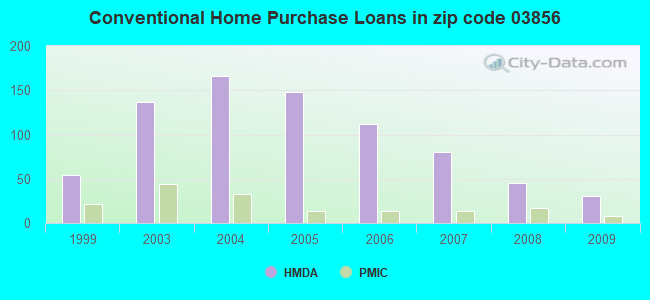
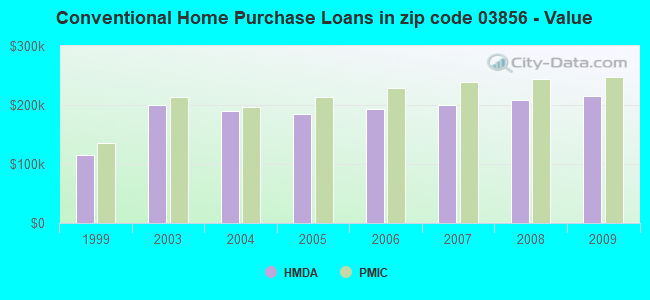
B) Conventional Home Purchase Loans
C) Refinancings
D) Home Improvement Loans
F) Non-occupant Loans on < 5 Family Dwellings (A B C & D)
G) Loans On Manufactured Home Dwelling (A B C & D)
Number
Average Value
Number
Average Value
Number
Average Value
Number
Average Value
Number
Average Value
Number
Average Value
LOANS ORIGINATED
24
$238,237
31
$214,634
192
$228,533
9
$121,194
6
$219,670
4
$111,398
APPLICATIONS APPROVED, NOT ACCEPTED
2
$112,005
2
$150,295
12
$222,997
0
$0
0
$0
0
$0
APPLICATIONS DENIED
2
$307,510
11
$155,811
69
$223,023
6
$87,842
6
$139,297
6
$74,943
APPLICATIONS WITHDRAWN
3
$231,347
2
$254,565
43
$256,353
2
$305,070
1
$127,890
2
$116,080
FILES CLOSED FOR INCOMPLETENESS
2
$188,175
1
$140,930
9
$196,861
1
$343,760
0
$0
2
$43,175
Aggregated Statistics For Year 2008 (Based on 2 partial tracts)
A) FHA, FSA/RHS & VA Home Purchase Loans
B) Conventional Home Purchase Loans
C) Refinancings
D) Home Improvement Loans
E) Loans on Dwellings For 5+ Families
F) Non-occupant Loans on < 5 Family Dwellings (A B C & D)
G) Loans On Manufactured Home Dwelling (A B C & D)
Number
Average Value
Number
Average Value
Number
Average Value
Number
Average Value
Number
Average Value
Number
Average Value
Number
Average Value
LOANS ORIGINATED
8
$257,922
45
$207,669
96
$225,390
16
$48,927
3
$286,197
7
$166,760
2
$79,830
APPLICATIONS APPROVED, NOT ACCEPTED
0
$0
7
$171,299
20
$194,323
2
$81,865
0
$0
2
$120,560
0
$0
APPLICATIONS DENIED
1
$260,670
8
$148,766
48
$192,568
7
$46,781
0
$0
1
$109,160
2
$64,760
APPLICATIONS WITHDRAWN
0
$0
7
$178,979
32
$274,215
1
$12,220
0
$0
2
$145,815
1
$33,400
FILES CLOSED FOR INCOMPLETENESS
0
$0
0
$0
4
$235,012
0
$0
0
$0
0
$0
0
$0
Aggregated Statistics For Year 2007 (Based on 2 partial tracts)
A) FHA, FSA/RHS & VA Home Purchase Loans
B) Conventional Home Purchase Loans
C) Refinancings
D) Home Improvement Loans
F) Non-occupant Loans on < 5 Family Dwellings (A B C & D)
G) Loans On Manufactured Home Dwelling (A B C & D)
Number
Average Value
Number
Average Value
Number
Average Value
Number
Average Value
Number
Average Value
Number
Average Value
LOANS ORIGINATED
2
$225,645
80
$199,720
95
$174,239
33
$40,385
7
$141,973
2
$71,685
APPLICATIONS APPROVED, NOT ACCEPTED
0
$0
9
$182,742
15
$163,680
6
$45,888
1
$255,780
1
$163,730
APPLICATIONS DENIED
1
$152,330
10
$217,009
54
$187,976
14
$47,596
1
$247,640
2
$72,090
APPLICATIONS WITHDRAWN
0
$0
7
$208,071
34
$210,215
3
$100,740
0
$0
2
$92,865
FILES CLOSED FOR INCOMPLETENESS
0
$0
1
$149,890
7
$245,194
0
$0
0
$0
1
$166,990
Aggregated Statistics For Year 2006 (Based on 2 partial tracts)
A) FHA, FSA/RHS & VA Home Purchase Loans
B) Conventional Home Purchase Loans
C) Refinancings
D) Home Improvement Loans
E) Loans on Dwellings For 5+ Families
F) Non-occupant Loans on < 5 Family Dwellings (A B C & D)
G) Loans On Manufactured Home Dwelling (A B C & D)
Number
Average Value
Number
Average Value
Number
Average Value
Number
Average Value
Number
Average Value
Number
Average Value
Number
Average Value
LOANS ORIGINATED
1
$166,180
112
$193,846
155
$171,513
39
$50,046
2
$5,127,905
16
$222,997
8
$59,670
APPLICATIONS APPROVED, NOT ACCEPTED
0
$0
8
$187,154
12
$229,446
5
$55,718
0
$0
0
$0
1
$27,700
APPLICATIONS DENIED
0
$0
15
$166,613
50
$196,237
12
$57,904
0
$0
4
$135,428
2
$52,950
APPLICATIONS WITHDRAWN
0
$0
9
$177,673
44
$203,724
6
$68,155
0
$0
2
$127,080
0
$0
FILES CLOSED FOR INCOMPLETENESS
0
$0
2
$158,030
14
$260,323
1
$48,880
0
$0
2
$179,210
0
$0
Aggregated Statistics For Year 2005 (Based on 2 partial tracts)
A) FHA, FSA/RHS & VA Home Purchase Loans
B) Conventional Home Purchase Loans
C) Refinancings
D) Home Improvement Loans
E) Loans on Dwellings For 5+ Families
F) Non-occupant Loans on < 5 Family Dwellings (A B C & D)
G) Loans On Manufactured Home Dwelling (A B C & D)
Number
Average Value
Number
Average Value
Number
Average Value
Number
Average Value
Number
Average Value
Number
Average Value
Number
Average Value
LOANS ORIGINATED
2
$182,880
148
$184,848
179
$172,090
37
$83,618
2
$613,395
17
$186,352
9
$44,893
APPLICATIONS APPROVED, NOT ACCEPTED
0
$0
11
$177,805
28
$163,560
3
$29,870
0
$0
0
$0
1
$48,880
APPLICATIONS DENIED
0
$0
23
$138,943
55
$150,968
16
$56,615
0
$0
7
$137,784
10
$39,019
APPLICATIONS WITHDRAWN
1
$170,250
21
$152,796
53
$191,185
2
$131,965
0
$0
7
$135,340
2
$97,750
FILES CLOSED FOR INCOMPLETENESS
0
$0
5
$143,696
15
$217,824
2
$109,970
0
$0
0
$0
2
$36,250
Aggregated Statistics For Year 2004 (Based on 2 partial tracts)
A) FHA, FSA/RHS & VA Home Purchase Loans
B) Conventional Home Purchase Loans
C) Refinancings
D) Home Improvement Loans
E) Loans on Dwellings For 5+ Families
F) Non-occupant Loans on < 5 Family Dwellings (A B C & D)
G) Loans On Manufactured Home Dwelling (A B C & D)
Number
Average Value
Number
Average Value
Number
Average Value
Number
Average Value
Number
Average Value
Number
Average Value
Number
Average Value
LOANS ORIGINATED
5
$232,486
166
$189,571
196
$178,501
29
$92,780
2
$968,150
19
$164,077
10
$38,775
APPLICATIONS APPROVED, NOT ACCEPTED
0
$0
18
$203,469
16
$168,826
6
$62,588
0
$0
1
$141,740
1
$131,970
APPLICATIONS DENIED
2
$156,810
19
$104,955
37
$124,480
19
$47,418
0
$0
3
$108,613
10
$36,738
APPLICATIONS WITHDRAWN
0
$0
11
$239,715
67
$179,188
7
$76,689
1
$280,220
3
$156,673
0
$0
FILES CLOSED FOR INCOMPLETENESS
0
$0
4
$233,180
13
$169,186
1
$24,440
0
$0
1
$162,920
0
$0
Aggregated Statistics For Year 2003 (Based on 2 partial tracts)
A) FHA, FSA/RHS & VA Home Purchase Loans
B) Conventional Home Purchase Loans
C) Refinancings
D) Home Improvement Loans
E) Loans on Dwellings For 5+ Families
F) Non-occupant Loans on < 5 Family Dwellings (A B C & D)
Number
Average Value
Number
Average Value
Number
Average Value
Number
Average Value
Number
Average Value
Number
Average Value
LOANS ORIGINATED
1
$169,440
137
$200,790
494
$165,745
20
$40,608
3
$1,744,603
20
$156,484
APPLICATIONS APPROVED, NOT ACCEPTED
1
$282,670
15
$211,416
41
$157,516
3
$36,657
0
$0
1
$154,770
APPLICATIONS DENIED
1
$343,760
20
$139,663
84
$165,645
17
$36,801
0
$0
3
$153,687
APPLICATIONS WITHDRAWN
0
$0
11
$167,955
59
$172,612
2
$46,840
0
$0
0
$0
FILES CLOSED FOR INCOMPLETENESS
0
$0
2
$233,385
13
$182,909
0
$0
0
$0
0
$0
Aggregated Statistics For Year 1999 (Based on 1 partial tract)
A) FHA, FSA/RHS & VA Home Purchase Loans
B) Conventional Home Purchase Loans
C) Refinancings
D) Home Improvement Loans
E) Loans on Dwellings For 5+ Families
F) Non-occupant Loans on < 5 Family Dwellings (A B C & D)


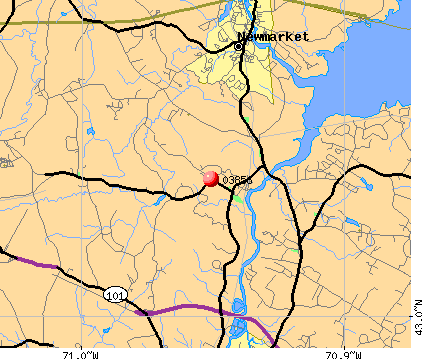 Nearest zip codes: 03857, 03833, 03885, 03861, 03824, 03042.