Estimated zip code population in 2022: 437 Zip code population in 2010: 608 Zip code population in 2000: 513
Houses and condos: 264 Renter-occupied apartments: 36
% of renters here:
19%
State:
26%
March 2022 cost of living index in zip code 04024: 88.2 (less than average, U.S. average is 100)
Land area: 15.8 sq. mi. Water area: 0.2 sq. mi.
Population density: 28 people per square mile
(very low).
OSM Map
Google Map
MSN Map
OSM Map
General Map
Google Map
MSN Map
OSM Map
Google Map
MSN Map
OSM Map
Google Map
MSN Map
Please wait while loading the map...
Real estate property taxes paid for housing units in 2022:
This zip code:
0.9% ($2,292)
Maine:
1.0% ($2,785)
Median real estate property taxes paid for housing units with mortgages in 2022: $2,020 (0.8%) Median real estate property taxes paid for housing units with no mortgage in 2022: $2,519 (1.0%)
Business Search- 14 Million verified businesses
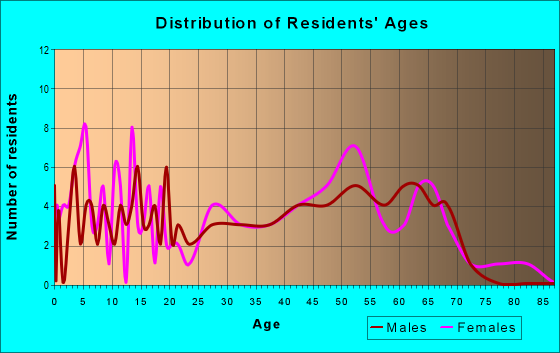
Males: 211
(48.2%)
Females: 226
(51.8%)
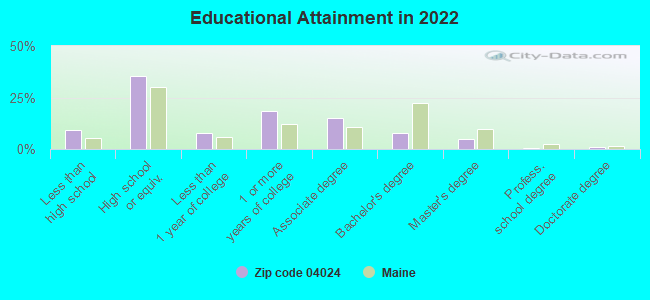
For population 25 years and over in 04024:
High school or higher: 89.0%
Bachelor's degree or higher: 13.9%
Graduate or professional degree: 6.1%
Mean travel time to work (commute): 40.5 minutes
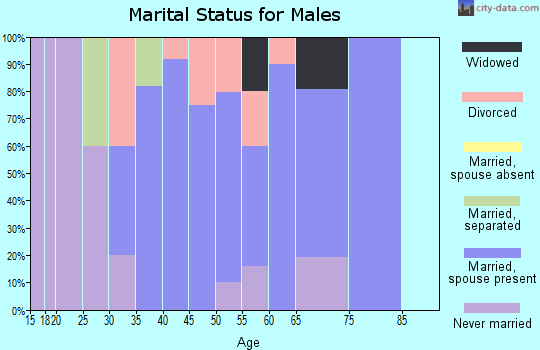
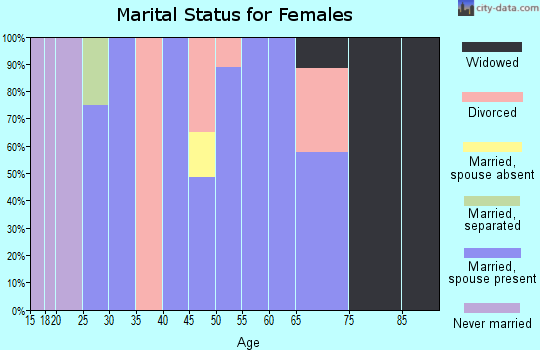
For population 15 years and over in 04024:
Never married: 32.1%
Now married: 47.3%
Separated: 0.0%
Widowed: 8.7%
Divorced: 12.0%
Zip code 04024 compared to state average:
Unemployed percentage significantly below state average.
Black race population percentage significantly below state average.
Hispanic race population percentage below state average.
Median age significantly above state average.
Foreign-born population percentage below state average.
Length of stay since moving in significantly above state average.
Percentage of population with a bachelor's degree or higher significantly below state average.
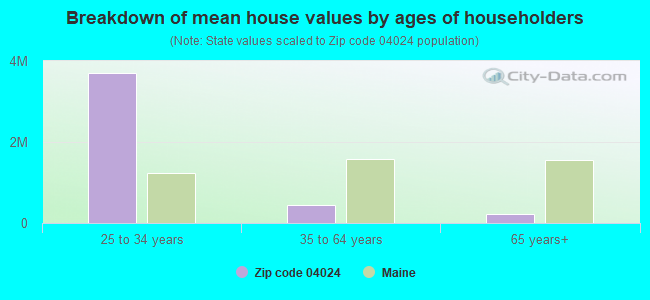
Estimated median house/condo value in 2022: $268,164
04024:
$268,164
Maine:
$290,600
Median resident age:
This zip code:
53.9 years
Maine median age:
45.1 years
Average household size:
This zip code:
2.3 people
Maine:
2.2 people
Averages for the 2020 tax year for zip code 04024, filed in 2021:
Average Adjusted Gross Income (AGI) in 2020: $53,143 (Individual Income Tax Returns)
Here:
$53,143
State:
$68,227
Salary/wage: $46,928 (reported on 83.3% of returns)
Here:
$46,928
State:
$55,127
(% of AGI for various income ranges: 1228.0% for AGIs below $25k, 4168.6% for AGIs $25k-50k, 4915.0% for AGIs $50k-75k, 18615.0% for AGIs $100k-200k)
Taxable interest for individuals: $375 (reported on 26.7% of returns)
This zip code:
$375
Maine:
$1,162
(% of AGI for various income ranges: 22.9% for AGIs $25k-50k, 11.7% for AGIs $50k-75k, 35.0% for AGIs $100k-200k)
Ordinary dividends: $300 (reported on 10.0% of returns)
Here:
$300
State:
$7,695
(% of AGI for various income ranges: 12.9% for AGIs $25k-50k)
Net capital gain/loss in AGI: +$4,950 (reported on 6.7% of returns)
Here:
+$4,950
State:
+$22,201
(% of AGI for various income ranges: 141.4% for AGIs $25k-50k)
Profit/loss from business: +$9,300 (reported on 13.3% of returns)
Here:
+$9,300
State:
+$15,095
(% of AGI for various income ranges: 744.0% for AGIs below $25k)
Taxable individual retirement arrangement distribution: $12,350 (reported on 6.7% of returns)
04024:
$12,350
Maine:
$18,314
(% of AGI for various income ranges: 494.0% for AGIs below $25k)
Earned income credit: $1,400 (reported on 13.3% of returns)
Here:
$1,400
State:
$1,960
(% of AGI for various income ranges: 112.0% for AGIs below $25k)
Percentage of individuals using paid preparers for their 2020 taxes: 93.3%
Here:
93%
State:
92%
(% for various income ranges: 87.5% for AGIs below $25k, 100.0% for AGIs $25k-50k, 133.3% for AGIs $50k-75k, 0.0% for AGIs $75k-100k, 75.0% for AGIs $100k-200k)
Averages for the 2012 tax year for zip code 04024, filed in 2013:
Average Adjusted Gross Income (AGI) in 2012: $40,117 (Individual Income Tax Returns)
Here:
$40,117
State:
$52,375
Salary/wage: $36,400 (reported on 90.0% of returns)
Here:
$36,400
State:
$43,415
(% of AGI for various income ranges: 72.4% for AGIs below $25k, 89.5% for AGIs $25k-50k, 76.4% for AGIs $50k-75k, 82.9% for AGIs $75k-100k)
Taxable interest for individuals: $229 (reported on 23.3% of returns)
This zip code:
$229
Maine:
$1,221
Ordinary dividends: $333 (reported on 10.0% of returns)
Here:
$333
State:
$5,812
Profit/loss from business: +$5,233 (reported on 10.0% of returns)
Here:
+$5,233
State:
+$12,144
Taxable individual retirement arrangement distribution: $8,450 (reported on 6.7% of returns)
04024:
$8,450
Maine:
$13,385
Total itemized deductions: $14,844 (25% of AGI, reported on 30.0% of returns)
Here:
$14,844
State:
$21,859
Here:
24.5% of AGI
State:
20.9% of AGI
(% of AGI for various income ranges: 10.4% for AGIs $25k-50k, 13.2% for AGIs $50k-75k, 14.6% for AGIs $75k-100k)
Charity contributions: $1,520 (reported on 16.7% of returns)
Here:
$1,520
State:
$2,741
Taxes paid: $5,222 (reported on 30.0% of returns)
04024:
$5,222
State:
$9,996
(% of AGI for various income ranges: 3.2% for AGIs $25k-50k, 4.1% for AGIs $50k-75k, 5.9% for AGIs $75k-100k)
Earned income credit: $2,000 (reported on 16.7% of returns)
Here:
$2,000
State:
$1,959
(% of AGI for various income ranges: 4.2% for AGIs below $25k, 1.0% for AGIs $25k-50k)
Percentage of individuals using paid preparers for their 2012 taxes: 53.3%
Here:
53%
State:
48%
(% for various income ranges: 41.7% for AGIs below $25k, 55.6% for AGIs $25k-50k, 60.0% for AGIs $50k-75k, 75.0% for AGIs $75k-100k)
Averages for the 2004 tax year for zip code 04024, filed in 2005:
Average Adjusted Gross Income (AGI) in 2004: $35,287 (Individual Income Tax Returns)
Here:
$35,287
State:
$42,606
Salary/wage: $31,774 (reported on 86.7% of returns)
Here:
$31,774
State:
$36,376
(% of AGI for various income ranges: 78.9% for AGIs below $10k, 77.9% for AGIs $10k-25k, 78.1% for AGIs $25k-50k, 84.6% for AGIs $50k-75k, 71.8% for AGIs $75k-100k)
Taxable interest for individuals: $475 (reported on 34.6% of returns)
This zip code:
$475
Maine:
$1,367
(% of AGI for various income ranges: 3.6% for AGIs below $10k, 0.7% for AGIs $10k-25k, 0.6% for AGIs $25k-50k, 0.1% for AGIs $50k-75k, 0.2% for AGIs $75k-100k)
Taxable dividends: $390 (reported on 14.3% of returns)
Here:
$390
State:
$3,533
Net capital gain/loss: +$1,700 (reported on 10.5% of returns)
Here:
+$1,700
State:
+$11,433
Profit/loss from business: +$14,146 (reported on 14.3% of returns)
Here:
+$14,146
State:
+$10,755
Total itemized deductions: $13,512 (24% of AGI, reported on 28.7% of returns)
Here:
$13,512
State:
$18,231
Here:
24.3% of AGI
State:
21.7% of AGI
(% of AGI for various income ranges: 7.8% for AGIs $10k-25k, 11.5% for AGIs $25k-50k, 12.8% for AGIs $50k-75k, 11.3% for AGIs $75k-100k)
Charity contributions deductions: $1,138 (2% of AGI, reported on 22.7% of returns)
Here:
$1,138
State:
$2,466
Here:
2.1% of AGI
State:
2.8% of AGI
Total tax: $3,665 (reported on 82.5% of returns)
04024:
$3,665
State:
$6,047
(% of AGI for various income ranges: 1.5% for AGIs below $10k, 4.8% for AGIs $10k-25k, 8.0% for AGIs $25k-50k, 9.5% for AGIs $50k-75k, 11.5% for AGIs $75k-100k)
Earned income credit: $1,220 (reported on 14.3% of returns)
Here:
$1,220
State:
$1,520
Percentage of individuals using paid preparers for their 2004 taxes: 53.5%
Here:
53%
State:
53%
(% for various income ranges: 37.5% for AGIs below $10k, 50.0% for AGIs $10k-25k, 51.0% for AGIs $25k-50k, 69.2% for AGIs $50k-75k, 78.3% for AGIs $75k-100k)
Household received Food Stamps/SNAP in the past 12 months: 16 Household did not receive Food Stamps/SNAP in the past 12 months: 174
Women who had a birth in the past 12 months: 12 (0 now married, 12 unmarried) Women who did not have a birth in the past 12 months: 43 (15 now married, 27 unmarried)
Housing units in zip code 04024 with a mortgage: 89 (26 second mortgage, 26 both second mortgage and home equity loan) Houses without a mortgage: 16
Median monthly owner costs for units with a mortgage: $1,443 Median monthly owner costs for units without a mortgage: $557
Residents with income below the poverty level in 2022:
This zip code:
7.3%
Whole state:
10.8%
Residents with income below 50% of the poverty level in 2022:
This zip code:
3.5%
Whole state:
5.8%
Median number of rooms in houses and condos:
Here:
5.2
State:
6.1
Median number of rooms in apartments:
Here:
4.9
State:
4.0
Notable locations in this zip code not listed on our city pages
Size of family households: 61 2-persons, 10 3-persons, 17 4-persons, 6 5-persons, 3 6-persons, 11 7-or-more-persons
Size of nonfamily households: 46 1-person, 35 2-persons
42 married couples with children.
15 single-parent households (15 men).
99.8% of residents of 04024 zip code speak English at home.
0.5% of residents speak other Indo-European language at home (100% very well).
Foreign born population: 10 (2.3%) (100.0% of them are naturalized citizens)
This zip code:
2.3%
Whole state:
4.1%
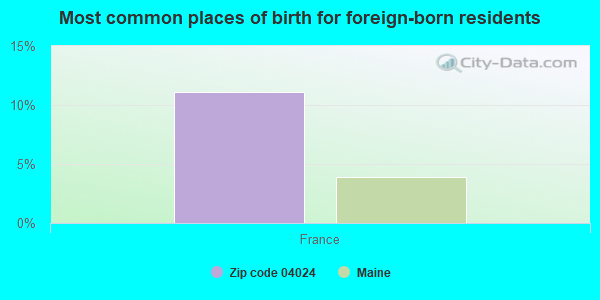
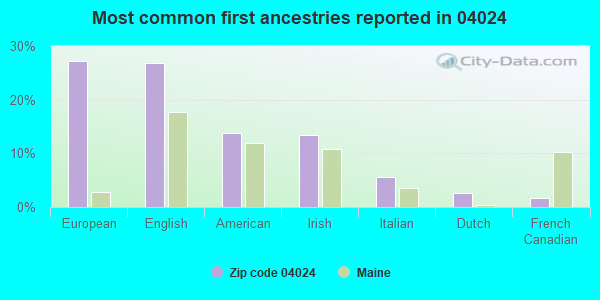
11%France
27%European
27%English
14%American
13%Irish
6%Italian
3%Dutch
2%French Canadian
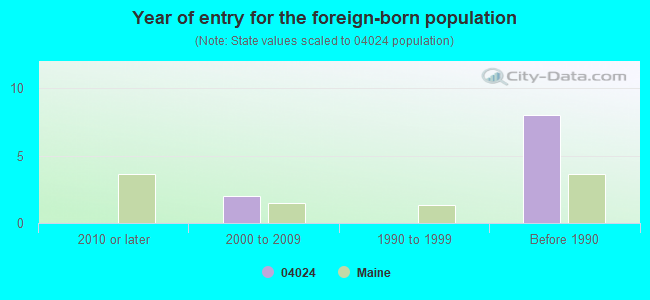
Year of entry for the foreign-born population
02010 or later
22000 to 2009
01990 to 1999
8Before 1990
Facilities with environmental interests located in this zip code:
CIMENT QUEBEC (EAST BALDWIN in E. BALDWIN, ME)
AIR MINOR (AIRS/AFS)
Housing units lacking complete plumbing facilities: 5.1% Housing units lacking complete kitchen facilities: 5.4%
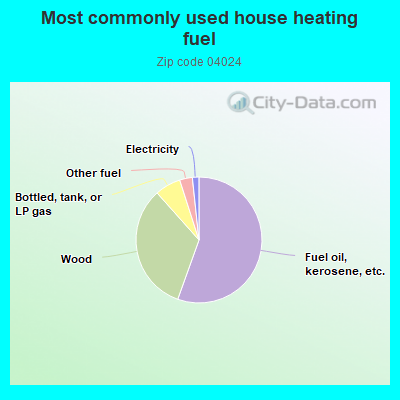
56.1%Fuel oil, kerosene, etc.
33.3%Wood
6.7%Bottled, tank, or LP gas
3.3%Other fuel
1.7%Electricity
Population in 1990: 976.
Place of birth for U.S.-born residents:
This state: 223
Northeast: 117
South: 30
West: 58
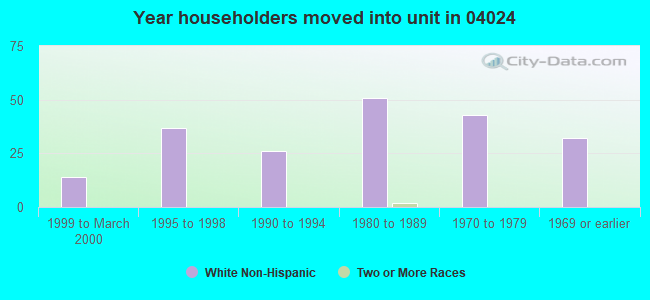
78% of the 04024 zip code residents lived in the same house 5 years ago. Out of people who lived in different houses, 56% lived in this county. Out of people who lived in different counties, 50% lived in Maine.
94% of the 04024 zip code residents lived in the same house 1 year ago. Out of people who lived in different houses, 35% moved from this county. Out of people who lived in different houses, 26% moved from different county within same state. Out of people who lived in different houses, 43% moved from different state.
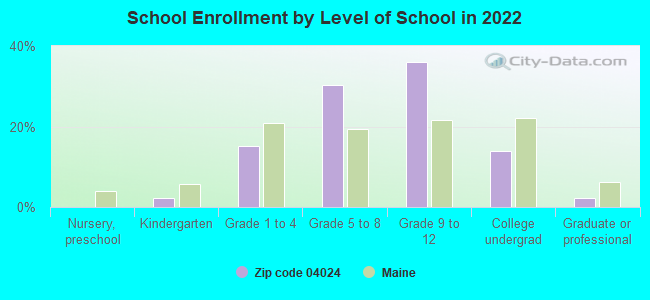
Private vs. public school enrollment:
Students in private schools in grades 1 to 8 (elementary and middle school): 19
Here:
47.2%
Maine:
12.7%
Students in private schools in grades 9 to 12 (high school): 25
Here:
79.1%
Maine:
12.6%
Students in private undergraduate colleges: 9
Here:
71.2%
Maine:
34.5%
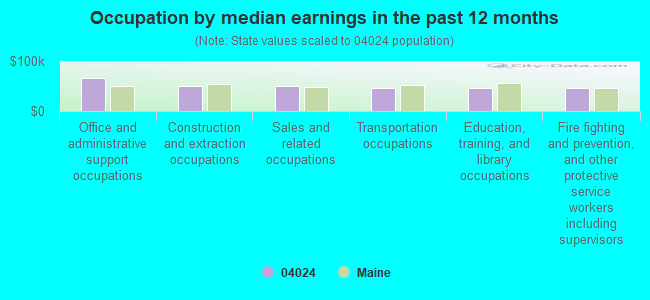
Occupation by median earnings in the past 12 months ($)
66,934Office and administrative support occupations
50,491Construction and extraction occupations
50,113Sales and related occupations
46,941Transportation occupations
45,539Education, training, and library occupations
45,433Fire fighting and prevention, and other protective service workers including supervisors
Top industries in this zip code by the number of employees in 2005:
Other Services (except Public Administration): General Automotive Repair (1-4 employees: 1 establishment)
Construction: Plumbing, Heating, and Air-Conditioning Contractors (1-4: 1)
Other Services (except Public Administration): Pet Care (except Veterinary) Services (1-4: 1)
Construction: Residential Remodelers (1-4: 1)
Information: Libraries and Archives (1-4: 1)
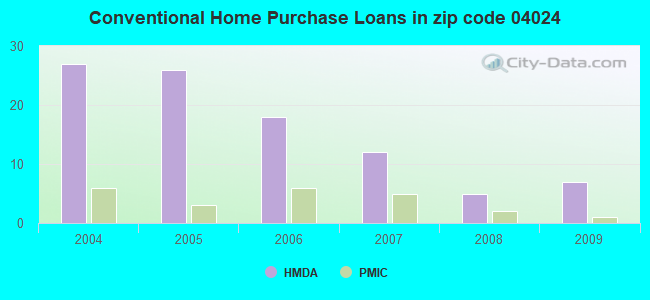
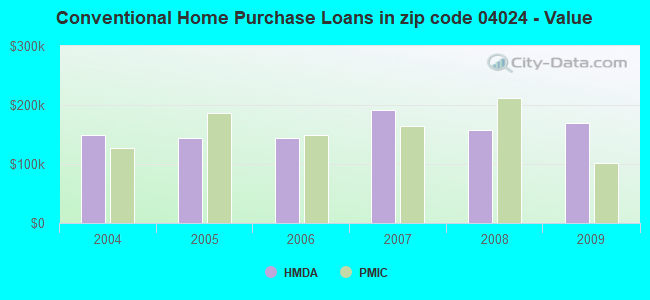
Home Mortgage Disclosure Act Aggregated Statistics For Year 2009 (Based on 2 partial tracts)
A) FHA, FSA/RHS & VA Home Purchase Loans
B) Conventional Home Purchase Loans
C) Refinancings
D) Home Improvement Loans
F) Non-occupant Loans on < 5 Family Dwellings (A B C & D)
G) Loans On Manufactured Home Dwelling (A B C & D)
Number
Average Value
Number
Average Value
Number
Average Value
Number
Average Value
Number
Average Value
Number
Average Value
LOANS ORIGINATED
7
$141,113
7
$169,256
38
$182,200
4
$55,272
9
$261,270
2
$97,120
APPLICATIONS APPROVED, NOT ACCEPTED
1
$131,860
1
$154,370
5
$152,946
1
$95,540
2
$186,345
0
$0
APPLICATIONS DENIED
1
$151,600
1
$138,970
17
$152,486
4
$99,688
4
$146,668
2
$59,415
APPLICATIONS WITHDRAWN
0
$0
0
$0
6
$202,467
0
$0
0
$0
0
$0
FILES CLOSED FOR INCOMPLETENESS
0
$0
0
$0
2
$117,255
0
$0
1
$187,530
0
$0
Aggregated Statistics For Year 2008 (Based on 2 partial tracts)
A) FHA, FSA/RHS & VA Home Purchase Loans
B) Conventional Home Purchase Loans
C) Refinancings
D) Home Improvement Loans
F) Non-occupant Loans on < 5 Family Dwellings (A B C & D)
G) Loans On Manufactured Home Dwelling (A B C & D)
Number
Average Value
Number
Average Value
Number
Average Value
Number
Average Value
Number
Average Value
Number
Average Value
LOANS ORIGINATED
2
$154,170
5
$157,288
29
$122,511
5
$109,676
8
$145,829
2
$87,845
APPLICATIONS APPROVED, NOT ACCEPTED
0
$0
2
$105,610
4
$111,432
1
$108,960
2
$106,200
1
$79,750
APPLICATIONS DENIED
0
$0
4
$107,385
24
$171,639
8
$72,545
5
$189,426
1
$80,140
APPLICATIONS WITHDRAWN
1
$138,970
0
$0
11
$188,140
0
$0
1
$172,530
0
$0
FILES CLOSED FOR INCOMPLETENESS
0
$0
0
$0
2
$149,430
1
$57,250
0
$0
0
$0
Aggregated Statistics For Year 2007 (Based on 2 partial tracts)
A) FHA, FSA/RHS & VA Home Purchase Loans
B) Conventional Home Purchase Loans
C) Refinancings
D) Home Improvement Loans
F) Non-occupant Loans on < 5 Family Dwellings (A B C & D)
G) Loans On Manufactured Home Dwelling (A B C & D)
Number
Average Value
Number
Average Value
Number
Average Value
Number
Average Value
Number
Average Value
Number
Average Value
LOANS ORIGINATED
2
$194,240
12
$191,938
33
$135,392
8
$48,856
8
$194,538
1
$106,990
APPLICATIONS APPROVED, NOT ACCEPTED
0
$0
3
$143,840
9
$162,613
2
$73,040
2
$101,660
0
$0
APPLICATIONS DENIED
1
$120,810
4
$114,392
25
$153,182
8
$67,215
6
$128,837
2
$127,915
APPLICATIONS WITHDRAWN
0
$0
3
$169,500
13
$206,662
1
$56,850
2
$121,995
0
$0
FILES CLOSED FOR INCOMPLETENESS
0
$0
0
$0
2
$78,170
0
$0
0
$0
0
$0
Aggregated Statistics For Year 2006 (Based on 2 partial tracts)
A) FHA, FSA/RHS & VA Home Purchase Loans
B) Conventional Home Purchase Loans
C) Refinancings
D) Home Improvement Loans
F) Non-occupant Loans on < 5 Family Dwellings (A B C & D)
G) Loans On Manufactured Home Dwelling (A B C & D)
Number
Average Value
Number
Average Value
Number
Average Value
Number
Average Value
Number
Average Value
Number
Average Value
LOANS ORIGINATED
1
$167,000
18
$143,619
43
$150,272
14
$42,384
8
$237,966
3
$94,357
APPLICATIONS APPROVED, NOT ACCEPTED
0
$0
5
$89,778
11
$173,748
0
$0
1
$421,250
0
$0
APPLICATIONS DENIED
1
$118,830
5
$120,492
33
$165,110
7
$51,380
3
$286,757
2
$86,660
APPLICATIONS WITHDRAWN
0
$0
3
$108,440
9
$141,294
3
$105,937
1
$131,470
0
$0
FILES CLOSED FOR INCOMPLETENESS
0
$0
2
$102,650
9
$133,706
0
$0
0
$0
0
$0
Aggregated Statistics For Year 2005 (Based on 2 partial tracts)
A) FHA, FSA/RHS & VA Home Purchase Loans
B) Conventional Home Purchase Loans
C) Refinancings
D) Home Improvement Loans
F) Non-occupant Loans on < 5 Family Dwellings (A B C & D)
G) Loans On Manufactured Home Dwelling (A B C & D)
Number
Average Value
Number
Average Value
Number
Average Value
Number
Average Value
Number
Average Value
Number
Average Value
LOANS ORIGINATED
2
$119,030
26
$144,770
58
$136,948
13
$46,222
11
$158,171
4
$94,850
APPLICATIONS APPROVED, NOT ACCEPTED
0
$0
1
$163,050
6
$117,058
2
$88,240
0
$0
0
$0
APPLICATIONS DENIED
0
$0
5
$161,236
34
$124,722
10
$35,808
2
$239,840
4
$89,322
APPLICATIONS WITHDRAWN
0
$0
1
$80,930
26
$144,148
2
$102,255
1
$101,460
1
$144,500
FILES CLOSED FOR INCOMPLETENESS
0
$0
0
$0
5
$150,892
0
$0
0
$0
0
$0
Aggregated Statistics For Year 2004 (Based on 2 partial tracts)
A) FHA, FSA/RHS & VA Home Purchase Loans
B) Conventional Home Purchase Loans
C) Refinancings
D) Home Improvement Loans
F) Non-occupant Loans on < 5 Family Dwellings (A B C & D)
G) Loans On Manufactured Home Dwelling (A B C & D)


 Nearest zip codes: 04091, 04029, 04049, 04085, 04084, 04020.