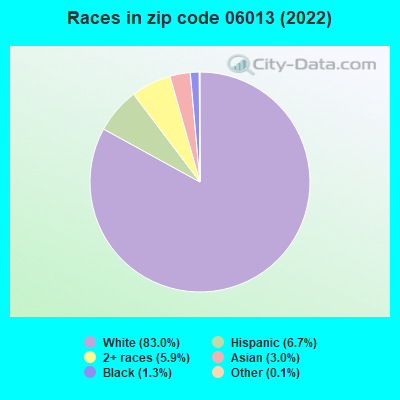
Estimated zip code population in 2022: 9,596 Zip code population in 2010: 9,326 Zip code population in 2000: 8,216
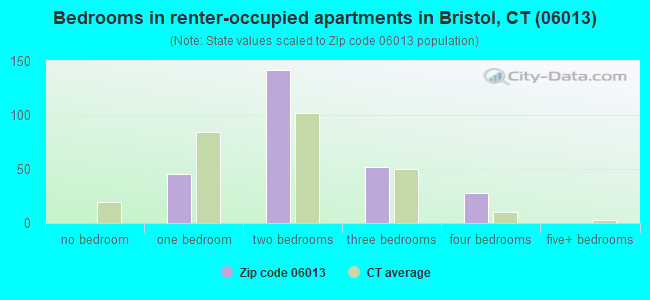
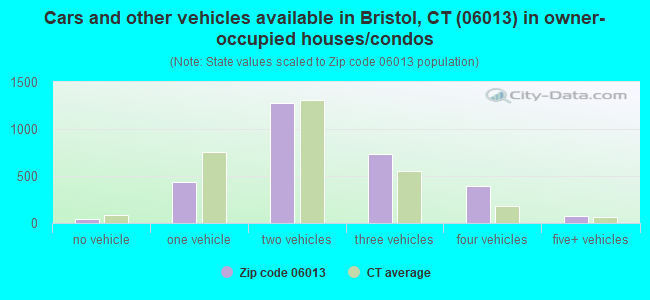
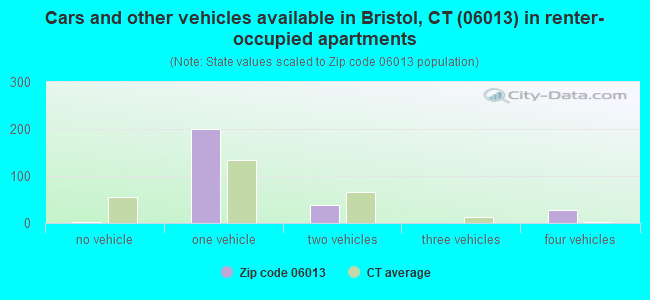
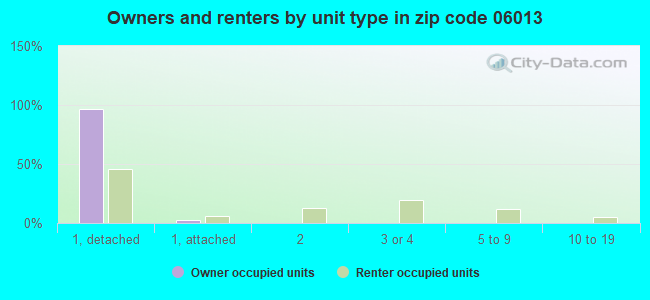
Houses and condos: 3,461 Renter-occupied apartments: 273
% of renters here:
8%
State:
34%
March 2022 cost of living index in zip code 06013: 97.0 (near average, U.S. average is 100)
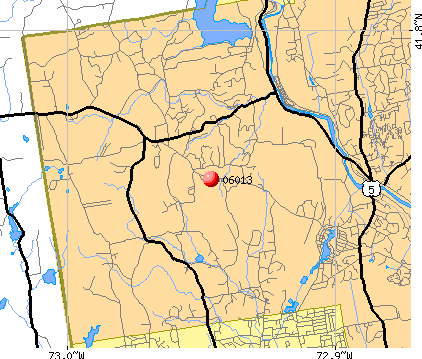
Land area: 29.8 sq. mi. Water area: 0.7 sq. mi.
Population density: 323 people per square mile
(very low).
OSM Map
Google Map
MSN Map
OSM Map
General Map
Google Map
MSN Map
OSM Map
Google Map
MSN Map
OSM Map
Google Map
MSN Map
Please wait while loading the map...
Real estate property taxes paid for housing units in 2022:
This zip code:
1.8% ($7,405)
Connecticut:
1.8% ($6,189)
Median real estate property taxes paid for housing units with mortgages in 2022: $7,496 (1.8%) Median real estate property taxes paid for housing units with no mortgage in 2022: $7,146 (1.9%)
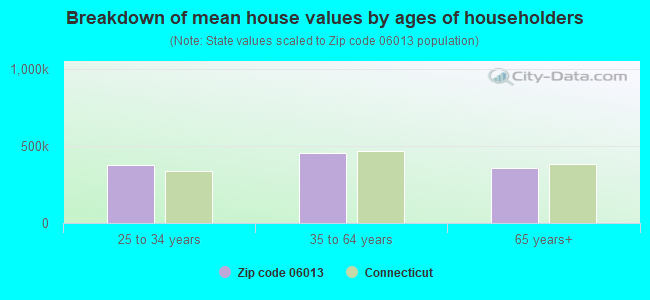
Estimated median house/condo value in 2022: $414,130
06013:
$414,130
Connecticut:
$347,200
According to our research of Connecticut and other state lists, there were 6 registered sex offenders living in 06013 zip code as of April 27, 2024. The ratio of all residents to sex offenders in zip code 06013 is 1,613 to 1. The ratio of registered sex offenders to all residents in this zip code is lower than the state average.
Median resident age:
This zip code:
39.0 years
Connecticut median age:
40.9 years
Average household size:
This zip code:
2.9 people
Connecticut:
2.5 people
Averages for the 2020 tax year for zip code 06013, filed in 2021:
Average Adjusted Gross Income (AGI) in 2020: $119,954 (Individual Income Tax Returns)
Here:
$119,954
State:
$105,931
Salary/wage: $108,315 (reported on 83.4% of returns)
Here:
$108,315
State:
$83,540
(% of AGI for various income ranges: 1079.5% for AGIs below $25k, 3190.7% for AGIs $25k-50k, 5914.4% for AGIs $50k-75k, 9131.6% for AGIs $75k-100k, 19357.3% for AGIs $100k-200k, 79708.1% for AGIs over 200k)
Taxable interest for individuals: $1,352 (reported on 46.8% of returns)
This zip code:
$1,352
Connecticut:
$3,402
(% of AGI for various income ranges: 21.2% for AGIs below $25k, 39.1% for AGIs $25k-50k, 57.2% for AGIs $50k-75k, 140.9% for AGIs $75k-100k, 89.9% for AGIs $100k-200k, 511.5% for AGIs over 200k)
Ordinary dividends: $5,419 (reported on 36.4% of returns)
Here:
$5,419
State:
$12,683
(% of AGI for various income ranges: 40.0% for AGIs below $25k, 77.2% for AGIs $25k-50k, 126.3% for AGIs $50k-75k, 212.2% for AGIs $75k-100k, 327.6% for AGIs $100k-200k, 1966.5% for AGIs over 200k)
Net capital gain/loss in AGI: +$10,710 (reported on 31.5% of returns)
Here:
+$10,710
State:
+$44,158
(% of AGI for various income ranges: 29.4% for AGIs below $25k, 55.9% for AGIs $25k-50k, 94.2% for AGIs $50k-75k, 214.1% for AGIs $75k-100k, 464.6% for AGIs $100k-200k, 4258.1% for AGIs over 200k)
Profit/loss from business: +$29,668 (reported on 17.4% of returns)
Here:
+$29,668
State:
+$22,988
(% of AGI for various income ranges: 112.8% for AGIs below $25k, 262.2% for AGIs $25k-50k, 237.7% for AGIs $50k-75k, 432.5% for AGIs $75k-100k, 789.1% for AGIs $100k-200k, 5516.2% for AGIs over 200k)
Taxable individual retirement arrangement distribution: $21,310 (reported on 12.6% of returns)
06013:
$21,310
Connecticut:
$22,031
(% of AGI for various income ranges: 79.8% for AGIs below $25k, 183.0% for AGIs $25k-50k, 260.5% for AGIs $50k-75k, 446.9% for AGIs $75k-100k, 630.6% for AGIs $100k-200k, 1579.2% for AGIs over 200k)
Self-employed (Keogh) retirement plans: $26,700 (reported on 1.9% of returns)
06013:
$26,700
Connecticut:
$29,016
(% of AGI for various income ranges: 78.4% for AGIs $100k-200k, 686.2% for AGIs over 200k)
Total itemized deductions: $30,070 (reported on 14.7% of returns)
Here:
$30,070
State:
$37,613
(% of AGI for various income ranges: 121.1% for AGIs below $25k, 177.8% for AGIs $25k-50k, 541.2% for AGIs $50k-75k, 629.7% for AGIs $75k-100k, 826.7% for AGIs $100k-200k, 3412.3% for AGIs over 200k)
Charity contributions: $5,964 (reported on 11.4% of returns)
Here:
$5,964
State:
$13,557
(% of AGI for various income ranges: 5.8% for AGIs below $25k, 53.3% for AGIs $50k-75k, 50.6% for AGIs $75k-100k, 97.5% for AGIs $100k-200k, 800.4% for AGIs over 200k)
Taxes paid: $9,334 (reported on 14.7% of returns)
06013:
$9,334
State:
$9,096
(% of AGI for various income ranges: 28.5% for AGIs below $25k, 47.2% for AGIs $25k-50k, 220.7% for AGIs $50k-75k, 288.8% for AGIs $75k-100k, 274.4% for AGIs $100k-200k, 840.0% for AGIs over 200k)
Earned income credit: $1,544 (reported on 3.7% of returns)
Here:
$1,544
State:
$2,059
(% of AGI for various income ranges: 26.5% for AGIs below $25k, 23.0% for AGIs $25k-50k)
Percentage of individuals using paid preparers for their 2020 taxes: 93.6%
Here:
94%
State:
93%
(% for various income ranges: 90.5% for AGIs below $25k, 95.0% for AGIs $25k-50k, 94.8% for AGIs $50k-75k, 91.8% for AGIs $75k-100k, 94.2% for AGIs $100k-200k, 95.9% for AGIs over 200k)
Averages for the 2012 tax year for zip code 06013, filed in 2013:
Average Adjusted Gross Income (AGI) in 2012: $98,942 (Individual Income Tax Returns)
Here:
$98,942
State:
$93,290
Salary/wage: $87,875 (reported on 86.6% of returns)
Here:
$87,875
State:
$73,117
(% of AGI for various income ranges: 69.3% for AGIs below $25k, 74.2% for AGIs $25k-50k, 72.9% for AGIs $50k-75k, 75.4% for AGIs $75k-100k, 82.8% for AGIs $100k-200k, 73.2% for AGIs over 200k)
Taxable interest for individuals: $1,146 (reported on 62.9% of returns)
This zip code:
$1,146
Connecticut:
$2,530
(% of AGI for various income ranges: 1.9% for AGIs below $25k, 1.1% for AGIs $25k-50k, 0.7% for AGIs $50k-75k, 0.6% for AGIs $75k-100k, 0.7% for AGIs $100k-200k, 0.7% for AGIs over 200k)
Ordinary dividends: $3,833 (reported on 38.5% of returns)
Here:
$3,833
State:
$10,909
(% of AGI for various income ranges: 2.2% for AGIs below $25k, 1.3% for AGIs $25k-50k, 1.5% for AGIs $50k-75k, 1.7% for AGIs $75k-100k, 1.1% for AGIs $100k-200k, 1.8% for AGIs over 200k)
Net capital gain/loss in AGI: +$6,253 (reported on 28.8% of returns)
Here:
+$6,253
State:
+$34,090
(% of AGI for various income ranges: 0.4% for AGIs below $25k, 0.1% for AGIs $25k-50k, 0.6% for AGIs $50k-75k, 0.9% for AGIs $75k-100k, 0.6% for AGIs $100k-200k, 3.9% for AGIs over 200k)
Profit/loss from business: +$26,875 (reported on 17.4% of returns)
Here:
+$26,875
State:
+$22,741
(% of AGI for various income ranges: 7.4% for AGIs below $25k, 3.4% for AGIs $25k-50k, 4.7% for AGIs $50k-75k, 4.7% for AGIs $75k-100k, 3.4% for AGIs $100k-200k, 6.1% for AGIs over 200k)
Taxable individual retirement arrangement distribution: $17,532 (reported on 11.6% of returns)
06013:
$17,532
Connecticut:
$19,976
(% of AGI for various income ranges: 4.5% for AGIs below $25k, 3.7% for AGIs $25k-50k, 3.2% for AGIs $50k-75k, 2.8% for AGIs $75k-100k, 1.8% for AGIs $100k-200k, 1.4% for AGIs over 200k)
Self-employment retirement plans: $26,400 (reported on 2.0% of returns)
06013:
$26,400
Connecticut:
$24,004
(% of AGI for various income ranges: 2.8% for AGIs below $25k, 0.4% for AGIs $100k-200k, 0.8% for AGIs over 200k)
Total itemized deductions: $27,162 (19% of AGI, reported on 60.0% of returns)
Here:
$27,162
State:
$33,239
Here:
18.7% of AGI
State:
18.9% of AGI
(% of AGI for various income ranges: 15.0% for AGIs below $25k, 15.6% for AGIs $25k-50k, 18.9% for AGIs $50k-75k, 20.1% for AGIs $75k-100k, 18.4% for AGIs $100k-200k, 13.3% for AGIs over 200k)
Charity contributions: $2,481 (reported on 51.4% of returns)
Here:
$2,481
State:
$4,947
(% of AGI for various income ranges: 0.7% for AGIs below $25k, 0.9% for AGIs $25k-50k, 1.1% for AGIs $50k-75k, 1.3% for AGIs $75k-100k, 1.4% for AGIs $100k-200k, 1.3% for AGIs over 200k)
Taxes paid: $15,205 (reported on 60.0% of returns)
06013:
$15,205
State:
$17,397
(% of AGI for various income ranges: 6.3% for AGIs below $25k, 6.8% for AGIs $25k-50k, 8.9% for AGIs $50k-75k, 10.1% for AGIs $75k-100k, 10.3% for AGIs $100k-200k, 8.5% for AGIs over 200k)
Earned income credit: $1,520 (reported on 5.5% of returns)
Here:
$1,520
State:
$2,053
(% of AGI for various income ranges: 1.9% for AGIs below $25k, 0.6% for AGIs $25k-50k)
Percentage of individuals using paid preparers for their 2012 taxes: 53.6%
Here:
54%
State:
55%
(% for various income ranges: 43.3% for AGIs below $25k, 52.4% for AGIs $25k-50k, 60.7% for AGIs $50k-75k, 57.7% for AGIs $75k-100k, 54.2% for AGIs $100k-200k, 68.2% for AGIs over 200k)
Averages for the 2004 tax year for zip code 06013, filed in 2005:
Average Adjusted Gross Income (AGI) in 2004: $82,236 (Individual Income Tax Returns)
Here:
$82,236
State:
$73,265
Salary/wage: $72,729 (reported on 87.9% of returns)
Here:
$72,729
State:
$62,030
(% of AGI for various income ranges: 115.3% for AGIs below $10k, 69.6% for AGIs $10k-25k, 75.4% for AGIs $25k-50k, 79.4% for AGIs $50k-75k, 84.1% for AGIs $75k-100k, 76.2% for AGIs over 100k)
Taxable interest for individuals: $1,031 (reported on 75.8% of returns)
This zip code:
$1,031
Connecticut:
$2,287
(% of AGI for various income ranges: 7.5% for AGIs below $10k, 3.4% for AGIs $10k-25k, 1.7% for AGIs $25k-50k, 1.0% for AGIs $50k-75k, 0.9% for AGIs $75k-100k, 0.7% for AGIs over 100k)
Taxable dividends: $2,287 (reported on 45.8% of returns)
Here:
$2,287
State:
$5,735
(% of AGI for various income ranges: 7.7% for AGIs below $10k, 2.2% for AGIs $10k-25k, 1.5% for AGIs $25k-50k, 1.2% for AGIs $50k-75k, 1.0% for AGIs $75k-100k, 1.2% for AGIs over 100k)
Net capital gain/loss: +$13,043 (reported on 34.9% of returns)
Here:
+$13,043
State:
+$23,694
(% of AGI for various income ranges: -1.0% for AGIs below $10k, 0.3% for AGIs $10k-25k, 0.7% for AGIs $25k-50k, 1.4% for AGIs $50k-75k, 1.6% for AGIs $75k-100k, 8.0% for AGIs over 100k)
Profit/loss from business: +$22,073 (reported on 18.8% of returns)
Here:
+$22,073
State:
+$20,783
(% of AGI for various income ranges: 3.7% for AGIs below $10k, 5.3% for AGIs $10k-25k, 7.1% for AGIs $25k-50k, 5.9% for AGIs $50k-75k, 4.9% for AGIs $75k-100k, 4.7% for AGIs over 100k)
IRA payment deduction: $3,456 (reported on 3.8% of returns)
06013:
$3,456
Connecticut:
$3,216
(% of AGI for various income ranges: 1.7% for AGIs below $10k, 0.5% for AGIs $25k-50k, 0.3% for AGIs $50k-75k, 0.2% for AGIs $75k-100k, 0.1% for AGIs over 100k)
Self-employed pension: $14,320 (reported on 3.0% of returns)
Here:
$14,320
Connecticut:
$17,335
(% of AGI for various income ranges: 0.6% for AGIs $25k-50k, 0.3% for AGIs $50k-75k, 0.3% for AGIs $75k-100k, 0.6% for AGIs over 100k)
Total itemized deductions: $22,147 (19% of AGI, reported on 60.7% of returns)
Here:
$22,147
State:
$24,919
Here:
18.6% of AGI
State:
18.6% of AGI
(% of AGI for various income ranges: 19.0% for AGIs below $10k, 16.5% for AGIs $10k-25k, 17.4% for AGIs $25k-50k, 20.9% for AGIs $50k-75k, 19.9% for AGIs $75k-100k, 14.6% for AGIs over 100k)
Charity contributions deductions: $2,566 (2% of AGI, reported on 56.7% of returns)
Here:
$2,566
State:
$3,762
Here:
2.1% of AGI
State:
2.7% of AGI
(% of AGI for various income ranges: 0.6% for AGIs below $10k, 1.0% for AGIs $10k-25k, 1.2% for AGIs $25k-50k, 1.6% for AGIs $50k-75k, 1.7% for AGIs $75k-100k, 1.9% for AGIs over 100k)
Total tax: $13,928 (reported on 87.0% of returns)
06013:
$13,928
State:
$15,148
(% of AGI for various income ranges: 4.4% for AGIs below $10k, 5.3% for AGIs $10k-25k, 8.3% for AGIs $25k-50k, 9.0% for AGIs $50k-75k, 9.9% for AGIs $75k-100k, 18.0% for AGIs over 100k)
Earned income credit: $1,229 (reported on 3.3% of returns)
Here:
$1,229
State:
$1,570
Percentage of individuals using paid preparers for their 2004 taxes: 55.0%
Here:
55%
State:
59%
(% for various income ranges: 43.3% for AGIs below $10k, 54.4% for AGIs $10k-25k, 56.4% for AGIs $25k-50k, 58.8% for AGIs $50k-75k, 57.2% for AGIs $75k-100k, 57.9% for AGIs over 100k)
Likely homosexual households (counted as self-reported same-sex unmarried-partner households)
Lesbian couples: 0.3% of all households
Gay men: 0.0% of all households
Household received Food Stamps/SNAP in the past 12 months: 109 Household did not receive Food Stamps/SNAP in the past 12 months: 3,135
Women who had a birth in the past 12 months: 92 (88 now married, 0 unmarried) Women who did not have a birth in the past 12 months: 2,090 (1,059 now married, 1,006 unmarried)
Housing units in zip code 06013 with a mortgage: 2,125 (135 second mortgage, 132 both second mortgage and home equity loan) Houses without a mortgage: 97
Median monthly owner costs for units with a mortgage: $2,540 Median monthly owner costs for units without a mortgage: $1,078
Residents with income below the poverty level in 2022:
This zip code:
2.8%
Whole state:
9.8%
Residents with income below 50% of the poverty level in 2022:
This zip code:
1.1%
Whole state:
4.8%
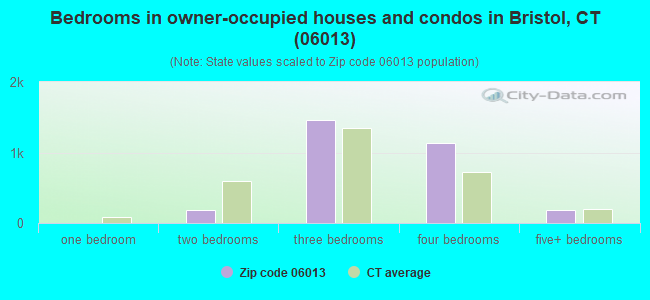
Median number of rooms in houses and condos:
Here:
7.4
State:
6.5
Median number of rooms in apartments:
Here:
4.7
State:
4.0
Notable locations in this zip code not listed on our city pages
Notable locations in zip code 06013: Schwartzmann Mill (A), Covey Corners (B), New Britain Camp (C), Burlington Trout Hatchery (D), Burlington Volunteer Fire Department Station 1 Headquarters (E), Tavern on the Green (F), Burlington Public Library (G), Burlington Volunteer Fire Department Station 2 Chippens Hill (H), Burlington Volunteer Fire Department Station 3 Wigville Station (I), Burlington Volunteer Fire Department Station 4 Lake Garda (J). Display/hide their locations on the map
Lakes and reservoirs: Lake Como (A), Lake Garda (B), Monce Pond (C), Farmington River Reservoir (D), Whigville Reservoir (E), New Britain Reservoir (F). Display/hide their locations on the map
Streams, rivers, and creeks: Phelps Brook (A), Punch Brook (B), Bradley Brook (C), Bunnell Brook (D), Wildcat Brook (E), Clear Brook (F), Whigville Brook (G). Display/hide their locations on the map
2,026 married couples with children.
296 single-parent households (161 men, 135 women).
88.3% of residents of 06013 zip code speak English at home.
3.0% of residents speak Spanish at home (69% very well, 25% well, 6% not well).
6.6% of residents speak other Indo-European language at home (76% very well, 15% well, 7% not well, 2% not at all).
0.8% of residents speak Asian or Pacific Island language at home (95% very well, 5% not well).
0.5% of residents speak other language at home (100% not well).
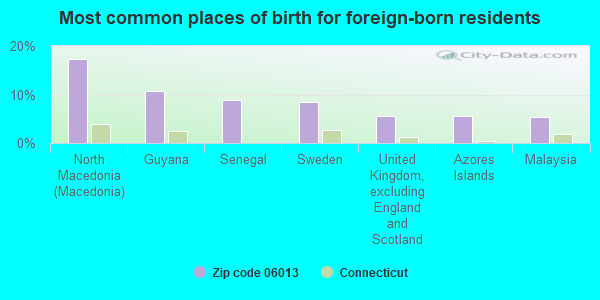
Foreign born population: 970 (10.1%) (77.0% of them are naturalized citizens)
This zip code:
10.1%
Whole state:
15.7%
17%North Macedonia (Macedonia)
11%Guyana
9%Senegal
8%Sweden
6%United Kingdom, excluding England and Scotland
6%Azores Islands
5%Malaysia
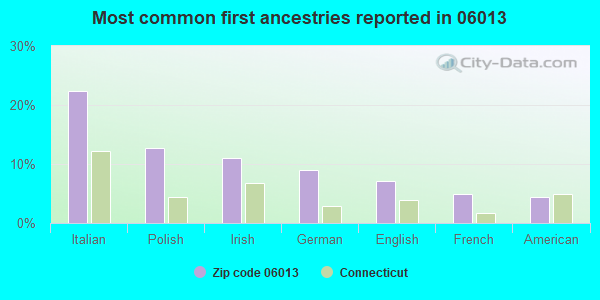
22%Italian
13%Polish
11%Irish
9%German
7%English
5%French
4%American
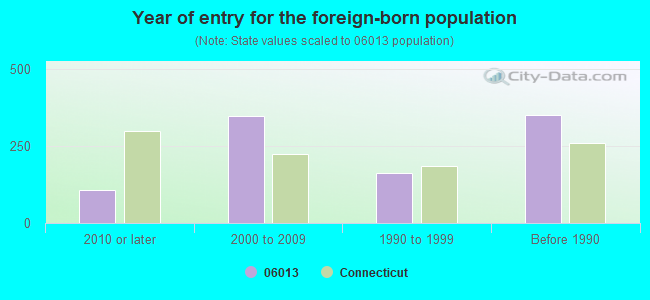
Year of entry for the foreign-born population
1082010 or later
3482000 to 2009
1611990 to 1999
351Before 1990
Facilities with environmental interests located in this zip code:
HAR BUR MIDDLE SCHOOL (26 LYON RD in BURLINGTON, CT)
AIR MINOR (AIRS/AFS) (Geographic Names Information System) COMPLIANCE ACTIVITY (Tracking inspections of insecticide, fungicide, and rodenticide, and toxic substances) (National Center for Education Statistics) - STATE ID-51 Business SIC classification: ELEMENTARY AND SECONDARY SCHOOLS Organizations: REGIONAL SCHOOL DISTRICT 10 (SCHOOL DISTRICT)
HOLLANDS GARAGE (271 RTE 4 in BURLINGTON, CT)
(Integrated Compliance Information System) - ICIS-01-2000-0179, FORMAL ENFORCEMENT ACTION
CRESCENT MANUFACTURING COMPANY (GEORGE WASHINGTON TURNPIKE in BURLINGTON, CT)
Large Quantity Generators, more that 1000 kg of hazardous waste/month (Resource Conservation and Recovery Act (tracking hazardous waste)) - notification Organizations: CRESCENT MFG HOLDING LLC (CONTACT/OPERATOR)
, OWNERNAME (CONTACT/OWNER)
, CRESCENT REALE ESTATE LLC (CONTACT/OWNER)
BURLINGTON HATCHERY FISHERIES (34 BELDEN RD in BURLINGTON, CT)
(Resource Conservation and Recovery Act (tracking hazardous waste))
BURLINGTON SEPTIC SERVICE INCORPORATED (66 GEORGE WASHINGTON TURNPIKE in BURLINGTON, CT)
(Resource Conservation and Recovery Act (tracking hazardous waste)) Organizations: HOWARD SUSSDORFF (CONTACT/OWNER)
C V S # 7916 (292 SPEILMAN HWY in BURLINGTON, CT)
Small Quantity Generators, between 100 kg and 1000 kg of hazardous waste/month (Resource Conservation and Recovery Act (tracking hazardous waste)) Organizations: CVS PHARMACY (CONTACT/OPERATOR)
Housing units lacking complete kitchen facilities: 2.4%
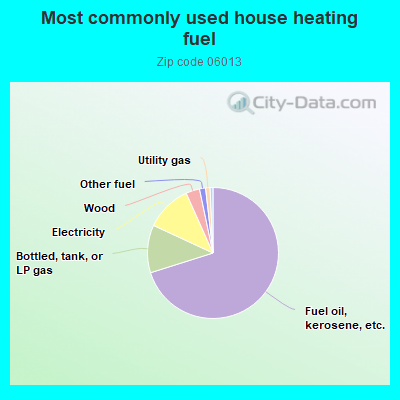
70.2%Fuel oil, kerosene, etc.
11.8%Bottled, tank, or LP gas
11.4%Electricity
3.4%Wood
1.5%Other fuel
1.1%Utility gas
0.7%Coal or coke
Population in 1990: 7,017. Population change in the 1990s: +1,199 (+17.1%).
Place of birth for U.S.-born residents:
This state: 6,638
Northeast: 1,271
Midwest: 260
South: 148
West: 196
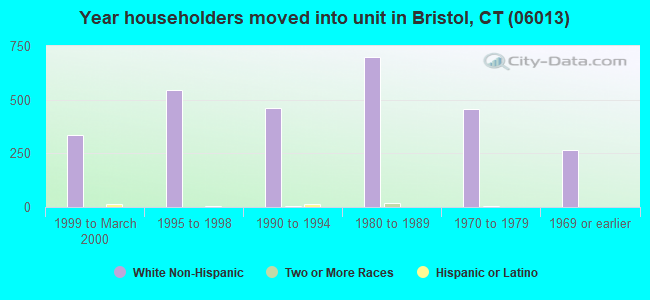
67% of the 06013 zip code residents lived in the same house 5 years ago. Out of people who lived in different houses, 61% lived in this county. Out of people who lived in different counties, 50% lived in Connecticut.
88% of the 06013 zip code residents lived in the same house 1 year ago. Out of people who lived in different houses, 35% moved from this county. Out of people who lived in different houses, 44% moved from different county within same state. Out of people who lived in different houses, 17% moved from different state.
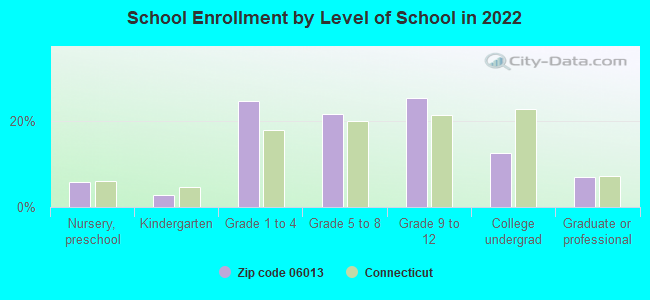
Private vs. public school enrollment:
Students in private schools in grades 1 to 8 (elementary and middle school): 65
Here:
5.1%
Connecticut:
9.5%
Students in private schools in grades 9 to 12 (high school): 80
Here:
11.6%
Connecticut:
12.9%
Students in private undergraduate colleges: 149
Here:
42.8%
Connecticut:
35.5%
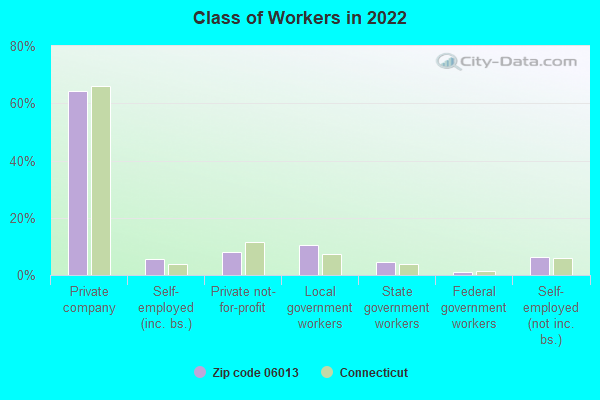
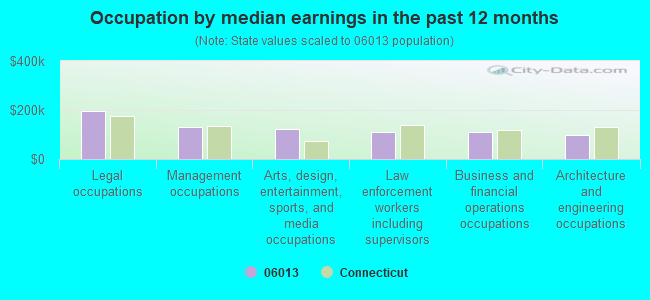
Occupation by median earnings in the past 12 months ($)
196,641Legal occupations
131,238Management occupations
124,296Arts, design, entertainment, sports, and media occupations
110,924Law enforcement workers including supervisors
109,768Business and financial operations occupations
98,322Architecture and engineering occupations
Companies with federal contracts located in this zip code:
JASON RAMA (22 CIDER MILL RD in BURLINGTON, NY; small business) : -$2,350 in 4 contractsfrom 2003 to 2004
$3,000 with Army for Technical Assistance. Taking place in NY. Signed on 2003-12-11. Completion date: 2004-06-01.
$0, same as above.Signed on 2004-03-04. Completion date: 2004-06-01.
-$2,350, same as above.Signed on 2004-03-04. Completion date: 2004-06-01.
-$3,000, same as above.Signed on 2004-05-11. Completion date: 2004-06-01.
Top industries in this zip code by the number of employees in 2005:
Finance and Insurance: Direct Health and Medical Insurance Carriers (500-999 employees: 1 establishment)
Administrative and Support and Waste Management and Remediation Services: Facilities Support Services (100-249: 1)
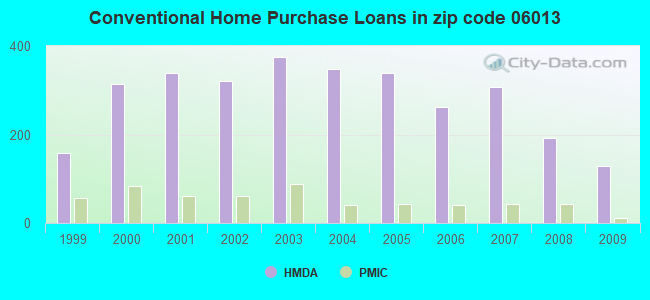
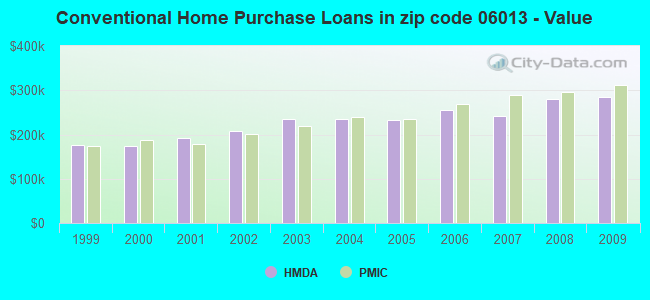
Detailed PMIC statistics for the following Tracts:4101.00
2002 - 2018 National Fire Incident Reporting System (NFIRS) incidents
Based on the data from the years 2002 - 2018 the average number of fires per year is 24. The highest number of fire incidents - 40 took place in 2016, and the least - 14 in 2012. The data has a constant trend.
When looking into fire subcategories, the most reports belonged to: Structure Fires (46.9%), and Outside Fires (33.4%).
Fire incident types reported to NFIRS in Zip Code 06013


 Nearest zip codes: 06085, 06010, 06020, 06786, 06001, 06057.


 Based on the data from the years 2002 - 2018 the average number of fires per year is 24. The highest number of fire incidents - 40 took place in 2016, and the least - 14 in 2012. The data has a constant trend.
 When looking into fire subcategories, the most reports belonged to: Structure Fires (46.9%), and Outside Fires (33.4%).