Estimated zip code population in 2022: 7,842 Zip code population in 2010: 7,513 Zip code population in 2000: 7,394
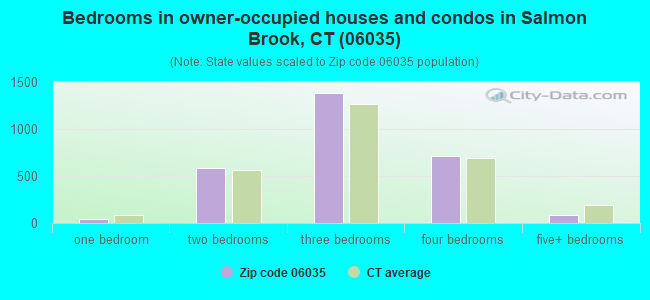
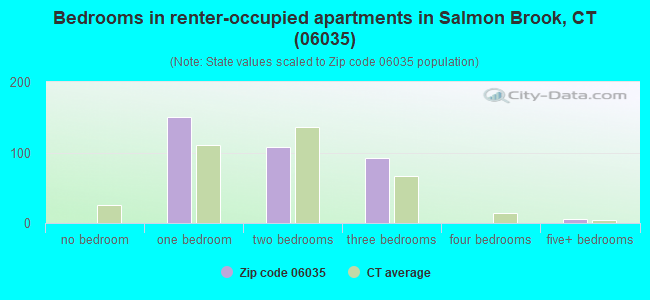
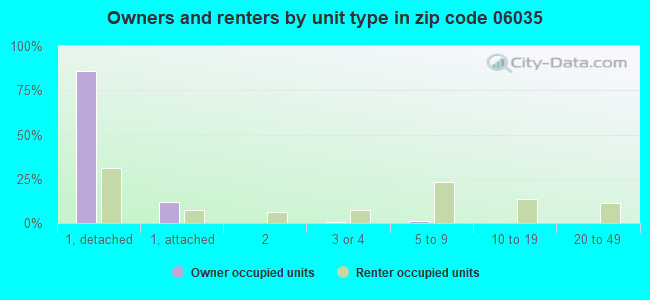
Houses and condos: 3,193 Renter-occupied apartments: 355
% of renters here:
11%
State:
34%
March 2022 cost of living index in zip code 06035: 103.3 (near average, U.S. average is 100)
Land area: 15.3 sq. mi. Water area: 0.1 sq. mi.
Population density: 511 people per square mile
(low).
OSM Map
Google Map
MSN Map
OSM Map
General Map
Google Map
MSN Map
OSM Map
Google Map
MSN Map
OSM Map
Google Map
MSN Map
Please wait while loading the map...
Real estate property taxes paid for housing units in 2022:
This zip code:
2.1% ($7,151)
Connecticut:
1.8% ($6,189)
Median real estate property taxes paid for housing units with mortgages in 2022: $7,681 (2.2%) Median real estate property taxes paid for housing units with no mortgage in 2022: $6,342 (2.1%)
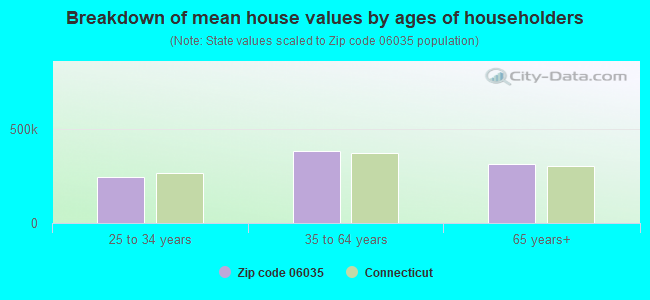
Estimated median house/condo value in 2022: $335,080
06035:
$335,080
Connecticut:
$347,200
According to our research of Connecticut and other state lists, there were 3 registered sex offenders living in 06035 zip code as of May 10, 2024. The ratio of all residents to sex offenders in zip code 06035 is 2,690 to 1. The ratio of registered sex offenders to all residents in this zip code is much lower than the state average.
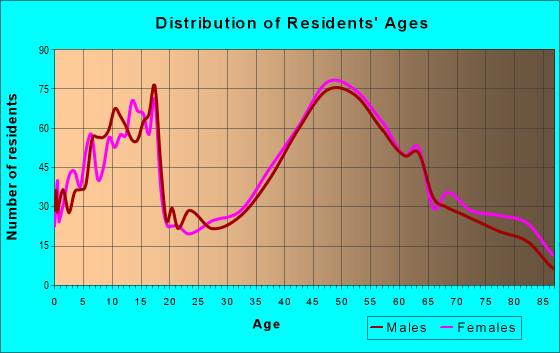
Median resident age:
This zip code:
45.7 years
Connecticut median age:
40.9 years
Average household size:
This zip code:
2.4 people
Connecticut:
2.5 people
Averages for the 2020 tax year for zip code 06035, filed in 2021:
Average Adjusted Gross Income (AGI) in 2020: $99,982 (Individual Income Tax Returns)
Here:
$99,982
State:
$105,931
Salary/wage: $89,431 (reported on 77.9% of returns)
Here:
$89,431
State:
$83,540
(% of AGI for various income ranges: 977.6% for AGIs below $25k, 3027.4% for AGIs $25k-50k, 5823.8% for AGIs $50k-75k, 8740.3% for AGIs $75k-100k, 18093.2% for AGIs $100k-200k, 69941.4% for AGIs over 200k)
Taxable interest for individuals: $1,256 (reported on 45.9% of returns)
This zip code:
$1,256
Connecticut:
$3,402
(% of AGI for various income ranges: 31.3% for AGIs below $25k, 35.9% for AGIs $25k-50k, 76.2% for AGIs $50k-75k, 59.7% for AGIs $75k-100k, 146.1% for AGIs $100k-200k, 413.6% for AGIs over 200k)
Ordinary dividends: $6,148 (reported on 36.0% of returns)
Here:
$6,148
State:
$12,683
(% of AGI for various income ranges: 51.5% for AGIs below $25k, 115.2% for AGIs $25k-50k, 198.1% for AGIs $50k-75k, 255.0% for AGIs $75k-100k, 378.8% for AGIs $100k-200k, 2921.4% for AGIs over 200k)
Net capital gain/loss in AGI: +$10,917 (reported on 30.7% of returns)
Here:
+$10,917
State:
+$44,158
(% of AGI for various income ranges: 37.0% for AGIs below $25k, 73.5% for AGIs $25k-50k, 122.4% for AGIs $50k-75k, 264.7% for AGIs $75k-100k, 463.6% for AGIs $100k-200k, 6163.6% for AGIs over 200k)
Profit/loss from business: +$24,049 (reported on 14.5% of returns)
Here:
+$24,049
State:
+$22,988
(% of AGI for various income ranges: 87.8% for AGIs below $25k, 243.9% for AGIs $25k-50k, 271.9% for AGIs $50k-75k, 419.7% for AGIs $75k-100k, 679.0% for AGIs $100k-200k, 4075.0% for AGIs over 200k)
Taxable individual retirement arrangement distribution: $20,516 (reported on 15.5% of returns)
06035:
$20,516
Connecticut:
$22,031
(% of AGI for various income ranges: 120.4% for AGIs below $25k, 269.3% for AGIs $25k-50k, 349.5% for AGIs $50k-75k, 450.0% for AGIs $75k-100k, 890.5% for AGIs $100k-200k, 1824.3% for AGIs over 200k)
Self-employed (Keogh) retirement plans: $16,800 (reported on 1.8% of returns)
06035:
$16,800
Connecticut:
$29,016
(% of AGI for various income ranges: 59.2% for AGIs $100k-200k, 590.7% for AGIs over 200k)
Total itemized deductions: $28,598 (reported on 14.5% of returns)
Here:
$28,598
State:
$37,613
(% of AGI for various income ranges: 117.8% for AGIs below $25k, 265.7% for AGIs $25k-50k, 624.0% for AGIs $50k-75k, 880.7% for AGIs $75k-100k, 812.4% for AGIs $100k-200k, 3133.6% for AGIs over 200k)
Charity contributions: $8,309 (reported on 11.2% of returns)
Here:
$8,309
State:
$13,557
(% of AGI for various income ranges: 23.7% for AGIs $25k-50k, 47.6% for AGIs $50k-75k, 109.3% for AGIs $75k-100k, 155.4% for AGIs $100k-200k, 1501.4% for AGIs over 200k)
Taxes paid: $9,018 (reported on 14.5% of returns)
06035:
$9,018
State:
$9,096
(% of AGI for various income ranges: 21.3% for AGIs below $25k, 85.4% for AGIs $25k-50k, 230.2% for AGIs $50k-75k, 344.0% for AGIs $75k-100k, 275.6% for AGIs $100k-200k, 719.3% for AGIs over 200k)
Earned income credit: $1,626 (reported on 4.8% of returns)
Here:
$1,626
State:
$2,059
(% of AGI for various income ranges: 32.2% for AGIs below $25k, 29.3% for AGIs $25k-50k)
Percentage of individuals using paid preparers for their 2020 taxes: 91.6%
Here:
92%
State:
93%
(% for various income ranges: 90.1% for AGIs below $25k, 92.1% for AGIs $25k-50k, 91.7% for AGIs $50k-75k, 91.3% for AGIs $75k-100k, 92.2% for AGIs $100k-200k, 92.7% for AGIs over 200k)
Averages for the 2012 tax year for zip code 06035, filed in 2013:
Average Adjusted Gross Income (AGI) in 2012: $85,438 (Individual Income Tax Returns)
Here:
$85,438
State:
$93,290
Salary/wage: $77,776 (reported on 81.3% of returns)
Here:
$77,776
State:
$73,117
(% of AGI for various income ranges: 66.0% for AGIs below $25k, 67.6% for AGIs $25k-50k, 69.4% for AGIs $50k-75k, 71.2% for AGIs $75k-100k, 79.1% for AGIs $100k-200k, 72.8% for AGIs over 200k)
Taxable interest for individuals: $1,000 (reported on 62.4% of returns)
This zip code:
$1,000
Connecticut:
$2,530
(% of AGI for various income ranges: 2.3% for AGIs below $25k, 0.9% for AGIs $25k-50k, 0.7% for AGIs $50k-75k, 0.6% for AGIs $75k-100k, 0.7% for AGIs $100k-200k, 0.5% for AGIs over 200k)
Ordinary dividends: $4,661 (reported on 39.7% of returns)
Here:
$4,661
State:
$10,909
(% of AGI for various income ranges: 3.8% for AGIs below $25k, 2.3% for AGIs $25k-50k, 2.0% for AGIs $50k-75k, 1.6% for AGIs $75k-100k, 1.8% for AGIs $100k-200k, 2.7% for AGIs over 200k)
Net capital gain/loss in AGI: +$7,665 (reported on 30.0% of returns)
Here:
+$7,665
State:
+$34,090
(% of AGI for various income ranges: 0.3% for AGIs $50k-75k, 1.1% for AGIs $100k-200k, 7.6% for AGIs over 200k)
Profit/loss from business: +$21,492 (reported on 16.8% of returns)
Here:
+$21,492
State:
+$22,741
(% of AGI for various income ranges: 8.7% for AGIs below $25k, 4.5% for AGIs $25k-50k, 4.4% for AGIs $50k-75k, 2.7% for AGIs $75k-100k, 4.5% for AGIs $100k-200k, 3.9% for AGIs over 200k)
Taxable individual retirement arrangement distribution: $16,690 (reported on 15.3% of returns)
06035:
$16,690
Connecticut:
$19,976
(% of AGI for various income ranges: 6.4% for AGIs below $25k, 4.7% for AGIs $25k-50k, 4.0% for AGIs $50k-75k, 3.4% for AGIs $75k-100k, 2.1% for AGIs $100k-200k, 2.9% for AGIs over 200k)
Self-employment retirement plans: $15,625 (reported on 2.1% of returns)
06035:
$15,625
Connecticut:
$24,004
(% of AGI for various income ranges: 0.8% for AGIs $25k-50k, 0.5% for AGIs $100k-200k, 0.5% for AGIs over 200k)
Total itemized deductions: $24,744 (20% of AGI, reported on 57.4% of returns)
Here:
$24,744
State:
$33,239
Here:
19.5% of AGI
State:
18.9% of AGI
(% of AGI for various income ranges: 21.0% for AGIs below $25k, 18.2% for AGIs $25k-50k, 18.1% for AGIs $50k-75k, 17.6% for AGIs $75k-100k, 17.2% for AGIs $100k-200k, 14.1% for AGIs over 200k)
Charity contributions: $3,012 (reported on 48.4% of returns)
Here:
$3,012
State:
$4,947
(% of AGI for various income ranges: 0.9% for AGIs below $25k, 1.0% for AGIs $25k-50k, 1.4% for AGIs $50k-75k, 1.6% for AGIs $75k-100k, 1.6% for AGIs $100k-200k, 2.3% for AGIs over 200k)
Taxes paid: $13,555 (reported on 57.1% of returns)
06035:
$13,555
State:
$17,397
(% of AGI for various income ranges: 6.8% for AGIs below $25k, 7.5% for AGIs $25k-50k, 8.6% for AGIs $50k-75k, 8.9% for AGIs $75k-100k, 10.0% for AGIs $100k-200k, 8.7% for AGIs over 200k)
Earned income credit: $1,670 (reported on 5.3% of returns)
Here:
$1,670
State:
$2,053
(% of AGI for various income ranges: 2.0% for AGIs below $25k, 0.5% for AGIs $25k-50k)
Percentage of individuals using paid preparers for their 2012 taxes: 49.7%
Here:
50%
State:
55%
(% for various income ranges: 42.1% for AGIs below $25k, 49.1% for AGIs $25k-50k, 54.7% for AGIs $50k-75k, 53.2% for AGIs $75k-100k, 52.8% for AGIs $100k-200k, 55.6% for AGIs over 200k)
Averages for the 2004 tax year for zip code 06035, filed in 2005:
Average Adjusted Gross Income (AGI) in 2004: $71,125 (Individual Income Tax Returns)
Here:
$71,125
State:
$73,265
Salary/wage: $67,468 (reported on 83.0% of returns)
Here:
$67,468
State:
$62,030
(% of AGI for various income ranges: 103.2% for AGIs below $10k, 61.9% for AGIs $10k-25k, 73.0% for AGIs $25k-50k, 74.3% for AGIs $50k-75k, 78.5% for AGIs $75k-100k, 81.5% for AGIs over 100k)
Taxable interest for individuals: $1,091 (reported on 73.1% of returns)
This zip code:
$1,091
Connecticut:
$2,287
(% of AGI for various income ranges: 6.9% for AGIs below $10k, 3.4% for AGIs $10k-25k, 1.8% for AGIs $25k-50k, 1.3% for AGIs $50k-75k, 0.9% for AGIs $75k-100k, 0.8% for AGIs over 100k)
Taxable dividends: $2,922 (reported on 43.5% of returns)
Here:
$2,922
State:
$5,735
(% of AGI for various income ranges: 7.2% for AGIs below $10k, 4.1% for AGIs $10k-25k, 1.6% for AGIs $25k-50k, 1.6% for AGIs $50k-75k, 1.1% for AGIs $75k-100k, 1.9% for AGIs over 100k)
Net capital gain/loss: +$5,170 (reported on 33.9% of returns)
Here:
+$5,170
State:
+$23,694
(% of AGI for various income ranges: -3.1% for AGIs below $10k, 2.0% for AGIs $10k-25k, -0.5% for AGIs $25k-50k, 1.1% for AGIs $50k-75k, 0.9% for AGIs $75k-100k, 3.9% for AGIs over 100k)
Profit/loss from business: +$17,921 (reported on 18.2% of returns)
Here:
+$17,921
State:
+$20,783
(% of AGI for various income ranges: 3.8% for AGIs below $10k, 6.7% for AGIs $10k-25k, 8.4% for AGIs $25k-50k, 5.7% for AGIs $50k-75k, 5.8% for AGIs $75k-100k, 3.1% for AGIs over 100k)
IRA payment deduction: $3,512 (reported on 3.5% of returns)
06035:
$3,512
Connecticut:
$3,216
(% of AGI for various income ranges: 0.5% for AGIs $10k-25k, 0.4% for AGIs $25k-50k, 0.3% for AGIs $50k-75k, 0.2% for AGIs $75k-100k, 0.1% for AGIs over 100k)
Self-employed pension: $11,710 (reported on 2.8% of returns)
Here:
$11,710
Connecticut:
$17,335
(% of AGI for various income ranges: 0.3% for AGIs $25k-50k, 0.4% for AGIs $50k-75k, 0.3% for AGIs $75k-100k, 0.5% for AGIs over 100k)
Total itemized deductions: $20,343 (20% of AGI, reported on 58.8% of returns)
Here:
$20,343
State:
$24,919
Here:
19.7% of AGI
State:
18.6% of AGI
(% of AGI for various income ranges: 28.6% for AGIs below $10k, 17.3% for AGIs $10k-25k, 17.7% for AGIs $25k-50k, 19.1% for AGIs $50k-75k, 18.9% for AGIs $75k-100k, 15.2% for AGIs over 100k)
Charity contributions deductions: $2,409 (2% of AGI, reported on 54.2% of returns)
Here:
$2,409
State:
$3,762
Here:
2.3% of AGI
State:
2.7% of AGI
(% of AGI for various income ranges: 0.8% for AGIs below $10k, 1.3% for AGIs $10k-25k, 1.6% for AGIs $25k-50k, 1.6% for AGIs $50k-75k, 1.7% for AGIs $75k-100k, 2.0% for AGIs over 100k)
Total tax: $11,625 (reported on 85.9% of returns)
06035:
$11,625
State:
$15,148
(% of AGI for various income ranges: 5.2% for AGIs below $10k, 5.1% for AGIs $10k-25k, 8.7% for AGIs $25k-50k, 9.6% for AGIs $50k-75k, 10.9% for AGIs $75k-100k, 17.7% for AGIs over 100k)
Earned income credit: $1,235 (reported on 3.3% of returns)
Here:
$1,235
State:
$1,570
Percentage of individuals using paid preparers for their 2004 taxes: 49.7%
Here:
50%
State:
59%
(% for various income ranges: 41.4% for AGIs below $10k, 48.3% for AGIs $10k-25k, 53.9% for AGIs $25k-50k, 53.0% for AGIs $50k-75k, 53.7% for AGIs $75k-100k, 48.2% for AGIs over 100k)
Household received Food Stamps/SNAP in the past 12 months: 142 Household did not receive Food Stamps/SNAP in the past 12 months: 3,011
Women who had a birth in the past 12 months: 62 (59 now married, 0 unmarried) Women who did not have a birth in the past 12 months: 1,388 (792 now married, 572 unmarried)
Housing units in zip code 06035 with a mortgage: 1,774 (120 second mortgage, 123 both second mortgage and home equity loan) Houses without a mortgage: 66
Median monthly owner costs for units with a mortgage: $2,144 Median monthly owner costs for units without a mortgage: $956
Residents with income below the poverty level in 2022:
This zip code:
4.3%
Whole state:
9.8%
Residents with income below 50% of the poverty level in 2022:
This zip code:
2.9%
Whole state:
4.8%
Median number of rooms in houses and condos:
Here:
6.6
State:
6.5
Median number of rooms in apartments:
Here:
4.2
State:
4.0
Notable locations in this zip code not listed on our city pages
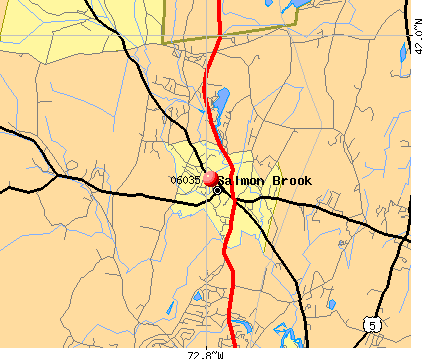
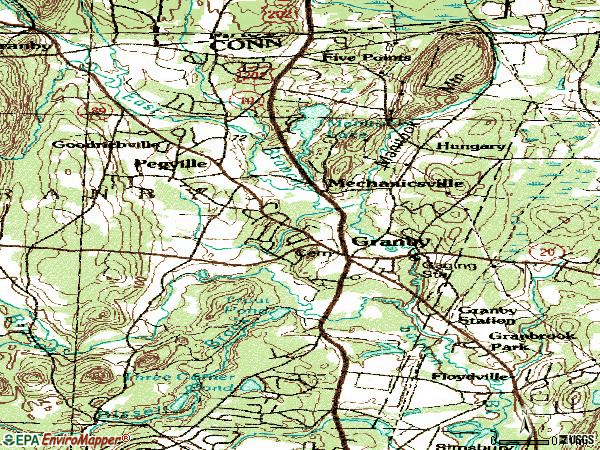
Notable locations in zip code 06035: His Lordships Industrial Park (A), Salmon Brook Historical Society Building (B), Salmon Brook Historic Society Reference and Education Center (C), Granby Town Hall (D), Granby Public Library (E), Ethel L Austin Library (F), Granby Ambulance Association (G), Lost Acres Fire Department Center Station (H), Lost Acres Fire Department North Granby Station (I). Display/hide their locations on the map
Churches in zip code 06035 include: Saint Thereses Church (A), South Congregational Church (B), Swedish Pilgrim Church (C), First Congregational Church (D), Granby Pentecostal Tabernacle (E). Display/hide their locations on the map
Lakes and reservoirs: Three Corner Pond (A), Trout Pond (B), Kettle Pond (C), Manitook Lake (D), Spring Pond (E), Lake Basile (F). Display/hide their locations on the map
Streams, rivers, and creeks: Bissell Brook (A), Creamery Brook (B), West Branch Salmon Brook (C), Dismal Brook (D), Hungary Brook (E), Kendell Brook (F). Display/hide their locations on the map
In group quarters: 128 (-1 institutionalized population)
Size of family households: 829 2-persons, 542 3-persons, 486 4-persons, 127 5-persons, 76 6-persons
Size of nonfamily households: 939 1-person, 158 2-persons
1,277 married couples with children.
126 single-parent households (29 men, 97 women).
89.2% of residents of 06035 zip code speak English at home.
2.5% of residents speak Spanish at home (83% very well, 17% well).
6.9% of residents speak other Indo-European language at home (87% very well, 3% well, 10% not well).
1.0% of residents speak Asian or Pacific Island language at home (81% very well, 19% well).
0.3% of residents speak other language at home (100% very well).
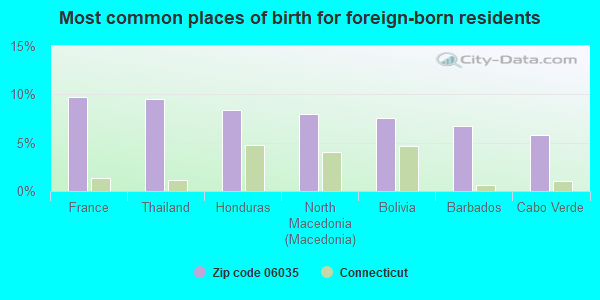
Foreign born population: 465 (5.9%) (68.8% of them are naturalized citizens)
This zip code:
5.9%
Whole state:
15.7%
10%France
9%Thailand
8%Honduras
8%North Macedonia (Macedonia)
8%Bolivia
7%Barbados
6%Cabo Verde
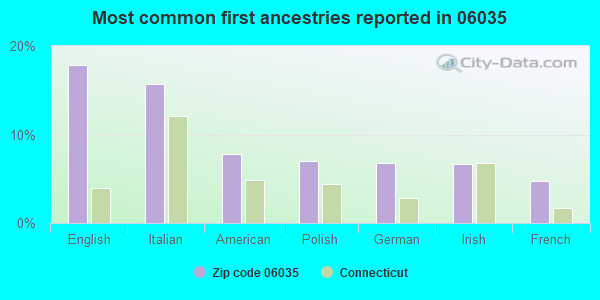
18%English
16%Italian
8%American
7%Polish
7%German
7%Irish
5%French
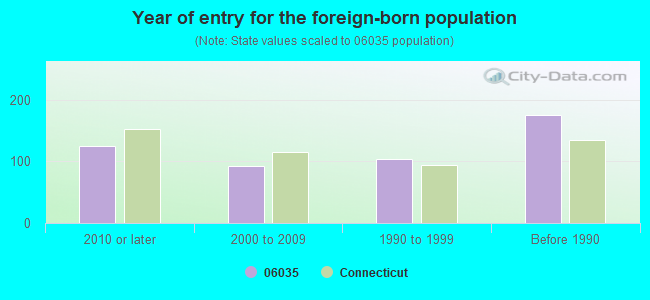
Year of entry for the foreign-born population
1242010 or later
932000 to 2009
1031990 to 1999
175Before 1990
Facilities with environmental interests located in this zip code:
FRANK M. KEARNS PRIMARY SCHOOL (5 CANTON ROAD in GRANBY, CT)
(Geographic Names Information System) (National Center for Education Statistics) - STATE ID-1 Organizations: GRANBY SCHOOL DISTRICT (SCHOOL DISTRICT)
GRANBY MEMORIAL HIGH SCHOOL (315 SALMON BROOK STREET in GRANBY, CT)
(Geographic Names Information System) (National Center for Education Statistics) - STATE ID-61 Organizations: GRANBY SCHOOL DISTRICT (SCHOOL DISTRICT)
GRANBY MEMORIAL MIDDLE SCHOOL (321 SALMON BROOK STREET in GRANBY, CT)
(Geographic Names Information System) (National Center for Education Statistics) - STATE ID-51 Organizations: GRANBY SCHOOL DISTRICT (SCHOOL DISTRICT)
HOMEBOUND (11 NORTH GRANBY ROAD in GRANBY, CT)
(National Center for Education Statistics) - STATE ID-88 Organizations: GRANBY SCHOOL DISTRICT (SCHOOL DISTRICT)
EXPRESS PHOTO INC (10 HARTFORD AVE in GRANBY, CT)
(Resource Conservation and Recovery Act (tracking hazardous waste))
IMPERIAL NURSERIES (90 SALMON BROOK ST in GRANBY, CT)
GRANBY VETERINARY HOSPITAL (136 SALMONBROOK RD in GRANBY, CT)
Conditionally Exempt Small Quantity Generators, less than 100 kg/month of hazardous waste (Resource Conservation and Recovery Act (tracking hazardous waste)) - notification Organizations: DRS MILKEY & DAVIS (CONTACT/OWNER)
GRANBY BOARD OF EDUCATION (11 NORTH GRANBY ROAD in GRANBY, CT)
COMPLIANCE ACTIVITY (Tracking inspections of insecticide, fungicide, and rodenticide, and toxic substances)
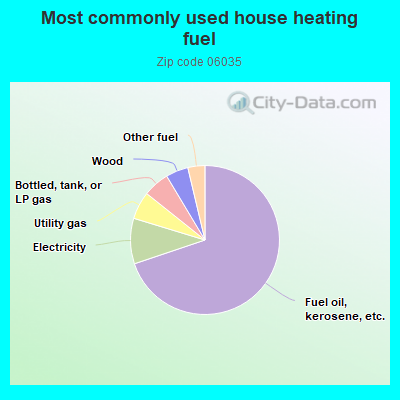
Housing units lacking complete kitchen facilities: 0.4%
69.9%Fuel oil, kerosene, etc.
9.9%Electricity
6.0%Utility gas
5.7%Bottled, tank, or LP gas
4.9%Wood
3.7%Other fuel
Population in 1990: 6,939. Population change in the 1990s: +455 (+6.6%).
Place of birth for U.S.-born residents:
This state: 4,792
Northeast: 1,713
Midwest: 262
South: 285
West: 240
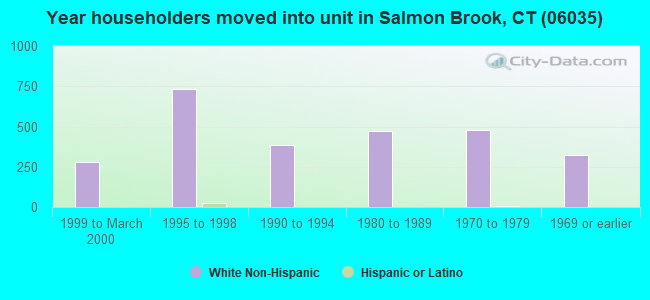
64% of the 06035 zip code residents lived in the same house 5 years ago. Out of people who lived in different houses, 71% lived in this county. Out of people who lived in different counties, 50% lived in Connecticut.
89% of the 06035 zip code residents lived in the same house 1 year ago. Out of people who lived in different houses, 49% moved from this county. Out of people who lived in different houses, 10% moved from different county within same state. Out of people who lived in different houses, 43% moved from different state.
Private vs. public school enrollment:
Students in private schools in grades 1 to 8 (elementary and middle school): 10
Here:
2.2%
Connecticut:
9.5%
Students in private schools in grades 9 to 12 (high school): 12
Here:
3.9%
Connecticut:
12.9%
Students in private undergraduate colleges: 114
Here:
42.4%
Connecticut:
35.5%
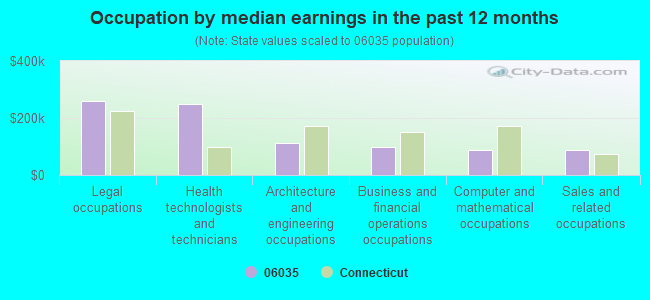
Occupation by median earnings in the past 12 months ($)
259,995Legal occupations
248,608Health technologists and technicians
110,689Architecture and engineering occupations
96,553Business and financial operations occupations
88,301Computer and mathematical occupations
86,677Sales and related occupations
Companies with federal contracts located in this zip code:
ALARM APPLICATIONS INC (496 SALMON BROOK ST in GRANBY, CT; small business) : $129,760 in 4 contractsfrom 2002 to 2005
$62,400 with Navy for Maintenance, Repair and Rebuilding of Equipment -- Miscellaneous. Taking place in RI. Signed on 2005-08-12. Completion date: 2005-12-31.
$34,400 with Public Buildings Service for Maintenance, Repair or Alteration of Real Property -- Office Buildings. Taking place in PA. Signed on 2004-05-14. Effective on 2004-05-10. Completion date: 2004-08-30.
$32,960 with Army for Maintenance, Repair or Alteration of Real Property -- Office Buildings. Taking place in NY. Signed on 2002-04-03. Completion date: 2002-06-04.
$0 with Public Buildings Service for Maintenance, Repair or Alteration of Real Property -- Office Buildings. Taking place in PA. Signed on 2004-06-09. Completion date: 2004-08-30.
Top industries in this zip code by the number of employees in 2005:
Health Care and Social Assistance: Nursing Care Facilities (100-249 employees: 1 establishment)
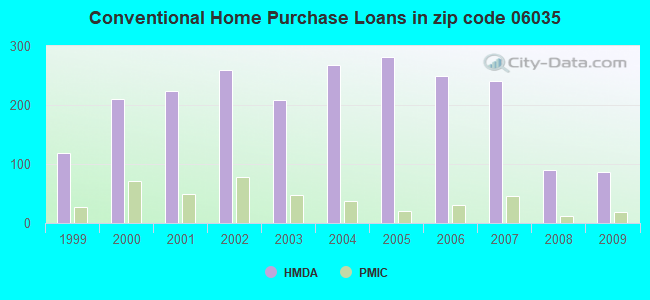
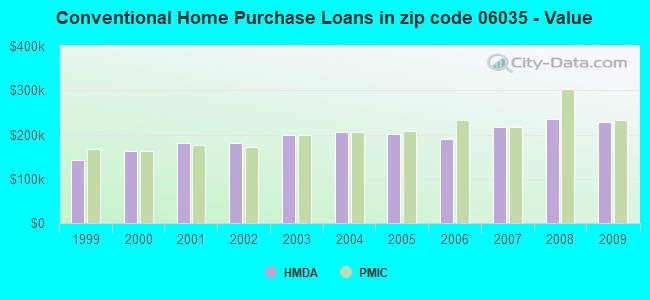
Detailed PMIC statistics for the following Tracts:4681.01
, 4681.02
2004 - 2018 National Fire Incident Reporting System (NFIRS) incidents
Based on the data from the years 2004 - 2018 the average number of fires per year is 36. The highest number of fire incidents - 67 took place in 2013, and the least - 8 in 2004. The data has a rising trend.
When looking into fire subcategories, the most reports belonged to: Structure Fires (52.4%), and Outside Fires (30.7%).
Fire incident types reported to NFIRS in Zip Code 06035


 Nearest zip codes: 06090, 06081, 06060, 06026, 06070, 01077.


 Based on the data from the years 2004 - 2018 the average number of fires per year is 36. The highest number of fire incidents - 67 took place in 2013, and the least - 8 in 2004. The data has a rising trend.
 When looking into fire subcategories, the most reports belonged to: Structure Fires (52.4%), and Outside Fires (30.7%).