Estimated zip code population in 2022: 3,390 Zip code population in 2010: 3,209 Zip code population in 2000: 2,945
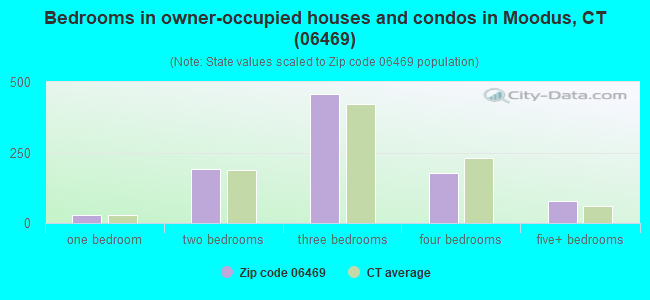
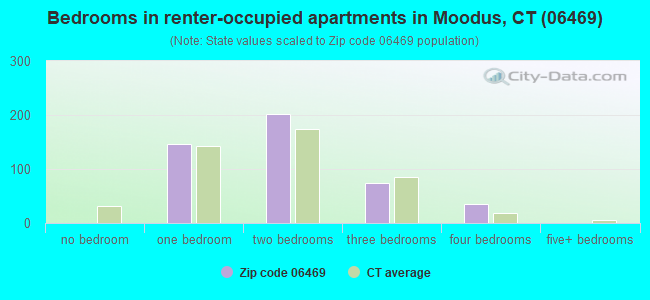
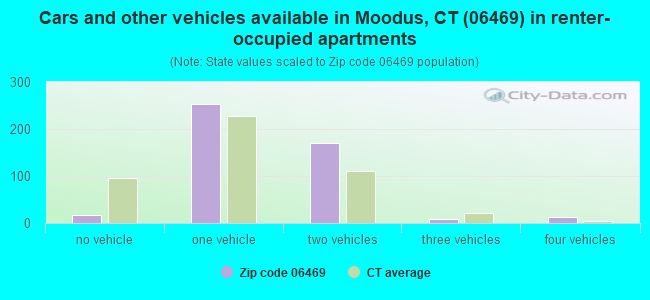
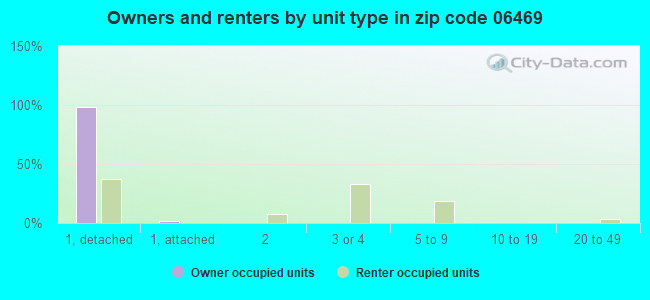
Houses and condos: 1,471 Renter-occupied apartments: 463
% of renters here:
33%
State:
34%
March 2022 cost of living index in zip code 06469: 122.6 (high, U.S. average is 100)
Land area: 10.1 sq. mi. Water area: 0.4 sq. mi.
Population density: 337 people per square mile
(very low).
OSM Map
Google Map
MSN Map
OSM Map
General Map
Google Map
MSN Map
OSM Map
Google Map
MSN Map
OSM Map
Google Map
MSN Map
Please wait while loading the map...
Real estate property taxes paid for housing units in 2022:
This zip code:
1.6% ($5,400)
Connecticut:
1.8% ($6,189)
Median real estate property taxes paid for housing units with mortgages in 2022: $5,360 (1.7%) Median real estate property taxes paid for housing units with no mortgage in 2022: $5,518 (1.4%)
Business Search- 14 Million verified businesses
Males: 1,554
(45.8%)
Females: 1,836
(54.2%)
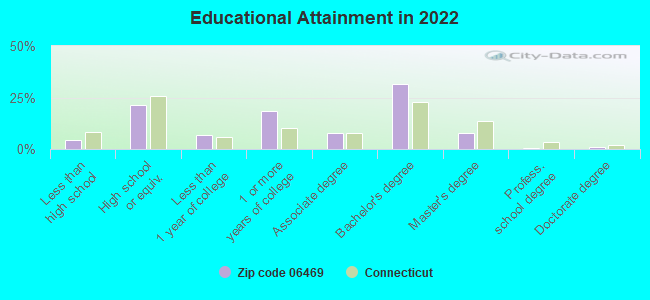
For population 25 years and over in 06469:
High school or higher: 94.7%
Bachelor's degree or higher: 40.9%
Graduate or professional degree: 9.5%
Unemployed: 2.8%
Mean travel time to work (commute): 32.4 minutes
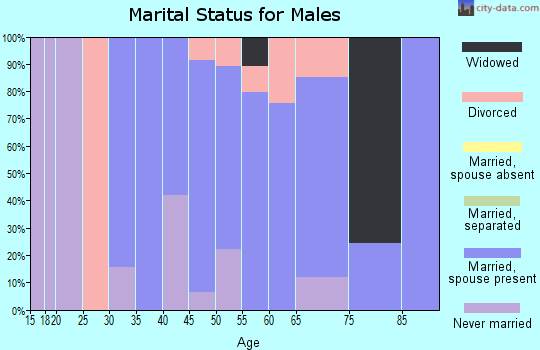
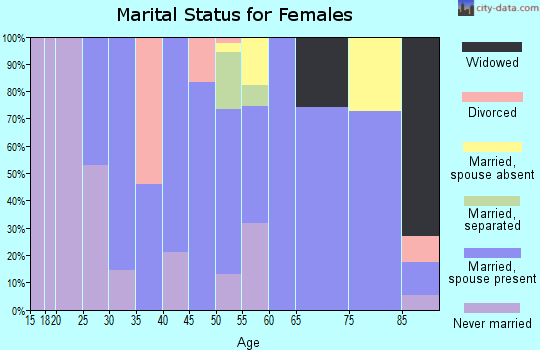
For population 15 years and over in 06469:
Never married: 21.0%
Now married: 56.6%
Separated: 0.0%
Widowed: 4.6%
Divorced: 17.8%
Zip code 06469 compared to state average:
Unemployed percentage below state average.
Black race population percentage significantly below state average.
Hispanic race population percentage significantly below state average.
Median age above state average.
Foreign-born population percentage significantly below state average.
Length of stay since moving in significantly above state average.
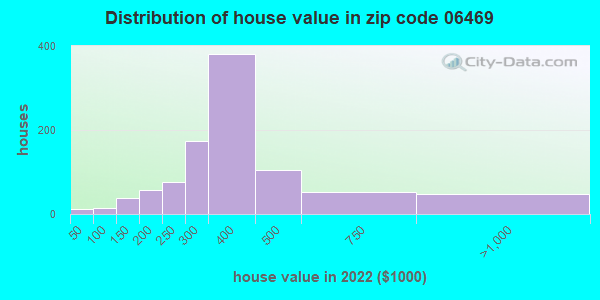
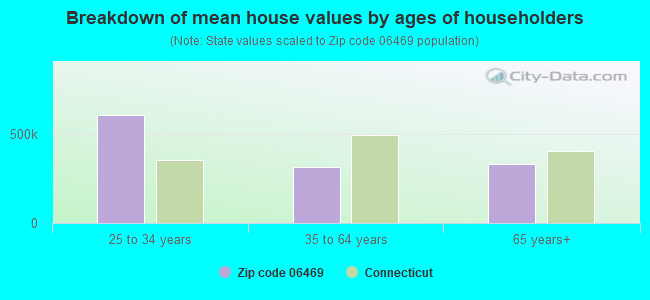
Estimated median house/condo value in 2022: $343,660
06469:
$343,660
Connecticut:
$347,200
According to our research of Connecticut and other state lists, there were 4 registered sex offenders living in 06469 zip code as of April 27, 2024. The ratio of all residents to sex offenders in zip code 06469 is 794 to 1. The ratio of registered sex offenders to all residents in this zip code is near the state average.
Median resident age:
This zip code:
46.5 years
Connecticut median age:
40.9 years
Average household size:
This zip code:
2.4 people
Connecticut:
2.5 people
Averages for the 2020 tax year for zip code 06469, filed in 2021:
Average Adjusted Gross Income (AGI) in 2020: $79,825 (Individual Income Tax Returns)
Here:
$79,825
State:
$105,931
Salary/wage: $71,546 (reported on 81.0% of returns)
Here:
$71,546
State:
$83,540
(% of AGI for various income ranges: 1019.3% for AGIs below $25k, 3083.1% for AGIs $25k-50k, 6044.4% for AGIs $50k-75k, 8639.3% for AGIs $75k-100k, 18507.4% for AGIs $100k-200k, 95205.0% for AGIs over 200k)
Taxable interest for individuals: $735 (reported on 36.9% of returns)
This zip code:
$735
Connecticut:
$3,402
(% of AGI for various income ranges: 20.0% for AGIs below $25k, 8.4% for AGIs $25k-50k, 35.6% for AGIs $50k-75k, 72.9% for AGIs $75k-100k, 53.0% for AGIs $100k-200k, 425.0% for AGIs over 200k)
Ordinary dividends: $2,757 (reported on 25.0% of returns)
Here:
$2,757
State:
$12,683
(% of AGI for various income ranges: 25.4% for AGIs below $25k, 31.6% for AGIs $25k-50k, 111.7% for AGIs $50k-75k, 84.3% for AGIs $75k-100k, 196.1% for AGIs $100k-200k, 1080.0% for AGIs over 200k)
Net capital gain/loss in AGI: +$3,794 (reported on 19.6% of returns)
Here:
+$3,794
State:
+$44,158
(% of AGI for various income ranges: 11.1% for AGIs below $25k, 25.3% for AGIs $25k-50k, 44.4% for AGIs $50k-75k, 96.4% for AGIs $75k-100k, 187.4% for AGIs $100k-200k, 2470.0% for AGIs over 200k)
Profit/loss from business: +$10,696 (reported on 13.7% of returns)
Here:
+$10,696
State:
+$22,988
(% of AGI for various income ranges: 107.1% for AGIs below $25k, 144.7% for AGIs $25k-50k, 259.4% for AGIs $50k-75k, 114.3% for AGIs $75k-100k, 267.4% for AGIs $100k-200k, 2275.0% for AGIs over 200k)
Taxable individual retirement arrangement distribution: $18,400 (reported on 11.3% of returns)
06469:
$18,400
Connecticut:
$22,031
(% of AGI for various income ranges: 126.8% for AGIs below $25k, 135.3% for AGIs $25k-50k, 439.4% for AGIs $50k-75k, 833.5% for AGIs $100k-200k)
Total itemized deductions: $22,859 (reported on 10.1% of returns)
Here:
$22,859
State:
$37,613
(% of AGI for various income ranges: 203.8% for AGIs $25k-50k, 408.9% for AGIs $50k-75k, 585.7% for AGIs $75k-100k, 729.6% for AGIs $100k-200k)
Charity contributions: $3,891 (reported on 6.5% of returns)
Here:
$3,891
State:
$13,557
(% of AGI for various income ranges: 38.3% for AGIs $50k-75k, 36.4% for AGIs $75k-100k, 133.9% for AGIs $100k-200k)
Taxes paid: $8,165 (reported on 10.1% of returns)
06469:
$8,165
State:
$9,096
(% of AGI for various income ranges: 45.9% for AGIs $25k-50k, 144.4% for AGIs $50k-75k, 246.4% for AGIs $75k-100k, 276.5% for AGIs $100k-200k)
Earned income credit: $1,592 (reported on 7.7% of returns)
Here:
$1,592
State:
$2,059
(% of AGI for various income ranges: 34.6% for AGIs below $25k, 34.4% for AGIs $25k-50k)
Percentage of individuals using paid preparers for their 2020 taxes: 91.7%
Here:
92%
State:
93%
(% for various income ranges: 87.5% for AGIs below $25k, 94.6% for AGIs $25k-50k, 92.0% for AGIs $50k-75k, 89.5% for AGIs $75k-100k, 94.7% for AGIs $100k-200k, 88.9% for AGIs over 200k)
Averages for the 2012 tax year for zip code 06469, filed in 2013:
Average Adjusted Gross Income (AGI) in 2012: $66,238 (Individual Income Tax Returns)
Here:
$66,238
State:
$93,290
Salary/wage: $60,767 (reported on 85.8% of returns)
Here:
$60,767
State:
$73,117
(% of AGI for various income ranges: 66.8% for AGIs below $25k, 78.0% for AGIs $25k-50k, 75.5% for AGIs $50k-75k, 82.0% for AGIs $75k-100k, 83.7% for AGIs $100k-200k, 67.6% for AGIs over 200k)
Taxable interest for individuals: $660 (reported on 52.9% of returns)
This zip code:
$660
Connecticut:
$2,530
(% of AGI for various income ranges: 1.4% for AGIs below $25k, 0.4% for AGIs $25k-50k, 1.1% for AGIs $50k-75k, 0.3% for AGIs $75k-100k, 0.4% for AGIs $100k-200k, 0.3% for AGIs over 200k)
Ordinary dividends: $1,790 (reported on 25.2% of returns)
Here:
$1,790
State:
$10,909
(% of AGI for various income ranges: 1.9% for AGIs below $25k, 0.8% for AGIs $25k-50k, 1.1% for AGIs $50k-75k, 0.6% for AGIs $75k-100k, 0.4% for AGIs $100k-200k, 0.5% for AGIs over 200k)
Net capital gain/loss in AGI: +$1,837 (reported on 17.4% of returns)
Here:
+$1,837
State:
+$34,090
(% of AGI for various income ranges: 0.8% for AGIs $50k-75k, 0.7% for AGIs $100k-200k, 1.2% for AGIs over 200k)
Profit/loss from business: +$12,354 (reported on 15.5% of returns)
Here:
+$12,354
State:
+$22,741
(% of AGI for various income ranges: 9.4% for AGIs below $25k, 4.4% for AGIs $25k-50k, 3.3% for AGIs $50k-75k, 3.8% for AGIs $75k-100k, 1.9% for AGIs $100k-200k)
Taxable individual retirement arrangement distribution: $12,763 (reported on 12.3% of returns)
06469:
$12,763
Connecticut:
$19,976
(% of AGI for various income ranges: 4.1% for AGIs below $25k, 2.3% for AGIs $25k-50k, 2.7% for AGIs $50k-75k, 2.2% for AGIs $75k-100k, 2.8% for AGIs $100k-200k)
Total itemized deductions: $20,914 (21% of AGI, reported on 47.7% of returns)
Here:
$20,914
State:
$33,239
Here:
20.7% of AGI
State:
18.9% of AGI
(% of AGI for various income ranges: 8.1% for AGIs below $25k, 12.6% for AGIs $25k-50k, 17.1% for AGIs $50k-75k, 16.3% for AGIs $75k-100k, 16.3% for AGIs $100k-200k, 12.3% for AGIs over 200k)
Charity contributions: $1,576 (reported on 37.4% of returns)
Here:
$1,576
State:
$4,947
(% of AGI for various income ranges: 0.3% for AGIs below $25k, 0.7% for AGIs $25k-50k, 0.8% for AGIs $50k-75k, 0.8% for AGIs $75k-100k, 1.2% for AGIs $100k-200k, 0.6% for AGIs over 200k)
Taxes paid: $9,914 (reported on 47.7% of returns)
06469:
$9,914
State:
$17,397
(% of AGI for various income ranges: 2.6% for AGIs below $25k, 4.2% for AGIs $25k-50k, 7.1% for AGIs $50k-75k, 8.2% for AGIs $75k-100k, 8.2% for AGIs $100k-200k, 7.3% for AGIs over 200k)
Earned income credit: $1,550 (reported on 7.7% of returns)
Here:
$1,550
State:
$2,053
(% of AGI for various income ranges: 2.7% for AGIs below $25k, 0.4% for AGIs $25k-50k)
Percentage of individuals using paid preparers for their 2012 taxes: 47.7%
Here:
48%
State:
55%
(% for various income ranges: 41.9% for AGIs below $25k, 45.5% for AGIs $25k-50k, 54.2% for AGIs $50k-75k, 52.4% for AGIs $75k-100k, 50.0% for AGIs $100k-200k, 50.0% for AGIs over 200k)
Averages for the 2004 tax year for zip code 06469, filed in 2005:
Average Adjusted Gross Income (AGI) in 2004: $54,391 (Individual Income Tax Returns)
Here:
$54,391
State:
$73,265
Salary/wage: $51,177 (reported on 85.5% of returns)
Here:
$51,177
State:
$62,030
(% of AGI for various income ranges: 103.7% for AGIs below $10k, 65.7% for AGIs $10k-25k, 79.3% for AGIs $25k-50k, 84.4% for AGIs $50k-75k, 81.8% for AGIs $75k-100k, 79.3% for AGIs over 100k)
Taxable interest for individuals: $999 (reported on 59.1% of returns)
This zip code:
$999
Connecticut:
$2,287
(% of AGI for various income ranges: 6.5% for AGIs below $10k, 3.4% for AGIs $10k-25k, 1.2% for AGIs $25k-50k, 0.7% for AGIs $50k-75k, 0.9% for AGIs $75k-100k, 0.9% for AGIs over 100k)
Taxable dividends: $2,123 (reported on 30.9% of returns)
Here:
$2,123
State:
$5,735
(% of AGI for various income ranges: 5.6% for AGIs below $10k, 1.4% for AGIs $10k-25k, 1.4% for AGIs $25k-50k, 0.4% for AGIs $50k-75k, 0.7% for AGIs $75k-100k, 1.7% for AGIs over 100k)
Net capital gain/loss: +$4,161 (reported on 21.1% of returns)
Here:
+$4,161
State:
+$23,694
(% of AGI for various income ranges: -2.6% for AGIs below $10k, 1.6% for AGIs $10k-25k, 0.0% for AGIs $25k-50k, 1.0% for AGIs $50k-75k, 1.9% for AGIs $75k-100k, 2.7% for AGIs over 100k)
Profit/loss from business: +$12,275 (reported on 16.8% of returns)
Here:
+$12,275
State:
+$20,783
(% of AGI for various income ranges: 6.2% for AGIs below $10k, 9.6% for AGIs $10k-25k, 5.4% for AGIs $25k-50k, 4.5% for AGIs $50k-75k, 2.0% for AGIs $75k-100k, 2.9% for AGIs over 100k)
IRA payment deduction: $3,000 (reported on 2.6% of returns)
06469:
$3,000
Connecticut:
$3,216
Total itemized deductions: $17,667 (21% of AGI, reported on 48.3% of returns)
Here:
$17,667
State:
$24,919
Here:
21.3% of AGI
State:
18.6% of AGI
(% of AGI for various income ranges: 12.9% for AGIs below $10k, 11.1% for AGIs $10k-25k, 14.1% for AGIs $25k-50k, 18.5% for AGIs $50k-75k, 17.8% for AGIs $75k-100k, 14.4% for AGIs over 100k)
Charity contributions deductions: $1,641 (2% of AGI, reported on 42.2% of returns)
Here:
$1,641
State:
$3,762
Here:
1.9% of AGI
State:
2.7% of AGI
(% of AGI for various income ranges: 1.0% for AGIs $10k-25k, 1.0% for AGIs $25k-50k, 1.2% for AGIs $50k-75k, 1.2% for AGIs $75k-100k, 1.6% for AGIs over 100k)
Total tax: $7,678 (reported on 83.5% of returns)
06469:
$7,678
State:
$15,148
(% of AGI for various income ranges: 3.2% for AGIs below $10k, 5.3% for AGIs $10k-25k, 8.2% for AGIs $25k-50k, 9.6% for AGIs $50k-75k, 10.0% for AGIs $75k-100k, 16.8% for AGIs over 100k)
Earned income credit: $1,193 (reported on 7.8% of returns)
Here:
$1,193
State:
$1,570
Percentage of individuals using paid preparers for their 2004 taxes: 53.2%
Here:
53%
State:
59%
(% for various income ranges: 40.4% for AGIs below $10k, 54.3% for AGIs $10k-25k, 55.7% for AGIs $25k-50k, 58.6% for AGIs $50k-75k, 56.0% for AGIs $75k-100k, 53.4% for AGIs over 100k)
Household received Food Stamps/SNAP in the past 12 months: 71 Household did not receive Food Stamps/SNAP in the past 12 months: 1,321
Women who had a birth in the past 12 months: 16 (15 now married, 0 unmarried) Women who did not have a birth in the past 12 months: 743 (351 now married, 385 unmarried)
Housing units in zip code 06469 with a mortgage: 605 (10 second mortgage) Median monthly owner costs for units with a mortgage: $1,736 Median monthly owner costs for units without a mortgage: $785
Residents with income below the poverty level in 2022:
This zip code:
3.8%
Whole state:
9.8%
Residents with income below 50% of the poverty level in 2022:
This zip code:
2.1%
Whole state:
4.8%
Median number of rooms in houses and condos:
Here:
7.2
State:
6.5
Median number of rooms in apartments:
Here:
3.8
State:
4.0
Notable locations in this zip code not listed on our city pages
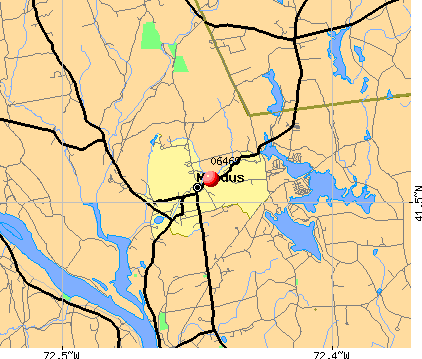
Notable locations in zip code 06469: Banner Golf Course (A), Nathan Hale Place (B), Amasa Day House (C), East Haddam Free Public Library (D), East Haddam Fire Company 2 Moodus Station (E). Display/hide their locations on the map
Lakes and reservoirs: Cone Pond (A), Dogwood Pond (B), Johnson Millpond (C), Number One Pond (D), Leesville Pond (E). Display/hide their locations on the map
In group quarters: 90 (-1 institutionalized population)
Size of family households: 507 2-persons, 203 3-persons, 164 4-persons, 23 5-persons, 41 6-persons
Size of nonfamily households: 269 1-person, 189 2-persons, 5 3-persons
445 married couples with children.
125 single-parent households (125 women).
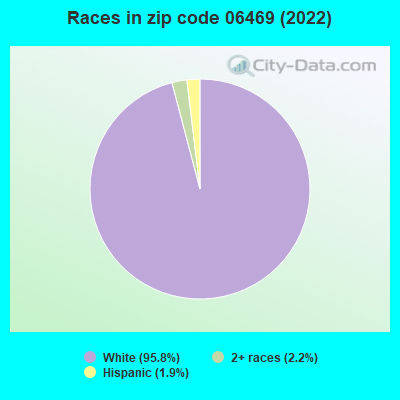
94.1% of residents of 06469 zip code speak English at home.
2.1% of residents speak Spanish at home (100% very well).
2.3% of residents speak other Indo-European language at home (66% very well, 34% not well).
0.5% of residents speak other language at home (100% very well).
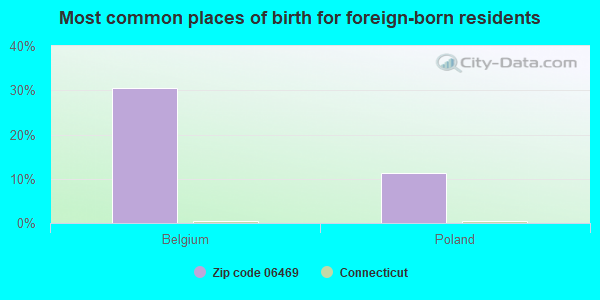
Foreign born population: 98 (2.9%) (66.3% of them are naturalized citizens)
This zip code:
2.9%
Whole state:
15.7%
31%Belgium
11%Poland
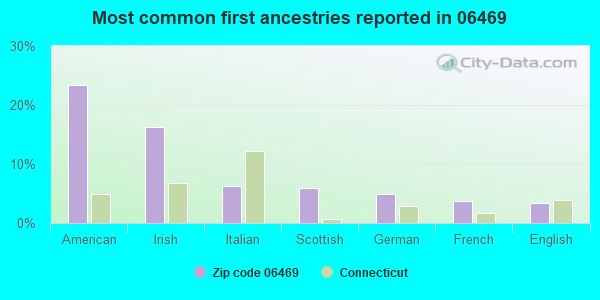
23%American
16%Irish
6%Italian
6%Scottish
5%German
4%French
3%English
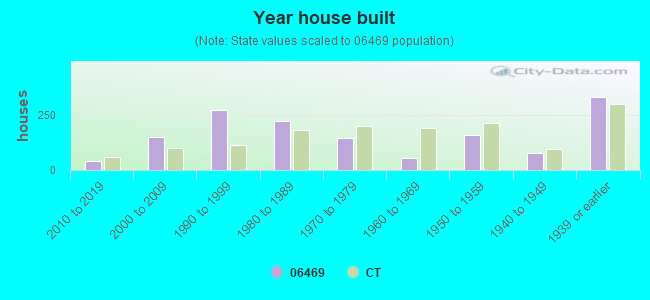
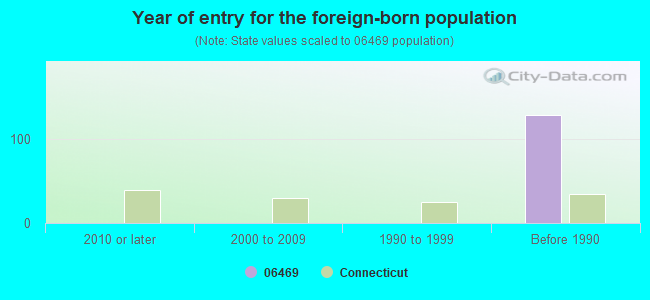
Year of entry for the foreign-born population
02010 or later
02000 to 2009
01990 to 1999
129Before 1990
Facilities with environmental interests located in this zip code:
HOMEBOUND (26 PLAINS ROAD in MOODUS, CT)
(National Center for Education Statistics) - STATE ID-88 Organizations: EAST HADDAM SCHOOL DISTRICT (SCHOOL DISTRICT)
BROWNELL & CO INC (423 EAST HADDAM-MOODUS ROAD in MOODUS, CT)
AIR MAJOR (AIRS/AFS) COMPLIANCE ACTIVITY (Tracking inspections of insecticide, fungicide, and rodenticide, and toxic substances) CRITERIA AND HAZARDOUS AIR POLLUTANT INVENTORY (Inventory of air pollution sources) TRI REPORTER (Tracking of toxic chemicals releasing facilities) Business SIC classification: LACE AND WARP KNIT FABRIC MILLS; CORDAGE AND TWINE Alternative names: BROWNELL & CO, INC
Small Quantity Generators, between 100 kg and 1000 kg of hazardous waste/month (Resource Conservation and Recovery Act (tracking hazardous waste)) - notification Organizations: 7 ELEVEN INC (CONTACT/OWNER)
, CHRISTYS MARKET INC (CONTACT/OWNER)
EAST HADDAM ELEMENTARY SCHOOL (PLAINS ROAD in MOODUS, CT)
COMPLIANCE ACTIVITY (Tracking inspections of insecticide, fungicide, and rodenticide, and toxic substances)
Housing units lacking complete kitchen facilities: 0.8%
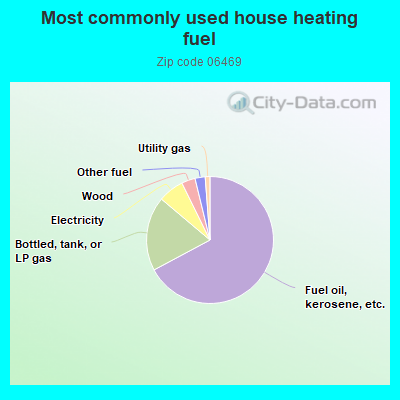
67.4%Fuel oil, kerosene, etc.
19.0%Bottled, tank, or LP gas
6.6%Electricity
3.5%Wood
2.6%Other fuel
1.2%Utility gas
Population in 1990: 2,634. Population change in the 1990s: +311 (+11.8%).
Place of birth for U.S.-born residents:
This state: 2,485
Northeast: 487
Midwest: 72
South: 96
West: 69
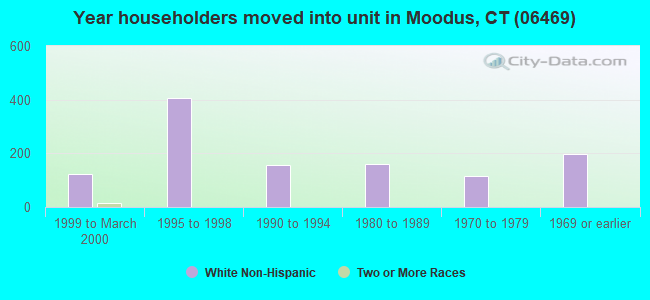
53% of the 06469 zip code residents lived in the same house 5 years ago. Out of people who lived in different houses, 53% lived in this county. Out of people who lived in different counties, 50% lived in Connecticut.
90% of the 06469 zip code residents lived in the same house 1 year ago. Out of people who lived in different houses, 41% moved from this county. Out of people who lived in different houses, 34% moved from different county within same state. Out of people who lived in different houses, 21% moved from different state.
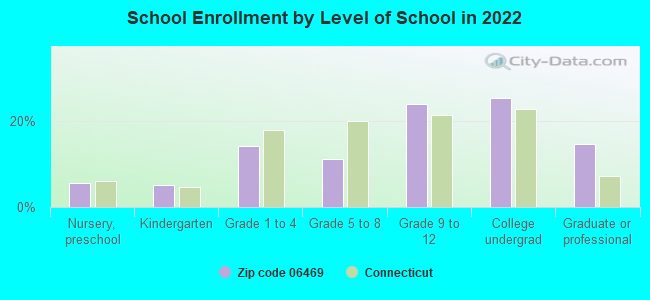
Private vs. public school enrollment:
Students in private schools in grades 1 to 8 (elementary and middle school): 131
Here:
54.8%
Connecticut:
9.5%
Students in private schools in grades 9 to 12 (high school): 45
Here:
22.0%
Connecticut:
12.9%
Students in private undergraduate colleges:
Here:
0.0%
Connecticut:
35.5%
Occupation by median earnings in the past 12 months ($)
107,338Business and financial operations occupations
58,788Management occupations
54,243Sales and related occupations
53,991Production occupations
51,544Office and administrative support occupations
48,539Construction and extraction occupations
Companies with federal contracts located in this zip code:
BROWNELL & COMPANY, INC (429 EAST HADDAM-MOODUS RD in MOODUS, CT; small business) : $3,228,054 in 19 contractsfrom 2000 to 2005
Contracts for Parachutes; Aerial Pick Up, Delivery, Recovery Systems; and Cargo Tie Down Equipment, Individual Equipment by Army, Defense Logistics Agency Signed by year:2000: $343,528; 2001: $368,684; 2002: $526,768; 2003: $1,025,417; 2004: $1,982,569; 2005: -$1,018,912; 2006: $0.
Biggest contracts:
$1,637,250 with Army for Parachutes; Aerial Pick Up, Delivery, Recovery Systems; and Cargo Tie Down Equipment. Signed on 2004-10-29. Completion date: 2006-12-12.
$337,208, same as above.Signed on 2002-10-30. Completion date: 2005-12-11.
$323,312, same as above.Signed on 2005-03-11. Completion date: 2005-12-11.
$295,026, same as above.Signed on 2005-12-01. Completion date: 2005-12-11.
Top industries in this zip code by the number of employees in 2005:
Health Care and Social Assistance: Nursing Care Facilities (100-249 employees: 1 establishment)
Health Care and Social Assistance: Child Day Care Services (10-19: 1, 5-9: 1, 1-4: 2)
Accommodation and Food Services: Full-Service Restaurants (10-19: 1, 1-4: 2)
Administrative and Support and Waste Management and Remediation Services: Exterminating and Pest Control Services (10-19: 1)
Health Care and Social Assistance: Offices of Dentists (10-19: 1)
People in group quarters in 2010:
73 people in nursing facilities/skilled-nursing facilities
People in group quarters in 2000:
77 people in nursing homes
Home Mortgage Disclosure Act Aggregated Statistics For Year 2009 (Based on 2 partial tracts)
A) FHA, FSA/RHS & VA Home Purchase Loans
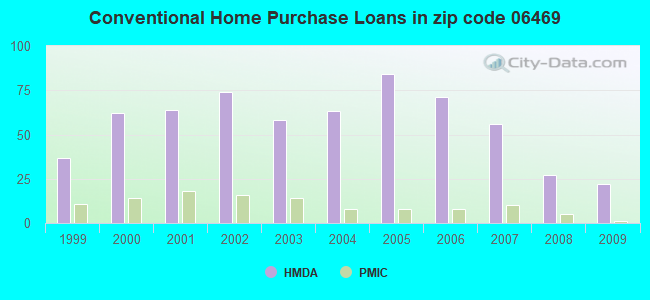
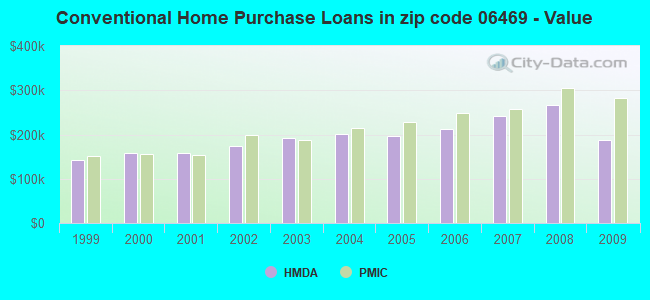
B) Conventional Home Purchase Loans
C) Refinancings
D) Home Improvement Loans
F) Non-occupant Loans on < 5 Family Dwellings (A B C & D)
Number
Average Value
Number
Average Value
Number
Average Value
Number
Average Value
Number
Average Value
LOANS ORIGINATED
14
$256,292
22
$186,600
111
$228,826
12
$110,564
9
$388,208
APPLICATIONS APPROVED, NOT ACCEPTED
1
$266,230
2
$177,120
8
$221,356
1
$17,890
0
$0
APPLICATIONS DENIED
0
$0
4
$307,955
38
$267,028
3
$101,160
3
$277,917
APPLICATIONS WITHDRAWN
1
$107,000
1
$176,390
26
$250,878
1
$104,810
1
$290,330
FILES CLOSED FOR INCOMPLETENESS
0
$0
1
$144,250
5
$302,678
0
$0
1
$157,040
Aggregated Statistics For Year 2008 (Based on 2 partial tracts)
A) FHA, FSA/RHS & VA Home Purchase Loans
B) Conventional Home Purchase Loans
C) Refinancings
D) Home Improvement Loans
F) Non-occupant Loans on < 5 Family Dwellings (A B C & D)
Number
Average Value
Number
Average Value
Number
Average Value
Number
Average Value
Number
Average Value
LOANS ORIGINATED
8
$275,452
27
$265,947
68
$201,800
20
$84,361
7
$282,300
APPLICATIONS APPROVED, NOT ACCEPTED
0
$0
5
$259,218
12
$245,657
1
$52,950
1
$227,150
APPLICATIONS DENIED
2
$245,230
4
$300,378
36
$244,258
9
$91,178
2
$285,040
APPLICATIONS WITHDRAWN
2
$219,485
4
$336,075
16
$258,424
3
$96,413
1
$322,110
FILES CLOSED FOR INCOMPLETENESS
0
$0
1
$447,000
1
$171,280
2
$119,970
0
$0
Aggregated Statistics For Year 2007 (Based on 2 partial tracts)
A) FHA, FSA/RHS & VA Home Purchase Loans
B) Conventional Home Purchase Loans
C) Refinancings
D) Home Improvement Loans
F) Non-occupant Loans on < 5 Family Dwellings (A B C & D)
Number
Average Value
Number
Average Value
Number
Average Value
Number
Average Value
Number
Average Value
LOANS ORIGINATED
3
$313,097
56
$242,571
80
$195,857
31
$79,849
11
$197,739
APPLICATIONS APPROVED, NOT ACCEPTED
1
$180,770
6
$185,827
13
$217,462
2
$39,805
1
$223,870
APPLICATIONS DENIED
0
$0
8
$180,364
38
$220,542
12
$99,638
6
$195,930
APPLICATIONS WITHDRAWN
0
$0
5
$265,720
15
$210,331
4
$91,482
1
$314,800
FILES CLOSED FOR INCOMPLETENESS
0
$0
1
$353,150
4
$182,235
0
$0
0
$0
Aggregated Statistics For Year 2006 (Based on 2 partial tracts)
A) FHA, FSA/RHS & VA Home Purchase Loans
B) Conventional Home Purchase Loans
C) Refinancings
D) Home Improvement Loans
E) Loans on Dwellings For 5+ Families
F) Non-occupant Loans on < 5 Family Dwellings (A B C & D)
Number
Average Value
Number
Average Value
Number
Average Value
Number
Average Value
Number
Average Value
Number
Average Value
LOANS ORIGINATED
4
$213,550
71
$212,757
90
$175,544
41
$88,209
1
$132,200
15
$215,541
APPLICATIONS APPROVED, NOT ACCEPTED
0
$0
9
$211,127
9
$188,687
3
$68,780
0
$0
3
$267,937
APPLICATIONS DENIED
0
$0
10
$180,811
34
$191,816
13
$74,220
0
$0
2
$119,785
APPLICATIONS WITHDRAWN
0
$0
9
$185,440
26
$197,798
3
$194,773
0
$0
2
$147,360
FILES CLOSED FOR INCOMPLETENESS
0
$0
3
$235,677
7
$189,069
1
$248,700
0
$0
0
$0
Aggregated Statistics For Year 2005 (Based on 2 partial tracts)
A) FHA, FSA/RHS & VA Home Purchase Loans
B) Conventional Home Purchase Loans
C) Refinancings
D) Home Improvement Loans
F) Non-occupant Loans on < 5 Family Dwellings (A B C & D)
Number
Average Value
Number
Average Value
Number
Average Value
Number
Average Value
Number
Average Value
LOANS ORIGINATED
2
$280,655
84
$196,408
107
$190,764
36
$61,384
14
$201,356
APPLICATIONS APPROVED, NOT ACCEPTED
0
$0
12
$224,020
18
$180,125
3
$104,083
1
$193,920
APPLICATIONS DENIED
0
$0
9
$195,260
45
$196,851
15
$62,157
1
$322,840
APPLICATIONS WITHDRAWN
0
$0
8
$220,900
53
$189,959
2
$211,450
1
$300,920
FILES CLOSED FOR INCOMPLETENESS
0
$0
2
$172,010
7
$214,164
1
$109,560
1
$161,780
Aggregated Statistics For Year 2004 (Based on 2 partial tracts)
A) FHA, FSA/RHS & VA Home Purchase Loans
B) Conventional Home Purchase Loans
C) Refinancings
D) Home Improvement Loans
F) Non-occupant Loans on < 5 Family Dwellings (A B C & D)
Number
Average Value
Number
Average Value
Number
Average Value
Number
Average Value
Number
Average Value
LOANS ORIGINATED
3
$207,557
63
$201,330
120
$161,619
23
$71,007
9
$153,181
APPLICATIONS APPROVED, NOT ACCEPTED
1
$173,840
7
$217,763
19
$163,379
4
$32,230
0
$0
APPLICATIONS DENIED
0
$0
9
$201,347
40
$171,699
11
$88,279
4
$136,128
APPLICATIONS WITHDRAWN
0
$0
7
$271,761
53
$186,900
3
$51,127
1
$587,240
FILES CLOSED FOR INCOMPLETENESS
0
$0
1
$138,780
7
$179,104
1
$32,870
0
$0
Aggregated Statistics For Year 2003 (Based on 2 partial tracts)
A) FHA, FSA/RHS & VA Home Purchase Loans
B) Conventional Home Purchase Loans
C) Refinancings
D) Home Improvement Loans
E) Loans on Dwellings For 5+ Families
F) Non-occupant Loans on < 5 Family Dwellings (A B C & D)
Number
Average Value
Number
Average Value
Number
Average Value
Number
Average Value
Number
Average Value
Number
Average Value
LOANS ORIGINATED
3
$191,363
58
$191,510
297
$154,419
13
$51,409
1
$216,560
13
$144,619
APPLICATIONS APPROVED, NOT ACCEPTED
1
$184,430
9
$197,858
40
$139,452
7
$50,346
0
$0
2
$102,255
APPLICATIONS DENIED
1
$134,030
6
$161,540
58
$162,734
8
$41,176
0
$0
2
$126,905
APPLICATIONS WITHDRAWN
0
$0
5
$216,126
51
$167,018
4
$48,298
0
$0
3
$97,873
FILES CLOSED FOR INCOMPLETENESS
0
$0
0
$0
6
$174,687
1
$36,150
0
$0
0
$0
Aggregated Statistics For Year 2002 (Based on 2 partial tracts)
A) FHA, FSA/RHS & VA Home Purchase Loans
B) Conventional Home Purchase Loans
C) Refinancings
D) Home Improvement Loans
F) Non-occupant Loans on < 5 Family Dwellings (A B C & D)
Number
Average Value
Number
Average Value
Number
Average Value
Number
Average Value
Number
Average Value
LOANS ORIGINATED
6
$166,592
74
$173,677
183
$147,475
26
$56,817
7
$114,569
APPLICATIONS APPROVED, NOT ACCEPTED
0
$0
9
$184,832
22
$128,600
5
$52,516
3
$87,890
APPLICATIONS DENIED
0
$0
6
$141,150
42
$121,403
8
$53,501
1
$72,310
APPLICATIONS WITHDRAWN
0
$0
4
$164,888
42
$142,219
4
$43,915
1
$74,870
FILES CLOSED FOR INCOMPLETENESS
0
$0
1
$20,450
6
$119,117
0
$0
0
$0
Aggregated Statistics For Year 2001 (Based on 2 partial tracts)
A) FHA, FSA/RHS & VA Home Purchase Loans
B) Conventional Home Purchase Loans
C) Refinancings
D) Home Improvement Loans
F) Non-occupant Loans on < 5 Family Dwellings (A B C & D)
Number
Average Value
Number
Average Value
Number
Average Value
Number
Average Value
Number
Average Value
LOANS ORIGINATED
7
$148,427
64
$157,818
129
$131,967
21
$42,346
6
$135,612
APPLICATIONS APPROVED, NOT ACCEPTED
0
$0
5
$163,026
16
$125,104
5
$24,322
3
$96,047
APPLICATIONS DENIED
0
$0
6
$145,715
26
$105,458
9
$34,897
1
$71,210
APPLICATIONS WITHDRAWN
1
$159,230
3
$162,150
28
$118,912
5
$29,070
1
$135,490
FILES CLOSED FOR INCOMPLETENESS
0
$0
1
$252,350
6
$123,803
1
$92,760
0
$0
Aggregated Statistics For Year 2000 (Based on 2 partial tracts)
A) FHA, FSA/RHS & VA Home Purchase Loans
B) Conventional Home Purchase Loans
C) Refinancings
D) Home Improvement Loans
F) Non-occupant Loans on < 5 Family Dwellings (A B C & D)
Number
Average Value
Number
Average Value
Number
Average Value
Number
Average Value
Number
Average Value
LOANS ORIGINATED
10
$142,172
62
$157,672
34
$97,229
20
$23,738
4
$140,785
APPLICATIONS APPROVED, NOT ACCEPTED
0
$0
8
$151,649
8
$103,854
3
$28,243
1
$77,420
APPLICATIONS DENIED
1
$123,070
10
$138,703
22
$69,720
6
$35,668
1
$38,710
APPLICATIONS WITHDRAWN
3
$100,187
5
$142,866
14
$119,864
3
$37,373
0
$0
FILES CLOSED FOR INCOMPLETENESS
0
$0
1
$185,890
3
$121,977
1
$32,870
0
$0
Aggregated Statistics For Year 1999 (Based on 1 partial tract)
A) FHA, FSA/RHS & VA Home Purchase Loans
B) Conventional Home Purchase Loans
C) Refinancings
D) Home Improvement Loans
F) Non-occupant Loans on < 5 Family Dwellings (A B C & D)


 Nearest zip codes: 06424, 06423, 06438, 06415, 06412, 06456.