Estimated zip code population in 2022: 9,447 Zip code population in 2010: 9,508 Zip code population in 2000: 9,051
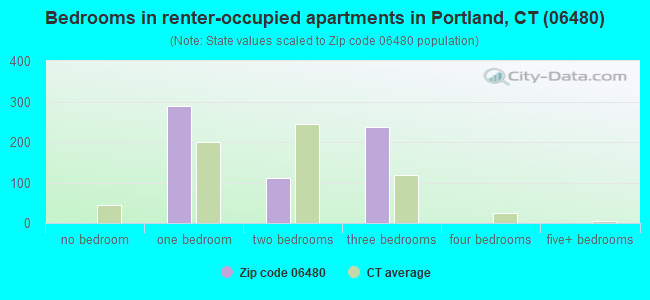
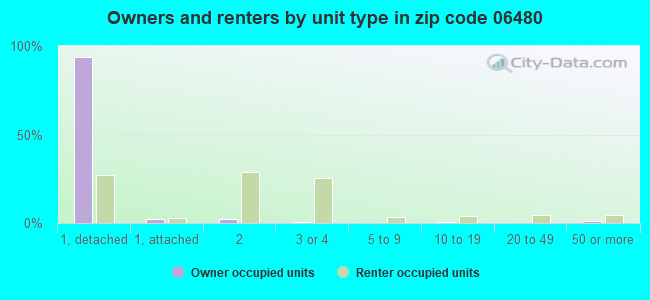
Houses and condos: 3,897 Renter-occupied apartments: 635
% of renters here:
18%
State:
34%
March 2022 cost of living index in zip code 06480: 121.3 (high, U.S. average is 100)
Land area: 23.4 sq. mi. Water area: 1.5 sq. mi.
Population density: 405 people per square mile
(low).
OSM Map
Google Map
MSN Map
OSM Map
General Map
Google Map
MSN Map
OSM Map
Google Map
MSN Map
OSM Map
Google Map
MSN Map
Please wait while loading the map...
Real estate property taxes paid for housing units in 2022:
This zip code:
1.9% ($6,004)
Connecticut:
1.8% ($6,189)
Median real estate property taxes paid for housing units with mortgages in 2022: $5,953 (1.9%) Median real estate property taxes paid for housing units with no mortgage in 2022: $6,112 (1.9%)
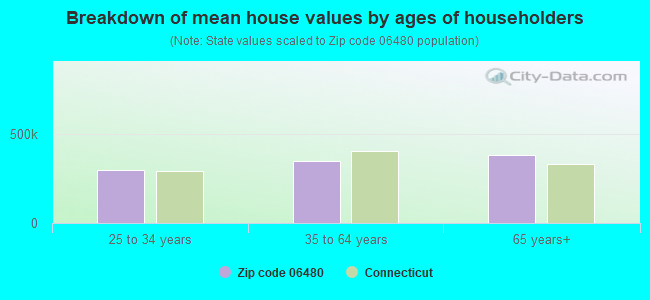
Estimated median house/condo value in 2022: $310,303
06480:
$310,303
Connecticut:
$347,200
According to our research of Connecticut and other state lists, there were 3 registered sex offenders living in 06480 zip code as of April 27, 2024. The ratio of all residents to sex offenders in zip code 06480 is 3,179 to 1. The ratio of registered sex offenders to all residents in this zip code is much lower than the state average.
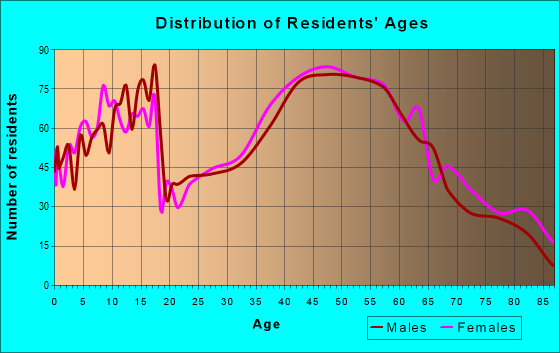
Median resident age:
This zip code:
40.8 years
Connecticut median age:
40.9 years
Average household size:
This zip code:
2.6 people
Connecticut:
2.5 people
Averages for the 2020 tax year for zip code 06480, filed in 2021:
Average Adjusted Gross Income (AGI) in 2020: $88,980 (Individual Income Tax Returns)
Here:
$88,980
State:
$105,931
Salary/wage: $79,117 (reported on 80.0% of returns)
Here:
$79,117
State:
$83,540
(% of AGI for various income ranges: 969.1% for AGIs below $25k, 3187.8% for AGIs $25k-50k, 5827.4% for AGIs $50k-75k, 8187.4% for AGIs $75k-100k, 17409.0% for AGIs $100k-200k, 63697.1% for AGIs over 200k)
Taxable interest for individuals: $1,466 (reported on 42.8% of returns)
This zip code:
$1,466
Connecticut:
$3,402
(% of AGI for various income ranges: 23.6% for AGIs below $25k, 25.1% for AGIs $25k-50k, 49.6% for AGIs $50k-75k, 110.3% for AGIs $75k-100k, 138.6% for AGIs $100k-200k, 712.9% for AGIs over 200k)
Ordinary dividends: $4,630 (reported on 28.6% of returns)
Here:
$4,630
State:
$12,683
(% of AGI for various income ranges: 45.6% for AGIs below $25k, 46.9% for AGIs $25k-50k, 105.4% for AGIs $50k-75k, 208.4% for AGIs $75k-100k, 317.6% for AGIs $100k-200k, 1490.0% for AGIs over 200k)
Net capital gain/loss in AGI: +$11,333 (reported on 24.3% of returns)
Here:
+$11,333
State:
+$44,158
(% of AGI for various income ranges: 11.5% for AGIs below $25k, 34.0% for AGIs $25k-50k, 69.6% for AGIs $50k-75k, 169.5% for AGIs $75k-100k, 492.5% for AGIs $100k-200k, 6048.6% for AGIs over 200k)
Profit/loss from business: +$18,174 (reported on 13.4% of returns)
Here:
+$18,174
State:
+$22,988
(% of AGI for various income ranges: 71.4% for AGIs below $25k, 174.6% for AGIs $25k-50k, 152.3% for AGIs $50k-75k, 264.7% for AGIs $75k-100k, 633.5% for AGIs $100k-200k, 2607.9% for AGIs over 200k)
Taxable individual retirement arrangement distribution: $19,732 (reported on 12.8% of returns)
06480:
$19,732
Connecticut:
$22,031
(% of AGI for various income ranges: 81.9% for AGIs below $25k, 159.3% for AGIs $25k-50k, 299.5% for AGIs $50k-75k, 459.2% for AGIs $75k-100k, 639.4% for AGIs $100k-200k, 1765.7% for AGIs over 200k)
Self-employed (Keogh) retirement plans: $19,357 (reported on 1.4% of returns)
06480:
$19,357
Connecticut:
$29,016
(% of AGI for various income ranges: 44.8% for AGIs $25k-50k, 48.8% for AGIs $100k-200k, 502.9% for AGIs over 200k)
Total itemized deductions: $26,519 (reported on 11.7% of returns)
Here:
$26,519
State:
$37,613
(% of AGI for various income ranges: 103.5% for AGIs below $25k, 205.8% for AGIs $25k-50k, 421.8% for AGIs $50k-75k, 684.5% for AGIs $75k-100k, 682.2% for AGIs $100k-200k, 2152.1% for AGIs over 200k)
Charity contributions: $4,719 (reported on 8.6% of returns)
Here:
$4,719
State:
$13,557
(% of AGI for various income ranges: 9.3% for AGIs $25k-50k, 28.6% for AGIs $50k-75k, 52.1% for AGIs $75k-100k, 106.2% for AGIs $100k-200k, 567.1% for AGIs over 200k)
Taxes paid: $8,807 (reported on 11.7% of returns)
06480:
$8,807
State:
$9,096
(% of AGI for various income ranges: 16.7% for AGIs below $25k, 43.3% for AGIs $25k-50k, 156.8% for AGIs $50k-75k, 267.1% for AGIs $75k-100k, 252.1% for AGIs $100k-200k, 625.7% for AGIs over 200k)
Earned income credit: $1,594 (reported on 7.2% of returns)
Here:
$1,594
State:
$2,059
(% of AGI for various income ranges: 43.1% for AGIs below $25k, 33.1% for AGIs $25k-50k)
Percentage of individuals using paid preparers for their 2020 taxes: 93.6%
Here:
94%
State:
93%
(% for various income ranges: 91.2% for AGIs below $25k, 94.0% for AGIs $25k-50k, 96.1% for AGIs $50k-75k, 92.6% for AGIs $75k-100k, 94.1% for AGIs $100k-200k, 95.0% for AGIs over 200k)
Averages for the 2012 tax year for zip code 06480, filed in 2013:
Average Adjusted Gross Income (AGI) in 2012: $76,932 (Individual Income Tax Returns)
Here:
$76,932
State:
$93,290
Salary/wage: $68,333 (reported on 82.7% of returns)
Here:
$68,333
State:
$73,117
(% of AGI for various income ranges: 66.4% for AGIs below $25k, 73.7% for AGIs $25k-50k, 71.1% for AGIs $50k-75k, 74.8% for AGIs $75k-100k, 79.8% for AGIs $100k-200k, 64.9% for AGIs over 200k)
Taxable interest for individuals: $920 (reported on 58.1% of returns)
This zip code:
$920
Connecticut:
$2,530
(% of AGI for various income ranges: 1.7% for AGIs below $25k, 0.9% for AGIs $25k-50k, 1.0% for AGIs $50k-75k, 0.6% for AGIs $75k-100k, 0.4% for AGIs $100k-200k, 0.8% for AGIs over 200k)
Ordinary dividends: $3,925 (reported on 31.6% of returns)
Here:
$3,925
State:
$10,909
(% of AGI for various income ranges: 3.4% for AGIs below $25k, 1.3% for AGIs $25k-50k, 1.7% for AGIs $50k-75k, 1.2% for AGIs $75k-100k, 1.4% for AGIs $100k-200k, 2.0% for AGIs over 200k)
Net capital gain/loss in AGI: +$8,402 (reported on 23.2% of returns)
Here:
+$8,402
State:
+$34,090
(% of AGI for various income ranges: 0.4% for AGIs $25k-50k, 0.6% for AGIs $50k-75k, 0.6% for AGIs $75k-100k, 0.8% for AGIs $100k-200k, 8.9% for AGIs over 200k)
Profit/loss from business: +$17,906 (reported on 13.5% of returns)
Here:
+$17,906
State:
+$22,741
(% of AGI for various income ranges: 5.7% for AGIs below $25k, 2.9% for AGIs $25k-50k, 2.8% for AGIs $50k-75k, 2.9% for AGIs $75k-100k, 3.2% for AGIs $100k-200k, 2.9% for AGIs over 200k)
Taxable individual retirement arrangement distribution: $13,353 (reported on 14.7% of returns)
06480:
$13,353
Connecticut:
$19,976
(% of AGI for various income ranges: 6.1% for AGIs below $25k, 2.3% for AGIs $25k-50k, 3.3% for AGIs $50k-75k, 2.7% for AGIs $75k-100k, 2.3% for AGIs $100k-200k, 1.9% for AGIs over 200k)
Self-employment retirement plans: $16,075 (reported on 1.7% of returns)
06480:
$16,075
Connecticut:
$24,004
(% of AGI for various income ranges: 0.5% for AGIs $50k-75k, 0.2% for AGIs $100k-200k, 0.9% for AGIs over 200k)
Total itemized deductions: $23,180 (20% of AGI, reported on 52.4% of returns)
Here:
$23,180
State:
$33,239
Here:
19.5% of AGI
State:
18.9% of AGI
(% of AGI for various income ranges: 16.2% for AGIs below $25k, 12.0% for AGIs $25k-50k, 17.0% for AGIs $50k-75k, 18.0% for AGIs $75k-100k, 17.6% for AGIs $100k-200k, 12.2% for AGIs over 200k)
Charity contributions: $2,167 (reported on 44.6% of returns)
Here:
$2,167
State:
$4,947
(% of AGI for various income ranges: 0.6% for AGIs below $25k, 0.7% for AGIs $25k-50k, 1.2% for AGIs $50k-75k, 1.2% for AGIs $75k-100k, 1.5% for AGIs $100k-200k, 1.2% for AGIs over 200k)
Taxes paid: $12,397 (reported on 52.4% of returns)
06480:
$12,397
State:
$17,397
(% of AGI for various income ranges: 5.7% for AGIs below $25k, 4.9% for AGIs $25k-50k, 7.5% for AGIs $50k-75k, 9.0% for AGIs $75k-100k, 9.9% for AGIs $100k-200k, 8.1% for AGIs over 200k)
Earned income credit: $1,862 (reported on 7.2% of returns)
Here:
$1,862
State:
$2,053
(% of AGI for various income ranges: 3.1% for AGIs below $25k, 0.6% for AGIs $25k-50k)
Percentage of individuals using paid preparers for their 2012 taxes: 52.8%
Here:
53%
State:
55%
(% for various income ranges: 44.3% for AGIs below $25k, 52.9% for AGIs $25k-50k, 57.3% for AGIs $50k-75k, 56.4% for AGIs $75k-100k, 55.9% for AGIs $100k-200k, 64.0% for AGIs over 200k)
Averages for the 2004 tax year for zip code 06480, filed in 2005:
Average Adjusted Gross Income (AGI) in 2004: $62,863 (Individual Income Tax Returns)
Here:
$62,863
State:
$73,265
Salary/wage: $58,515 (reported on 83.3% of returns)
Here:
$58,515
State:
$62,030
(% of AGI for various income ranges: 91.8% for AGIs below $10k, 64.3% for AGIs $10k-25k, 74.2% for AGIs $25k-50k, 76.5% for AGIs $50k-75k, 82.1% for AGIs $75k-100k, 77.9% for AGIs over 100k)
Taxable interest for individuals: $1,256 (reported on 66.9% of returns)
This zip code:
$1,256
Connecticut:
$2,287
(% of AGI for various income ranges: 6.3% for AGIs below $10k, 3.8% for AGIs $10k-25k, 1.9% for AGIs $25k-50k, 1.3% for AGIs $50k-75k, 1.0% for AGIs $75k-100k, 1.0% for AGIs over 100k)
Taxable dividends: $2,152 (reported on 38.0% of returns)
Here:
$2,152
State:
$5,735
(% of AGI for various income ranges: 5.1% for AGIs below $10k, 2.7% for AGIs $10k-25k, 1.5% for AGIs $25k-50k, 1.3% for AGIs $50k-75k, 1.0% for AGIs $75k-100k, 1.2% for AGIs over 100k)
Net capital gain/loss: +$5,973 (reported on 28.3% of returns)
Here:
+$5,973
State:
+$23,694
(% of AGI for various income ranges: -5.9% for AGIs below $10k, 0.9% for AGIs $10k-25k, 1.0% for AGIs $25k-50k, 1.0% for AGIs $50k-75k, 1.1% for AGIs $75k-100k, 4.6% for AGIs over 100k)
Profit/loss from business: +$14,770 (reported on 14.0% of returns)
Here:
+$14,770
State:
+$20,783
(% of AGI for various income ranges: 1.6% for AGIs below $10k, 4.7% for AGIs $10k-25k, 3.9% for AGIs $25k-50k, 4.7% for AGIs $50k-75k, 2.7% for AGIs $75k-100k, 2.8% for AGIs over 100k)
IRA payment deduction: $2,911 (reported on 2.7% of returns)
06480:
$2,911
Connecticut:
$3,216
(% of AGI for various income ranges: 0.2% for AGIs $10k-25k, 0.3% for AGIs $25k-50k, 0.2% for AGIs $50k-75k, 0.1% for AGIs $75k-100k, 0.1% for AGIs over 100k)
Self-employed pension: $11,325 (reported on 1.8% of returns)
Here:
$11,325
Connecticut:
$17,335
(% of AGI for various income ranges: 0.4% for AGIs $50k-75k, 0.4% for AGIs $75k-100k, 0.4% for AGIs over 100k)
Total itemized deductions: $19,539 (20% of AGI, reported on 52.1% of returns)
Here:
$19,539
State:
$24,919
Here:
20.5% of AGI
State:
18.6% of AGI
(% of AGI for various income ranges: 18.1% for AGIs below $10k, 16.3% for AGIs $10k-25k, 14.5% for AGIs $25k-50k, 18.2% for AGIs $50k-75k, 18.2% for AGIs $75k-100k, 15.1% for AGIs over 100k)
Charity contributions deductions: $1,982 (2% of AGI, reported on 48.0% of returns)
Here:
$1,982
State:
$3,762
Here:
2.0% of AGI
State:
2.7% of AGI
(% of AGI for various income ranges: 0.6% for AGIs below $10k, 0.7% for AGIs $10k-25k, 1.2% for AGIs $25k-50k, 1.5% for AGIs $50k-75k, 1.4% for AGIs $75k-100k, 1.7% for AGIs over 100k)
Total tax: $9,569 (reported on 84.3% of returns)
06480:
$9,569
State:
$15,148
(% of AGI for various income ranges: 2.7% for AGIs below $10k, 4.9% for AGIs $10k-25k, 8.1% for AGIs $25k-50k, 10.0% for AGIs $50k-75k, 10.4% for AGIs $75k-100k, 16.8% for AGIs over 100k)
Earned income credit: $1,422 (reported on 5.2% of returns)
Here:
$1,422
State:
$1,570
Percentage of individuals using paid preparers for their 2004 taxes: 55.7%
Here:
56%
State:
59%
(% for various income ranges: 42.7% for AGIs below $10k, 57.4% for AGIs $10k-25k, 56.9% for AGIs $25k-50k, 60.3% for AGIs $50k-75k, 57.1% for AGIs $75k-100k, 57.9% for AGIs over 100k)
Likely homosexual households (counted as self-reported same-sex unmarried-partner households)
Lesbian couples: 0.7% of all households
Gay men: 0.6% of all households
Household received Food Stamps/SNAP in the past 12 months: 300 Household did not receive Food Stamps/SNAP in the past 12 months: 3,321
Women who had a birth in the past 12 months: 35 (34 now married, 0 unmarried) Women who did not have a birth in the past 12 months: 2,149 (1,121 now married, 1,000 unmarried)
Housing units in zip code 06480 with a mortgage: 2,001 (144 second mortgage, 15 home equity loan, 80 both second mortgage and home equity loan) Houses without a mortgage: 126
Median monthly owner costs for units with a mortgage: $2,134 Median monthly owner costs for units without a mortgage: $968
Residents with income below the poverty level in 2022:
This zip code:
4.2%
Whole state:
9.8%
Residents with income below 50% of the poverty level in 2022:
This zip code:
2.5%
Whole state:
4.8%
Median number of rooms in houses and condos:
Here:
6.4
State:
6.5
Median number of rooms in apartments:
Here:
4.1
State:
4.0
Notable locations in this zip code not listed on our city pages
Notable locations in zip code 06480: Camp Sprague (A), Noyes School Camp (B), Eureka Mill (C), Portland Fire Department Company 3 (D), Portland Fire Department Company 1 (E), Portland Fire Department Company 2 (F), Saint Clements Castle (G), Portland Public Library (H), Emergency Resource Management (I), Portland Fire Marshal's Office (J). Display/hide their locations on the map
Churches in zip code 06480 include: First Congregational Church (A), Portland Church (B), Saint Marys Church (C), Seventh Day Adventist Church (D), Trinity Church (E), Saint Johns Church (F). Display/hide their locations on the map
Lakes, reservoirs, and swamps: Supples Pond (A), Hallocks Pond (B), Hedstroms Ponds (C), Jobs Pond (D), Kelseys Pond (E), Pecausett Pond (F), Great Hill Pond (G), Portland Reservoir (H). Display/hide their locations on the map
Streams, rivers, and creeks: Rattlesnake Brook (A), Reservoir Brook (B), Buck Brook (C), Carr Brook (D), Hales Brook (E), Stocking Brook (F). Display/hide their locations on the map
Parks in zip code 06480 include: Wangunk State Wildlife Area (1), Indian Hill Avenue Historic District (2), Reeves Lookout State Wildlife Area (3), Glastonbury Meadows State Wildlife Area (4). Display/hide their locations on the map
In group quarters: 141 (-1 institutionalized population)
Size of family households: 1,172 2-persons, 464 3-persons, 671 4-persons, 213 5-persons, 39 6-persons, 19 7-or-more-persons
Size of nonfamily households: 783 1-person, 197 2-persons, 40 3-persons
1,560 married couples with children.
394 single-parent households (137 men, 257 women).
92.2% of residents of 06480 zip code speak English at home.
2.5% of residents speak Spanish at home (100% very well).
1.9% of residents speak other Indo-European language at home (70% very well, 8% well, 21% not well).
2.8% of residents speak Asian or Pacific Island language at home (17% very well, 57% well, 27% not well).
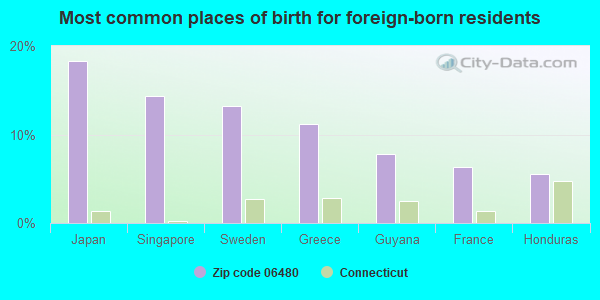
Foreign born population: 574 (6.1%) (63.8% of them are naturalized citizens)
This zip code:
6.1%
Whole state:
15.7%
18%Japan
14%Singapore
13%Sweden
11%Greece
8%Guyana
6%France
6%Honduras
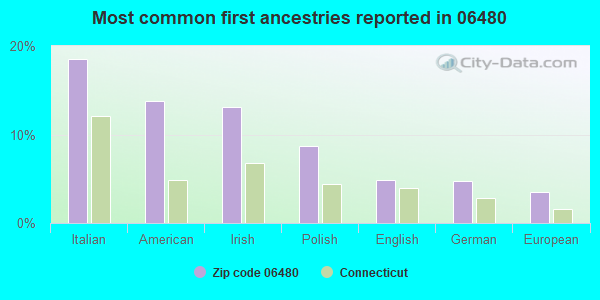
19%Italian
14%American
13%Irish
9%Polish
5%English
5%German
4%European
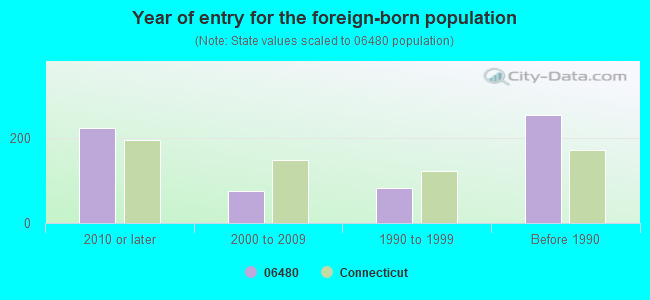
Year of entry for the foreign-born population
2232010 or later
762000 to 2009
821990 to 1999
253Before 1990
Facilities with environmental interests located in this zip code:
GILDERSLEEVE SCHOOL (575 1/2 MAIN STREET in PORTLAND, CT)
(Geographic Names Information System) (National Center for Education Statistics) - STATE ID-4 Organizations: PORTLAND SCHOOL DISTRICT (SCHOOL DISTRICT)
HOMEBOUND (264 MAIN STREET in PORTLAND, CT)
(National Center for Education Statistics) - STATE ID-88 Organizations: PORTLAND SCHOOL DISTRICT (SCHOOL DISTRICT)
CONNECTICUT DEPARTMENT OF TRANSPORTATION MACHINE SHOP (FREESTONE AVENUE in PORTLAND, CT)
(Resource Conservation and Recovery Act (tracking hazardous waste)) TARGETED BROWNFIELDS ASSESSMENT (TBA) Organizations: OWNERNAME (CONTACT/OWNER)
Alternative names: DOT PARCEL
IMAGE CLEANERS (281 MAIN ST in PORTLAND, CT)
(Resource Conservation and Recovery Act (tracking hazardous waste)) Organizations: WILLIAM BUCKIE (CONTACT/OWNER)
CHEVRON USA INC (51 BROWNSTONE AVE in PORTLAND, CT)
AIR MINOR (AIRS/AFS) Business SIC classification: ASPHALT FELTS AND COATINGS
CONTINENTAL AUTO BODY (464 PORTLAND-COBALT RD in PORTLAND, CT)
AIR MINOR (AIRS/AFS) Business SIC classification: TOP, BODY, AND UPHOLSTERY REPAIR SHOPS AND PAINT SHOPS Alternative names: CONTINENTIAL AUTO BODY INCORPORATED
AIREX RUBBER PRODUCTS CORP (100 INDIAN HILL AVE in PORTLAND, CT)
Conditionally Exempt Small Quantity Generators, less than 100 kg/month of hazardous waste (Resource Conservation and Recovery Act (tracking hazardous waste)) - notification Organizations: OWNERNAME (CONTACT/OWNER)
BROOKS PHARMACY 357 (227 MAIN ST in PORTLAND, CT)
Small Quantity Generators, between 100 kg and 1000 kg of hazardous waste/month (Resource Conservation and Recovery Act (tracking hazardous waste)) - notification Organizations: RACHEL WILTSIE (CONTACT/OWNER)
B & B OIL PETRPLEUM, INC. (22 BROWNSTONE AVE. in PORTLAND, CT)
OIL CONTROL (Facility Response Plan for oil discharge)
ELMCREST PSYCHIATRIC HOSPITAL (25 MARLBOROUGH STREET in PORTLAND, CT)
COMPLIANCE ACTIVITY (Tracking inspections of insecticide, fungicide, and rodenticide, and toxic substances)
Housing units lacking complete plumbing facilities: 0.3% Housing units lacking complete kitchen facilities: 0.6%
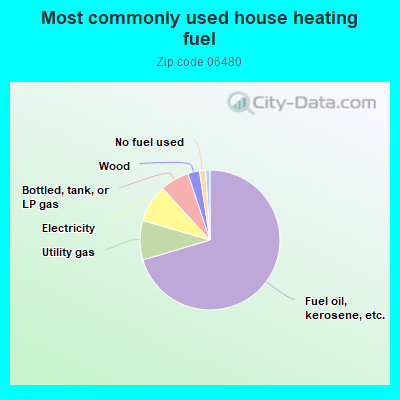
70.4%Fuel oil, kerosene, etc.
9.1%Utility gas
8.7%Electricity
6.7%Bottled, tank, or LP gas
2.7%Wood
1.4%No fuel used
0.6%Solar energy
0.5%Other fuel
Population in 1990: 8,673. Population change in the 1990s: +378 (+4.4%).
Place of birth for U.S.-born residents:
This state: 7,158
Northeast: 995
Midwest: 155
South: 237
West: 149
64% of the 06480 zip code residents lived in the same house 5 years ago. Out of people who lived in different houses, 58% lived in this county. Out of people who lived in different counties, 50% lived in Connecticut.
93% of the 06480 zip code residents lived in the same house 1 year ago. Out of people who lived in different houses, 25% moved from this county. Out of people who lived in different houses, 66% moved from different county within same state. Out of people who lived in different houses, 1% moved from abroad.
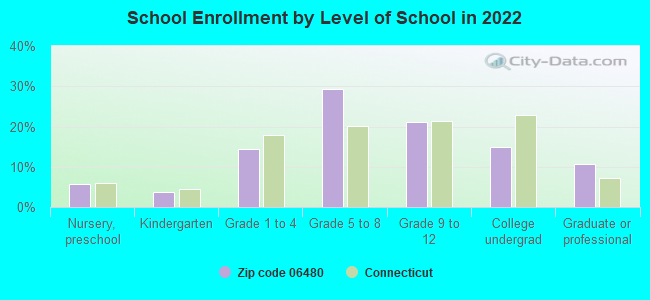
Private vs. public school enrollment:
Students in private schools in grades 1 to 8 (elementary and middle school):
Here:
0.0%
Connecticut:
9.5%
Students in private schools in grades 9 to 12 (high school): 107
Here:
20.3%
Connecticut:
12.9%
Students in private undergraduate colleges: 33
Here:
9.5%
Connecticut:
35.5%
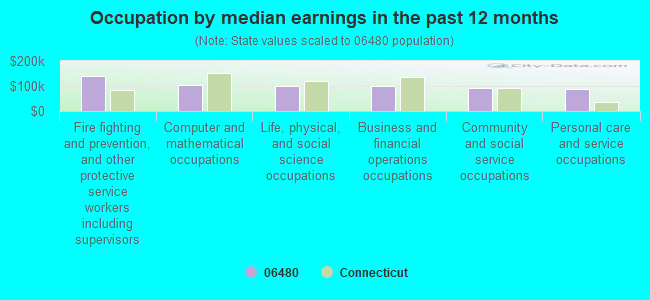
Occupation by median earnings in the past 12 months ($)
138,020Fire fighting and prevention, and other protective service workers including supervisors
103,579Computer and mathematical occupations
98,682Life, physical, and social science occupations
98,513Business and financial operations occupations
91,462Community and social service occupations
89,061Personal care and service occupations
Companies with federal contracts located in this zip code:
AIREX RUBBER PRODUCTS CORPORAT (100 INDIAN HILL AVE in PORTLAND, CT; small business) 1000 employees, $0 revenue. Woman Owned Business: $835,372 in 45 contractsfrom 2000 to 2006
Contracts for Hardware, Commercial, Production Jigs, Fixtures, and Templates, Miscellaneous Engine Accessories, Aircraft, Airframe Structural Components, and moreby Defense Logistics Agency, Navy Signed by year:2000: $146,532; 2001: $0; 2002: $110,619; 2003: $73,620; 2004: $53,819; 2005: $244,374; 2006: $206,408.
Biggest contracts:
$95,472 with Defense Logistics Agency for Hardware, Commercial. Signed on 2006-06-14. Completion date: 2006-09-10.
$73,620, same as above.Signed on 2003-12-07. Completion date: 2004-03-20.
$61,197 with Navy for Production Jigs, Fixtures, and Templates. Signed on 2000-07-31. Completion date: 2000-11-17.
$51,943 with Defense Logistics Agency for Miscellaneous Engine Accessories, Aircraft. Signed on 2000-11-08. Completion date: 2001-03-08.
JARVIS AIRFOIL INC (528 GLASTONBURY TPKE in PORTLAND, CT; small business)
$150,238 with Air Force for Structural Shapes. Signed on 2000-08-15. Completion date: 2001-06-20.
Top industries in this zip code by the number of employees in 2005:
Health Care and Social Assistance: Nursing Care Facilities (100-249 employees: 1 establishment)
Health Care and Social Assistance: Services for the Elderly and Persons with Disabilities (50-99: 1)
Health Care and Social Assistance: Home Health Care Services (50-99: 1)
Accommodation and Food Services: Caterers (50-99: 1)
People in group quarters in 2010:
69 people in group homes intended for adults
63 people in nursing facilities/skilled-nursing facilities
People in group quarters in 2000:
128 people in nursing homes
67 people in mental (psychiatric) hospitals or wards
40 people in other noninstitutional group quarters
12 people in religious group quarters
9 people in other group homes
7 people in homes for the mentally retarded
Fatal accident statistics in 2014:
Fatal accident count: 1
Vehicles involved in fatal accidents: 1
Fatal accidents caused by drunken drivers: 1
Fatalities: 1
Persons involved in fatal accidents: 1
Pedestrians involved in fatal accidents: 0
Fatal accident statistics in 2013:
Fatal accident count: 3
Vehicles involved in fatal accidents: 3
Fatal accidents caused by drunken drivers: 1
Fatalities: 6
Persons involved in fatal accidents: 8
Pedestrians involved in fatal accidents: 0
Home Mortgage Disclosure Act Aggregated Statistics For Year 2009 (Based on 2 full and 4 partial tracts)
A) FHA, FSA/RHS & VA Home Purchase Loans
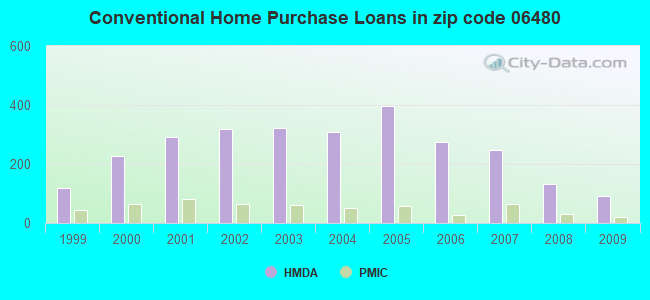
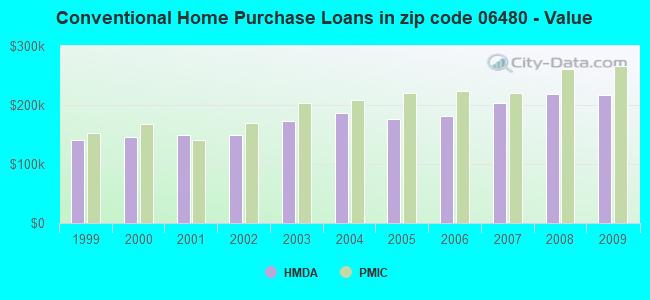
B) Conventional Home Purchase Loans
C) Refinancings
D) Home Improvement Loans
F) Non-occupant Loans on < 5 Family Dwellings (A B C & D)
Number
Average Value
Number
Average Value
Number
Average Value
Number
Average Value
Number
Average Value
LOANS ORIGINATED
64
$236,333
91
$217,612
524
$202,351
38
$76,463
14
$120,571
APPLICATIONS APPROVED, NOT ACCEPTED
4
$194,785
8
$217,204
48
$165,190
4
$169,795
0
$0
APPLICATIONS DENIED
7
$238,599
9
$200,608
144
$232,703
8
$16,448
4
$134,968
APPLICATIONS WITHDRAWN
2
$182,100
4
$133,035
83
$210,654
4
$109,025
5
$200,682
FILES CLOSED FOR INCOMPLETENESS
0
$0
2
$164,475
32
$200,524
2
$72,565
4
$120,938
Aggregated Statistics For Year 2008 (Based on 2 full and 4 partial tracts)
A) FHA, FSA/RHS & VA Home Purchase Loans
B) Conventional Home Purchase Loans
C) Refinancings
D) Home Improvement Loans
F) Non-occupant Loans on < 5 Family Dwellings (A B C & D)
G) Loans On Manufactured Home Dwelling (A B C & D)
Number
Average Value
Number
Average Value
Number
Average Value
Number
Average Value
Number
Average Value
Number
Average Value
LOANS ORIGINATED
59
$210,148
132
$218,424
242
$196,060
50
$60,084
22
$129,132
0
$0
APPLICATIONS APPROVED, NOT ACCEPTED
4
$161,485
20
$233,585
41
$198,825
13
$30,925
6
$124,485
0
$0
APPLICATIONS DENIED
9
$197,266
9
$141,150
135
$228,632
21
$76,721
4
$105,940
0
$0
APPLICATIONS WITHDRAWN
2
$187,695
18
$199,603
68
$233,301
2
$24,190
0
$0
2
$179,955
FILES CLOSED FOR INCOMPLETENESS
0
$0
4
$183,825
20
$178,587
0
$0
0
$0
0
$0
Aggregated Statistics For Year 2007 (Based on 2 full and 4 partial tracts)
A) FHA, FSA/RHS & VA Home Purchase Loans
B) Conventional Home Purchase Loans
C) Refinancings
D) Home Improvement Loans
E) Loans on Dwellings For 5+ Families
F) Non-occupant Loans on < 5 Family Dwellings (A B C & D)
G) Loans On Manufactured Home Dwelling (A B C & D)
Number
Average Value
Number
Average Value
Number
Average Value
Number
Average Value
Number
Average Value
Number
Average Value
Number
Average Value
LOANS ORIGINATED
16
$218,539
247
$204,136
319
$167,303
109
$55,392
3
$267,400
27
$222,236
4
$77,400
APPLICATIONS APPROVED, NOT ACCEPTED
0
$0
31
$238,052
53
$186,912
24
$130,264
0
$0
5
$160,440
0
$0
APPLICATIONS DENIED
4
$186,600
28
$177,096
204
$196,352
52
$64,679
0
$0
6
$154,022
2
$32,090
APPLICATIONS WITHDRAWN
4
$171,188
21
$225,041
87
$189,325
14
$108,284
0
$0
2
$36,100
0
$0
FILES CLOSED FOR INCOMPLETENESS
0
$0
5
$215,942
22
$209,308
0
$0
0
$0
2
$188,660
0
$0
Aggregated Statistics For Year 2006 (Based on 2 full and 4 partial tracts)
A) FHA, FSA/RHS & VA Home Purchase Loans
B) Conventional Home Purchase Loans
C) Refinancings
D) Home Improvement Loans
E) Loans on Dwellings For 5+ Families
F) Non-occupant Loans on < 5 Family Dwellings (A B C & D)
G) Loans On Manufactured Home Dwelling (A B C & D)
Number
Average Value
Number
Average Value
Number
Average Value
Number
Average Value
Number
Average Value
Number
Average Value
Number
Average Value
LOANS ORIGINATED
22
$206,284
275
$181,909
376
$143,278
151
$52,807
0
$0
23
$149,941
2
$57,085
APPLICATIONS APPROVED, NOT ACCEPTED
0
$0
25
$218,555
42
$182,778
19
$79,825
2
$160,440
0
$0
0
$0
APPLICATIONS DENIED
0
$0
32
$163,729
158
$184,579
56
$73,295
0
$0
2
$38,505
0
$0
APPLICATIONS WITHDRAWN
2
$127,550
24
$155,404
109
$202,318
21
$69,639
0
$0
7
$198,394
0
$0
FILES CLOSED FOR INCOMPLETENESS
0
$0
10
$222,718
33
$162,474
7
$79,797
0
$0
2
$168,345
0
$0
Aggregated Statistics For Year 2005 (Based on 2 full and 4 partial tracts)
A) FHA, FSA/RHS & VA Home Purchase Loans
B) Conventional Home Purchase Loans
C) Refinancings
D) Home Improvement Loans
F) Non-occupant Loans on < 5 Family Dwellings (A B C & D)
Number
Average Value
Number
Average Value
Number
Average Value
Number
Average Value
Number
Average Value
LOANS ORIGINATED
7
$161,303
396
$176,014
469
$163,361
151
$53,182
41
$147,527
APPLICATIONS APPROVED, NOT ACCEPTED
2
$136,375
26
$200,162
59
$152,799
14
$70,359
2
$135,450
APPLICATIONS DENIED
4
$150,195
39
$148,986
149
$210,374
30
$113,490
11
$143,101
APPLICATIONS WITHDRAWN
2
$133,965
27
$166,753
173
$183,710
11
$85,958
5
$120,694
FILES CLOSED FOR INCOMPLETENESS
2
$249,615
21
$100,852
25
$182,617
5
$56,892
0
$0
Aggregated Statistics For Year 2004 (Based on 2 full and 4 partial tracts)
A) FHA, FSA/RHS & VA Home Purchase Loans
B) Conventional Home Purchase Loans
C) Refinancings
D) Home Improvement Loans
F) Non-occupant Loans on < 5 Family Dwellings (A B C & D)
Number
Average Value
Number
Average Value
Number
Average Value
Number
Average Value
Number
Average Value
LOANS ORIGINATED
13
$176,731
307
$185,598
541
$145,702
118
$54,020
27
$121,157
APPLICATIONS APPROVED, NOT ACCEPTED
2
$145,125
26
$206,825
74
$154,933
13
$40,909
4
$129,155
APPLICATIONS DENIED
4
$169,680
29
$211,952
176
$170,866
33
$68,844
7
$183,494
APPLICATIONS WITHDRAWN
2
$133,965
38
$195,071
188
$159,728
5
$153,598
6
$171,247
FILES CLOSED FOR INCOMPLETENESS
0
$0
10
$139,901
29
$167,890
4
$201,462
2
$126,740
Aggregated Statistics For Year 2003 (Based on 2 full and 4 partial tracts)
A) FHA, FSA/RHS & VA Home Purchase Loans
B) Conventional Home Purchase Loans
C) Refinancings
D) Home Improvement Loans
E) Loans on Dwellings For 5+ Families
F) Non-occupant Loans on < 5 Family Dwellings (A B C & D)
Number
Average Value
Number
Average Value
Number
Average Value
Number
Average Value
Number
Average Value
Number
Average Value
LOANS ORIGINATED
33
$166,380
323
$173,253
1,177
$151,725
78
$40,784
2
$156,430
40
$118,273
APPLICATIONS APPROVED, NOT ACCEPTED
5
$154,172
35
$159,402
215
$144,984
18
$39,347
0
$0
2
$163,510
APPLICATIONS DENIED
0
$0
16
$179,470
194
$157,967
35
$31,650
0
$0
16
$115,301
APPLICATIONS WITHDRAWN
2
$80,220
23
$200,452
205
$141,557
9
$37,470
0
$0
10
$138,947
FILES CLOSED FOR INCOMPLETENESS
0
$0
7
$192,329
41
$131,091
9
$32,013
0
$0
2
$156,430
Aggregated Statistics For Year 2002 (Based on 2 full and 4 partial tracts)
A) FHA, FSA/RHS & VA Home Purchase Loans
B) Conventional Home Purchase Loans
C) Refinancings
D) Home Improvement Loans
E) Loans on Dwellings For 5+ Families
F) Non-occupant Loans on < 5 Family Dwellings (A B C & D)
Number
Average Value
Number
Average Value
Number
Average Value
Number
Average Value
Number
Average Value
Number
Average Value
LOANS ORIGINATED
28
$141,339
318
$149,203
733
$141,838
92
$34,893
4
$1,288,792
20
$108,554
APPLICATIONS APPROVED, NOT ACCEPTED
5
$165,412
30
$126,653
71
$140,335
29
$25,040
0
$0
5
$112,868
APPLICATIONS DENIED
0
$0
17
$134,339
149
$119,553
28
$34,691
0
$0
9
$109,837
APPLICATIONS WITHDRAWN
3
$132,097
18
$111,023
128
$133,192
7
$22,747
0
$0
2
$66,760
FILES CLOSED FOR INCOMPLETENESS
0
$0
13
$143,418
27
$126,533
0
$0
0
$0
0
$0
Aggregated Statistics For Year 2001 (Based on 2 full and 4 partial tracts)
A) FHA, FSA/RHS & VA Home Purchase Loans
B) Conventional Home Purchase Loans
C) Refinancings
D) Home Improvement Loans
E) Loans on Dwellings For 5+ Families
F) Non-occupant Loans on < 5 Family Dwellings (A B C & D)
Number
Average Value
Number
Average Value
Number
Average Value
Number
Average Value
Number
Average Value
Number
Average Value
LOANS ORIGINATED
45
$139,130
293
$149,314
521
$129,039
88
$29,637
3
$261,517
32
$92,421
APPLICATIONS APPROVED, NOT ACCEPTED
0
$0
27
$142,092
77
$93,157
19
$41,385
0
$0
0
$0
APPLICATIONS DENIED
4
$134,000
24
$112,330
132
$101,965
35
$28,615
0
$0
7
$41,644
APPLICATIONS WITHDRAWN
4
$145,610
11
$115,057
99
$118,248
17
$33,666
0
$0
2
$62,885
FILES CLOSED FOR INCOMPLETENESS
4
$130,192
0
$0
15
$143,190
4
$17,035
0
$0
2
$145,125
Aggregated Statistics For Year 2000 (Based on 2 full and 4 partial tracts)
A) FHA, FSA/RHS & VA Home Purchase Loans
B) Conventional Home Purchase Loans
C) Refinancings
D) Home Improvement Loans
F) Non-occupant Loans on < 5 Family Dwellings (A B C & D)
Number
Average Value
Number
Average Value
Number
Average Value
Number
Average Value
Number
Average Value
LOANS ORIGINATED
46
$129,366
228
$145,503
137
$103,079
61
$30,797
16
$89,952
APPLICATIONS APPROVED, NOT ACCEPTED
2
$139,320
10
$181,503
34
$94,388
12
$19,247
0
$0
APPLICATIONS DENIED
2
$87,075
30
$109,405
83
$104,616
43
$24,714
0
$0
APPLICATIONS WITHDRAWN
0
$0
14
$193,471
44
$95,803
7
$106,506
2
$87,075
FILES CLOSED FOR INCOMPLETENESS
0
$0
4
$156,020
9
$138,853
0
$0
0
$0
Aggregated Statistics For Year 1999 (Based on 1 full and 2 partial tracts)
A) FHA, FSA/RHS & VA Home Purchase Loans
B) Conventional Home Purchase Loans
C) Refinancings
D) Home Improvement Loans
F) Non-occupant Loans on < 5 Family Dwellings (A B C & D)
Detailed PMIC statistics for the following Tracts:5601.00
, 5602.00
2002 - 2018 National Fire Incident Reporting System (NFIRS) incidents
According to the data from the years 2002 - 2018 the average number of fires per year is 38. The highest number of reported fires - 64 took place in 2004, and the least - 6 in 2003. The data has an increasing trend.
When looking into fire subcategories, the most incidents belonged to: Structure Fires (46.2%), and Outside Fires (36.0%).
Fire incident types reported to NFIRS in Zip Code 06480


 Nearest zip codes: 06414, 06073, 06416, 06457, 06456, 06067.


 According to the data from the years 2002 - 2018 the average number of fires per year is 38. The highest number of reported fires - 64 took place in 2004, and the least - 6 in 2003. The data has an increasing trend.
 When looking into fire subcategories, the most incidents belonged to: Structure Fires (46.2%), and Outside Fires (36.0%).