Estimated zip code population in 2022: 16,835 Zip code population in 2010: 16,540 Zip code population in 2000: 15,452
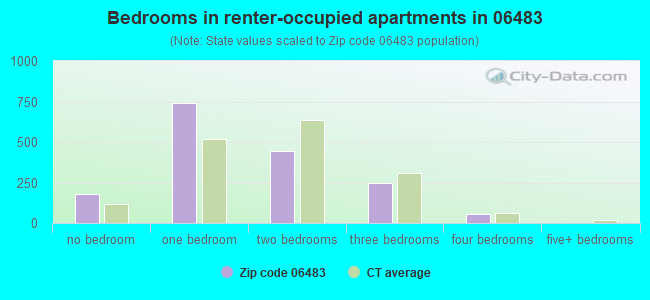
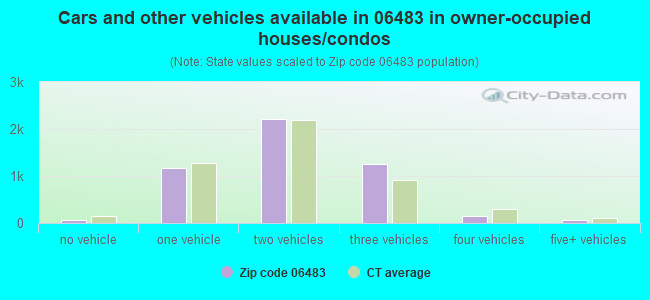
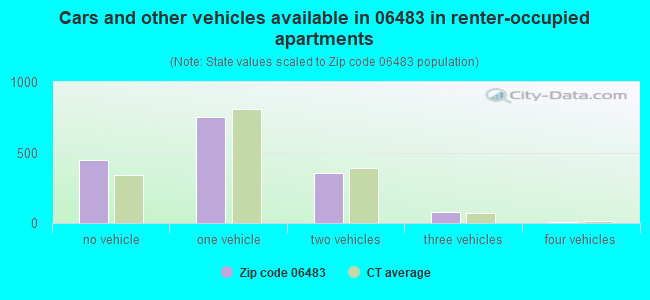
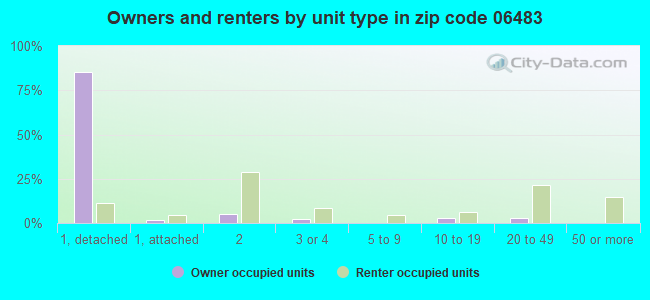
Houses and condos: 6,662 Renter-occupied apartments: 1,630
% of renters here:
25%
State:
34%
March 2022 cost of living index in zip code 06483: 126.5 (high, U.S. average is 100)
Land area: 14.5 sq. mi. Water area: 0.5 sq. mi.
Population density: 1,160 people per square mile
(low).
OSM Map
Google Map
MSN Map
OSM Map
General Map
Google Map
MSN Map
OSM Map
Google Map
MSN Map
OSM Map
Google Map
MSN Map
Please wait while loading the map...
Real estate property taxes paid for housing units in 2022:
This zip code:
1.8% ($6,182)
Connecticut:
1.8% ($6,189)
Median real estate property taxes paid for housing units with mortgages in 2022: $6,276 (1.8%) Median real estate property taxes paid for housing units with no mortgage in 2022: $5,983 (1.9%)
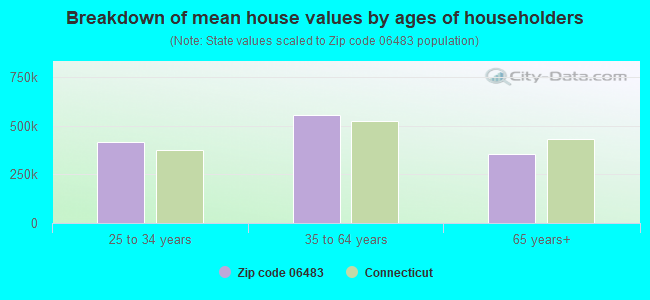
Estimated median house/condo value in 2022: $339,048
06483:
$339,048
Connecticut:
$347,200
According to our research of Connecticut and other state lists, there were 11 registered sex offenders living in 06483 zip code as of April 27, 2024. The ratio of all residents to sex offenders in zip code 06483 is 1,525 to 1. The ratio of registered sex offenders to all residents in this zip code is lower than the state average.
Median resident age:
This zip code:
39.3 years
Connecticut median age:
40.9 years
Average household size:
This zip code:
2.5 people
Connecticut:
2.5 people
Averages for the 2020 tax year for zip code 06483, filed in 2021:
Average Adjusted Gross Income (AGI) in 2020: $72,576 (Individual Income Tax Returns)
Here:
$72,576
State:
$105,931
Salary/wage: $67,248 (reported on 83.8% of returns)
Here:
$67,248
State:
$83,540
(% of AGI for various income ranges: 1062.7% for AGIs below $25k, 3530.3% for AGIs $25k-50k, 6318.5% for AGIs $50k-75k, 9554.4% for AGIs $75k-100k, 17728.5% for AGIs $100k-200k, 57985.6% for AGIs over 200k)
Taxable interest for individuals: $1,077 (reported on 32.6% of returns)
This zip code:
$1,077
Connecticut:
$3,402
(% of AGI for various income ranges: 17.5% for AGIs below $25k, 15.4% for AGIs $25k-50k, 25.5% for AGIs $50k-75k, 44.4% for AGIs $75k-100k, 64.8% for AGIs $100k-200k, 791.2% for AGIs over 200k)
Ordinary dividends: $3,329 (reported on 21.2% of returns)
Here:
$3,329
State:
$12,683
(% of AGI for various income ranges: 26.1% for AGIs below $25k, 23.3% for AGIs $25k-50k, 37.2% for AGIs $50k-75k, 85.6% for AGIs $75k-100k, 158.1% for AGIs $100k-200k, 1666.3% for AGIs over 200k)
Net capital gain/loss in AGI: +$7,322 (reported on 17.3% of returns)
Here:
+$7,322
State:
+$44,158
(% of AGI for various income ranges: 8.5% for AGIs below $25k, 14.0% for AGIs $25k-50k, 65.4% for AGIs $50k-75k, 112.9% for AGIs $75k-100k, 278.5% for AGIs $100k-200k, 3849.4% for AGIs over 200k)
Profit/loss from business: +$16,016 (reported on 14.0% of returns)
Here:
+$16,016
State:
+$22,988
(% of AGI for various income ranges: 118.0% for AGIs below $25k, 189.8% for AGIs $25k-50k, 181.3% for AGIs $50k-75k, 368.4% for AGIs $75k-100k, 425.5% for AGIs $100k-200k, 3526.9% for AGIs over 200k)
Taxable individual retirement arrangement distribution: $14,170 (reported on 9.5% of returns)
06483:
$14,170
Connecticut:
$22,031
(% of AGI for various income ranges: 94.5% for AGIs below $25k, 111.5% for AGIs $25k-50k, 157.0% for AGIs $50k-75k, 308.5% for AGIs $75k-100k, 364.1% for AGIs $100k-200k, 478.1% for AGIs over 200k)
Self-employed (Keogh) retirement plans: $14,260 (reported on 0.6% of returns)
06483:
$14,260
Connecticut:
$29,016
(% of AGI for various income ranges: 64.8% for AGIs $100k-200k)
Total itemized deductions: $24,439 (reported on 10.3% of returns)
Here:
$24,439
State:
$37,613
(% of AGI for various income ranges: 63.4% for AGIs below $25k, 99.4% for AGIs $25k-50k, 335.1% for AGIs $50k-75k, 572.2% for AGIs $75k-100k, 811.5% for AGIs $100k-200k, 1872.5% for AGIs over 200k)
Charity contributions: $3,954 (reported on 8.0% of returns)
Here:
$3,954
State:
$13,557
(% of AGI for various income ranges: 2.8% for AGIs below $25k, 6.0% for AGIs $25k-50k, 26.6% for AGIs $50k-75k, 66.9% for AGIs $75k-100k, 121.1% for AGIs $100k-200k, 346.2% for AGIs over 200k)
Taxes paid: $8,946 (reported on 10.3% of returns)
06483:
$8,946
State:
$9,096
(% of AGI for various income ranges: 17.3% for AGIs below $25k, 33.9% for AGIs $25k-50k, 138.7% for AGIs $50k-75k, 239.4% for AGIs $75k-100k, 287.2% for AGIs $100k-200k, 596.2% for AGIs over 200k)
Earned income credit: $1,906 (reported on 9.4% of returns)
Here:
$1,906
State:
$2,059
(% of AGI for various income ranges: 58.6% for AGIs below $25k, 42.6% for AGIs $25k-50k)
Percentage of individuals using paid preparers for their 2020 taxes: 92.9%
Here:
93%
State:
93%
(% for various income ranges: 90.6% for AGIs below $25k, 93.3% for AGIs $25k-50k, 95.1% for AGIs $50k-75k, 93.8% for AGIs $75k-100k, 93.1% for AGIs $100k-200k, 93.0% for AGIs over 200k)
Averages for the 2012 tax year for zip code 06483, filed in 2013:
Average Adjusted Gross Income (AGI) in 2012: $62,028 (Individual Income Tax Returns)
Here:
$62,028
State:
$93,290
Salary/wage: $59,356 (reported on 85.9% of returns)
Here:
$59,356
State:
$73,117
(% of AGI for various income ranges: 69.8% for AGIs below $25k, 79.9% for AGIs $25k-50k, 81.0% for AGIs $50k-75k, 82.1% for AGIs $75k-100k, 86.3% for AGIs $100k-200k, 79.6% for AGIs over 200k)
Taxable interest for individuals: $816 (reported on 50.4% of returns)
This zip code:
$816
Connecticut:
$2,530
(% of AGI for various income ranges: 1.3% for AGIs below $25k, 1.5% for AGIs $25k-50k, 0.5% for AGIs $50k-75k, 0.5% for AGIs $75k-100k, 0.4% for AGIs $100k-200k, 0.7% for AGIs over 200k)
Ordinary dividends: $2,148 (reported on 24.3% of returns)
Here:
$2,148
State:
$10,909
(% of AGI for various income ranges: 1.5% for AGIs below $25k, 0.7% for AGIs $25k-50k, 0.6% for AGIs $50k-75k, 0.6% for AGIs $75k-100k, 0.7% for AGIs $100k-200k, 1.7% for AGIs over 200k)
Net capital gain/loss in AGI: +$1,878 (reported on 15.5% of returns)
Here:
+$1,878
State:
+$34,090
(% of AGI for various income ranges: 0.2% for AGIs $25k-50k, 0.1% for AGIs $75k-100k, 0.4% for AGIs $100k-200k, 2.1% for AGIs over 200k)
Profit/loss from business: +$13,895 (reported on 12.8% of returns)
Here:
+$13,895
State:
+$22,741
(% of AGI for various income ranges: 6.1% for AGIs below $25k, 3.5% for AGIs $25k-50k, 3.0% for AGIs $50k-75k, 1.7% for AGIs $75k-100k, 2.2% for AGIs $100k-200k, 4.0% for AGIs over 200k)
Taxable individual retirement arrangement distribution: $12,853 (reported on 10.6% of returns)
06483:
$12,853
Connecticut:
$19,976
(% of AGI for various income ranges: 4.6% for AGIs below $25k, 2.8% for AGIs $25k-50k, 1.9% for AGIs $50k-75k, 2.4% for AGIs $75k-100k, 1.9% for AGIs $100k-200k, 1.4% for AGIs over 200k)
Self-employment retirement plans: $10,080 (reported on 0.6% of returns)
06483:
$10,080
Connecticut:
$24,004
Total itemized deductions: $22,371 (23% of AGI, reported on 46.1% of returns)
Here:
$22,371
State:
$33,239
Here:
22.6% of AGI
State:
18.9% of AGI
(% of AGI for various income ranges: 12.8% for AGIs below $25k, 13.5% for AGIs $25k-50k, 16.2% for AGIs $50k-75k, 18.6% for AGIs $75k-100k, 18.2% for AGIs $100k-200k, 14.7% for AGIs over 200k)
Charity contributions: $1,924 (reported on 37.7% of returns)
Here:
$1,924
State:
$4,947
(% of AGI for various income ranges: 0.6% for AGIs below $25k, 0.6% for AGIs $25k-50k, 1.2% for AGIs $50k-75k, 1.2% for AGIs $75k-100k, 1.3% for AGIs $100k-200k, 1.6% for AGIs over 200k)
Taxes paid: $11,108 (reported on 45.9% of returns)
06483:
$11,108
State:
$17,397
(% of AGI for various income ranges: 4.2% for AGIs below $25k, 4.8% for AGIs $25k-50k, 7.3% for AGIs $50k-75k, 9.1% for AGIs $75k-100k, 9.8% for AGIs $100k-200k, 9.1% for AGIs over 200k)
Earned income credit: $1,841 (reported on 9.4% of returns)
Here:
$1,841
State:
$2,053
(% of AGI for various income ranges: 3.4% for AGIs below $25k, 0.6% for AGIs $25k-50k)
Percentage of individuals using paid preparers for their 2012 taxes: 52.6%
Here:
53%
State:
55%
(% for various income ranges: 45.9% for AGIs below $25k, 48.3% for AGIs $25k-50k, 57.3% for AGIs $50k-75k, 60.2% for AGIs $75k-100k, 58.6% for AGIs $100k-200k, 66.7% for AGIs over 200k)
Averages for the 2004 tax year for zip code 06483, filed in 2005:
Average Adjusted Gross Income (AGI) in 2004: $50,632 (Individual Income Tax Returns)
Here:
$50,632
State:
$73,265
Salary/wage: $49,721 (reported on 85.1% of returns)
Here:
$49,721
State:
$62,030
(% of AGI for various income ranges: 114.9% for AGIs below $10k, 66.5% for AGIs $10k-25k, 83.9% for AGIs $25k-50k, 84.6% for AGIs $50k-75k, 87.8% for AGIs $75k-100k, 82.5% for AGIs over 100k)
Taxable interest for individuals: $811 (reported on 62.7% of returns)
This zip code:
$811
Connecticut:
$2,287
(% of AGI for various income ranges: 7.4% for AGIs below $10k, 2.8% for AGIs $10k-25k, 1.1% for AGIs $25k-50k, 0.8% for AGIs $50k-75k, 0.8% for AGIs $75k-100k, 0.7% for AGIs over 100k)
Taxable dividends: $1,583 (reported on 29.5% of returns)
Here:
$1,583
State:
$5,735
(% of AGI for various income ranges: 4.1% for AGIs below $10k, 1.7% for AGIs $10k-25k, 0.7% for AGIs $25k-50k, 0.5% for AGIs $50k-75k, 0.5% for AGIs $75k-100k, 1.3% for AGIs over 100k)
Net capital gain/loss: +$6,272 (reported on 20.3% of returns)
Here:
+$6,272
State:
+$23,694
(% of AGI for various income ranges: -3.1% for AGIs below $10k, 0.0% for AGIs $10k-25k, 0.1% for AGIs $25k-50k, 0.9% for AGIs $50k-75k, 1.5% for AGIs $75k-100k, 6.0% for AGIs over 100k)
Profit/loss from business: +$14,483 (reported on 12.5% of returns)
Here:
+$14,483
State:
+$20,783
(% of AGI for various income ranges: 8.7% for AGIs below $10k, 6.1% for AGIs $10k-25k, 3.7% for AGIs $25k-50k, 3.1% for AGIs $50k-75k, 3.0% for AGIs $75k-100k, 3.5% for AGIs over 100k)
IRA payment deduction: $2,922 (reported on 3.4% of returns)
06483:
$2,922
Connecticut:
$3,216
(% of AGI for various income ranges: 0.3% for AGIs $10k-25k, 0.3% for AGIs $25k-50k, 0.2% for AGIs $50k-75k, 0.2% for AGIs $75k-100k, 0.1% for AGIs over 100k)
Self-employed pension: $9,052 (reported on 1.0% of returns)
Here:
$9,052
Connecticut:
$17,335
(% of AGI for various income ranges: 0.1% for AGIs $25k-50k, 0.1% for AGIs $50k-75k, 0.2% for AGIs $75k-100k, 0.3% for AGIs over 100k)
Total itemized deductions: $18,633 (23% of AGI, reported on 44.6% of returns)
Here:
$18,633
State:
$24,919
Here:
23.0% of AGI
State:
18.6% of AGI
(% of AGI for various income ranges: 18.6% for AGIs below $10k, 12.4% for AGIs $10k-25k, 13.0% for AGIs $25k-50k, 17.9% for AGIs $50k-75k, 18.5% for AGIs $75k-100k, 16.8% for AGIs over 100k)
Charity contributions deductions: $1,651 (2% of AGI, reported on 41.1% of returns)
Here:
$1,651
State:
$3,762
Here:
2.0% of AGI
State:
2.7% of AGI
(% of AGI for various income ranges: 0.7% for AGIs below $10k, 0.8% for AGIs $10k-25k, 1.0% for AGIs $25k-50k, 1.2% for AGIs $50k-75k, 1.5% for AGIs $75k-100k, 1.6% for AGIs over 100k)
Total tax: $6,682 (reported on 82.9% of returns)
06483:
$6,682
State:
$15,148
(% of AGI for various income ranges: 4.7% for AGIs below $10k, 4.8% for AGIs $10k-25k, 8.2% for AGIs $25k-50k, 9.6% for AGIs $50k-75k, 10.0% for AGIs $75k-100k, 15.1% for AGIs over 100k)
Earned income credit: $1,475 (reported on 6.5% of returns)
Here:
$1,475
State:
$1,570
Percentage of individuals using paid preparers for their 2004 taxes: 56.4%
Here:
56%
State:
59%
(% for various income ranges: 46.1% for AGIs below $10k, 56.6% for AGIs $10k-25k, 57.7% for AGIs $25k-50k, 60.1% for AGIs $50k-75k, 58.9% for AGIs $75k-100k, 59.4% for AGIs over 100k)
Likely homosexual households (counted as self-reported same-sex unmarried-partner households)
Lesbian couples: 0.3% of all households
Gay men: 0.0% of all households
Household received Food Stamps/SNAP in the past 12 months: 683 Household did not receive Food Stamps/SNAP in the past 12 months: 5,885
Women who had a birth in the past 12 months: 129 (125 now married, 0 unmarried) Women who did not have a birth in the past 12 months: 4,093 (1,486 now married, 2,608 unmarried)
Housing units in zip code 06483 with a mortgage: 3,501 (490 second mortgage, 15 home equity loan, 476 both second mortgage and home equity loan) Houses without a mortgage: 147
Median monthly owner costs for units with a mortgage: $2,264 Median monthly owner costs for units without a mortgage: $1,002
Residents with income below the poverty level in 2022:
This zip code:
6.1%
Whole state:
9.8%
Residents with income below 50% of the poverty level in 2022:
This zip code:
3.2%
Whole state:
4.8%
Median number of rooms in houses and condos:
Here:
6.4
State:
6.5
Median number of rooms in apartments:
Here:
3.5
State:
4.0
Notable locations in this zip code not listed on our city pages
Notable locations in zip code 06483: Great Hills Country Club (A), Silver Mine Industrial Park (B), Seymour Public Library (C), Seymour Volunteer Ambulance Association (D), Great Hill Hose Company (E), Citizens Volunteer Hose Company 2 (F). Display/hide their locations on the map
Shopping Centers: Tri-Town Plaza Shopping Center (1), Oxmour Plaza Shopping Center (2), Westwood Plaza Shopping Center (3). Display/hide their locations on the map
Churches in zip code 06483 include: Saint Augustines Church (A), Seymour United Methodist Church (B), Trinity Episcopal Church (C), Church of the Good Shepherd (D), Evangelical Baptist Church (E). Display/hide their locations on the map
Lakes and reservoirs: Spring Lake (A), Hoadley Pond (B), Peat Swamp Reservoir (C), Naugatuck River Reservoir (D), Silver Lake (E), Great Hill Reservoir (F), Fountain Lake Reservoir (G), Bladens River Reservoir (H). Display/hide their locations on the map
Streams, rivers, and creeks: Little River (A), Nickel Mine Brook (B), Wooster Brook (C), Rimmon Brook (D), Spruce Brook (E), Steel Brook (F), Bladens River (G), Fourmile Brook (H), Globe Mill Brook (I). Display/hide their locations on the map
In group quarters: 177 (-1 institutionalized population)
Size of family households: 1,824 2-persons, 1,081 3-persons, 793 4-persons, 512 5-persons, 40 6-persons, 22 7-or-more-persons
Size of nonfamily households: 1,761 1-person, 520 2-persons
2,316 married couples with children.
1,018 single-parent households (208 men, 810 women).
84.8% of residents of 06483 zip code speak English at home.
8.0% of residents speak Spanish at home (56% very well, 34% not well, 10% not at all).
5.3% of residents speak other Indo-European language at home (45% very well, 37% well, 15% not well, 3% not at all).
1.0% of residents speak Asian or Pacific Island language at home (100% very well).
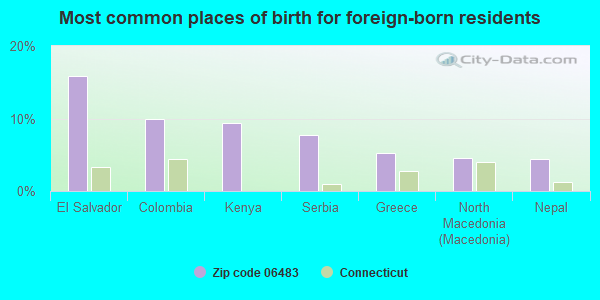
Foreign born population: 1,642 (9.8%) (66.9% of them are naturalized citizens)
This zip code:
9.8%
Whole state:
15.7%
16%El Salvador
10%Colombia
9%Kenya
8%Serbia
5%Greece
5%North Macedonia (Macedonia)
4%Nepal
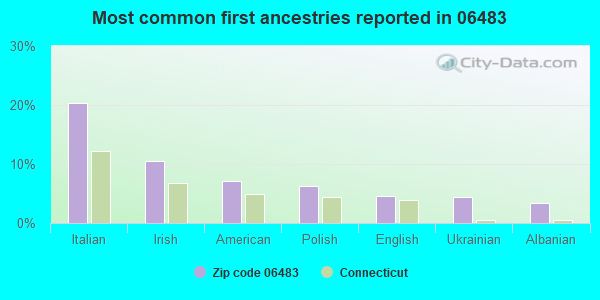
20%Italian
11%Irish
7%American
6%Polish
5%English
4%Ukrainian
3%Albanian
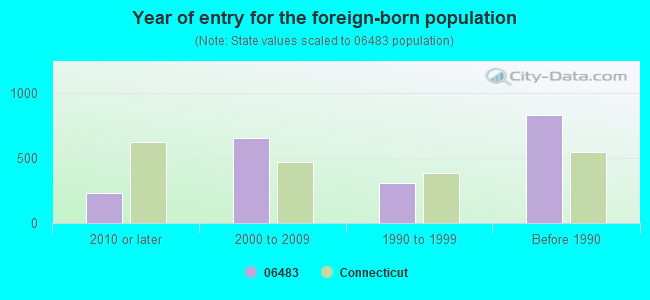
Year of entry for the foreign-born population
2302010 or later
6512000 to 2009
3071990 to 1999
828Before 1990
Major facilities with environmental interests located in this zip code:
ELECTRIC CABLE COMPOUNDS (15 FRANKLIN ST in SEYMOUR, CT)
AIR MINOR (AIRS/AFS) ENFORCEMENT/COMPLIANCE ACTIVITY (Integrated Compliance Information System) - ICIS-01-2003-9160, FORMAL ENFORCEMENT ACTION (Integrated Compliance Information System) - ICIS-01-2003-9160, FORMAL ENFORCEMENT ACTION COMPLIANCE ACTIVITY (Tracking inspections of insecticide, fungicide, and rodenticide, and toxic substances) CRITERIA AND HAZARDOUS AIR POLLUTANT INVENTORY (Inventory of air pollution sources) TRI REPORTER (Tracking of toxic chemicals releasing facilities) Business SIC classification: PLASTICS MATERIALS, SYNTHETIC RESINS, AND NONVULCANIZABLE ELASTOMERS; SYNTHETIC RUBBER (VULCANIZABLE ELASTOMERS); ROLLING, DRAWING, AND EXTRUDING OF COPPER Alternative names: ELECTRIC CABLE COMPANY
ANNA L. LOPRESTI SCHOOL (29 MAPLE STREET in SEYMOUR, CT)
(Geographic Names Information System) (National Center for Education Statistics) - STATE ID-3 Organizations: SEYMOUR SCHOOL DISTRICT (SCHOOL DISTRICT)
BUNGAY SCHOOL (35 BUNGAY ROAD in SEYMOUR, CT)
COMPLIANCE ACTIVITY (Tracking inspections of insecticide, fungicide, and rodenticide, and toxic substances) (National Center for Education Statistics) - STATE ID-1 Organizations: SEYMOUR SCHOOL DISTRICT (SCHOOL DISTRICT)
HOMEBOUND (98 BANK STREET, ANNEX BUILDING in SEYMOUR, CT)
(National Center for Education Statistics) - STATE ID-88 Organizations: SEYMOUR SCHOOL DISTRICT (SCHOOL DISTRICT)
BALKOS SERVICE STATION (156 S MAIN ST in SEYMOUR, CT)
(Resource Conservation and Recovery Act (tracking hazardous waste))
COBBLESTONE PRINTERY (181 PEARL ST in SEYMOUR, CT)
HOUSATONIC WIRE CO, INC (109 RIVER ST in SEYMOUR, CT)
AIR MINOR (AIRS/AFS) COMPLIANCE ACTIVITY (Tracking inspections of insecticide, fungicide, and rodenticide, and toxic substances) Business SIC classification: STEEL WIREDRAWING AND STEEL NAILS AND SPIKES
PATS AUTO BODY (634 S MAIN ST in SEYMOUR, CT)
(Resource Conservation and Recovery Act (tracking hazardous waste))
ZIBLUK MACHINE CO INC (255 BANK ST in SEYMOUR, CT)
DERBY AVE AUTO SALES & SERVICE (688 DERBY AVE in SEYMOUR, CT)
AIR MINOR (AIRS/AFS) Business SIC classification: TOP, BODY, AND UPHOLSTERY REPAIR SHOPS AND PAINT SHOPS
HATHAWAY CO THE (93 SILVERMINE ROAD in SEYMOUR, CT)
HAZARDOUS WASTE BIENNIAL REPORTER (Resource Conservation and Recovery Act (tracking hazardous waste)) Small Quantity Generators, between 100 kg and 1000 kg of hazardous waste/month (Resource Conservation and Recovery Act (tracking hazardous waste)) Business NAICS classification: ELECTROPLATING, PLATING, POLISHING, ANODIZING, AND COLORING.; ALL OTHER INDUSTRIAL MACHINERY MANUFACTURING.; MACHINE TOOL (METAL CUTTING TYPES) MANUFACTURING.
HAYNES CONSTRUCTION COMPANY (LOT 44 DERBY SITE in SEYMOUR, CT)
AIR MINOR (AIRS/AFS) Business SIC classification: READY-MIXED CONCRETE
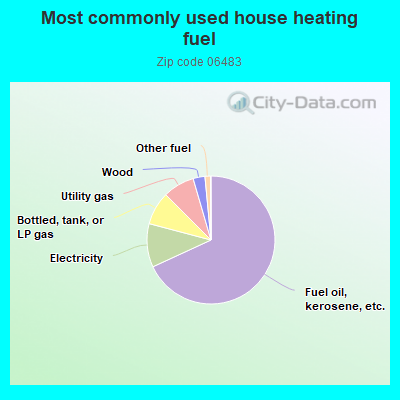
68.2%Fuel oil, kerosene, etc.
11.0%Electricity
8.4%Bottled, tank, or LP gas
8.0%Utility gas
3.0%Wood
1.4%Other fuel
Population in 1990: 13,660. Population change in the 1990s: +1,792 (+13.1%).
Place of birth for U.S.-born residents:
This state: 10,947
Northeast: 2,650
Midwest: 167
South: 715
West: 124
65% of the 06483 zip code residents lived in the same house 5 years ago. Out of people who lived in different houses, 66% lived in this county. Out of people who lived in different counties, 50% lived in Connecticut.
90% of the 06483 zip code residents lived in the same house 1 year ago. Out of people who lived in different houses, 23% moved from this county. Out of people who lived in different houses, 31% moved from different county within same state. Out of people who lived in different houses, 45% moved from different state. Out of people who lived in different houses, 8% moved from abroad.
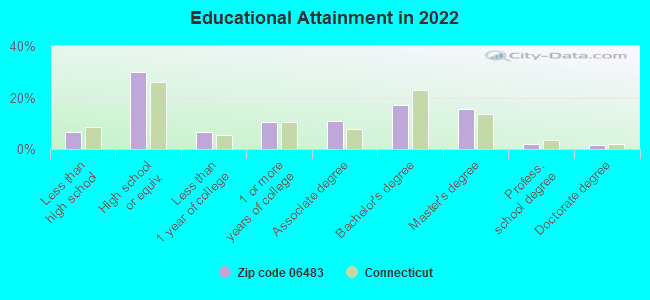
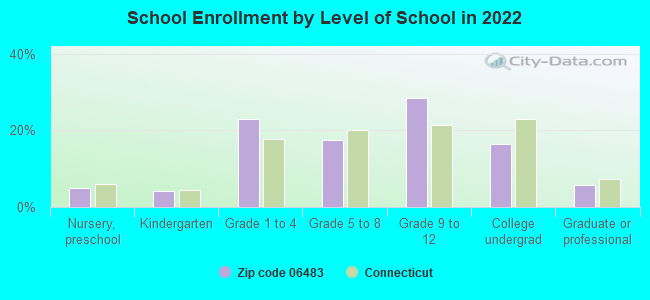
Private vs. public school enrollment:
Students in private schools in grades 1 to 8 (elementary and middle school): 98
Here:
6.7%
Connecticut:
9.5%
Students in private schools in grades 9 to 12 (high school): 172
Here:
16.4%
Connecticut:
12.9%
Students in private undergraduate colleges: 260
Here:
42.8%
Connecticut:
35.5%
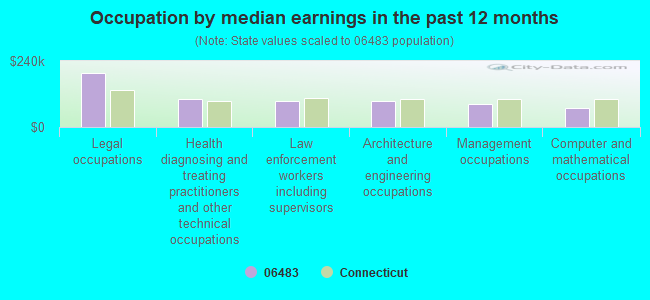
Occupation by median earnings in the past 12 months ($)
198,037Legal occupations
101,106Health diagnosing and treating practitioners and other technical occupations
93,801Law enforcement workers including supervisors
93,725Architecture and engineering occupations
83,215Management occupations
70,894Computer and mathematical occupations
Companies with federal contracts located in this zip code:
AIR-VAC ENGINEERING COMPANY, I (30 PROGRESS LN in SEYMOUR, CT; small business) : $121,065 in 2 contractsfrom 2001 to 2005
$60,675 with Army for Miscellaneous Welding, Soldering, and Brazing Supplies and Accessories. Signed on 2001-10-26. Completion date: 2001-11-30.
$60,390 with Air Force for Electrical and Electronic Properties Measuring and Testing Instruments. Signed on 2005-07-20. Completion date: 2005-08-03.
EMERY, A H COMPANY, THE (73 COGWHEEL LANE in SEYMOUR, CT; small business) : $24,350 in 2 contractsfrom 2003 to 2004
$24,000 with Navy for Scales and Balances. Taking place in CA. Signed on 2003-08-25. Completion date: 2003-11-14.
$350 with Navy for Scales and Balances. Taking place in IN. Signed on 2004-06-09. Completion date: 2003-11-14.
ALLY INDUSTRIES, INC (30A PROGRESS LN in SEYMOUR, CT; small business)
$4,360 with Navy for Safety and Rescue Equipment. Signed on 2004-09-22. Completion date: 2004-11-01.
Top industries in this zip code by the number of employees in 2005:
Administrative and Support and Waste Management and Remediation Services: Temporary Help Services (250-499 employees: 1 establishment)
Information: Cable and Other Program Distribution (100-249: 1)
People in group quarters in 2010:
128 people in nursing facilities/skilled-nursing facilities
15 people in group homes intended for adults
People in group quarters in 2000:
126 people in nursing homes
6 people in other noninstitutional group quarters
Fatal accident statistics in 2014:
Fatal accident count: 1
Vehicles involved in fatal accidents: 1
Fatal accidents caused by drunken drivers: 0
Fatalities: 1
Persons involved in fatal accidents: 1
Pedestrians involved in fatal accidents: 0
Fatal accident statistics in 2013:
Fatal accident count: 1
Vehicles involved in fatal accidents: 1
Fatal accidents caused by drunken drivers: 1
Fatalities: 1
Persons involved in fatal accidents: 1
Pedestrians involved in fatal accidents: 0
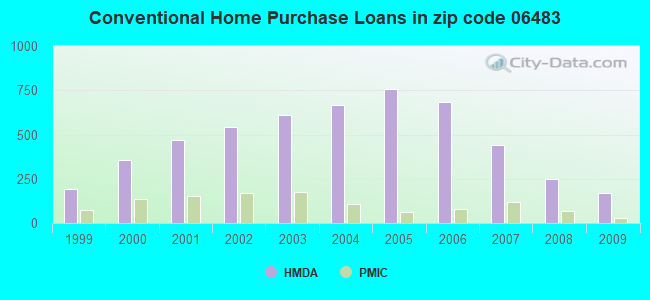
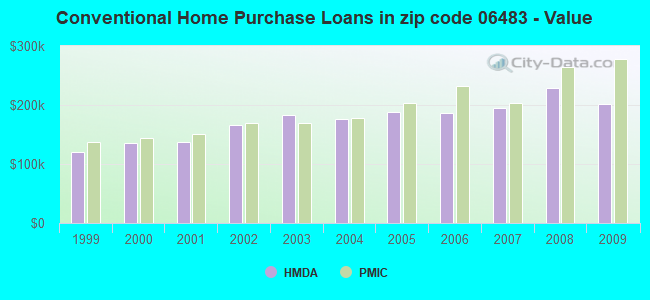
Home Mortgage Disclosure Act Aggregated Statistics For Year 2009 (Based on 4 full tracts)
A) FHA, FSA/RHS & VA Home Purchase Loans
B) Conventional Home Purchase Loans
C) Refinancings
D) Home Improvement Loans
E) Loans on Dwellings For 5+ Families
F) Non-occupant Loans on < 5 Family Dwellings (A B C & D)
Number
Average Value
Number
Average Value
Number
Average Value
Number
Average Value
Number
Average Value
Number
Average Value
LOANS ORIGINATED
153
$224,210
169
$201,664
670
$204,082
51
$103,132
4
$901,788
10
$113,420
APPLICATIONS APPROVED, NOT ACCEPTED
20
$218,524
18
$226,015
71
$203,091
4
$51,235
0
$0
4
$135,630
APPLICATIONS DENIED
31
$219,846
35
$191,885
208
$227,522
45
$58,889
0
$0
14
$130,723
APPLICATIONS WITHDRAWN
22
$182,902
18
$161,751
155
$221,426
2
$264,470
0
$0
4
$168,342
FILES CLOSED FOR INCOMPLETENESS
6
$248,503
2
$419,635
31
$219,822
2
$14,850
0
$0
4
$21,780
Aggregated Statistics For Year 2008 (Based on 4 full tracts)
A) FHA, FSA/RHS & VA Home Purchase Loans
B) Conventional Home Purchase Loans
C) Refinancings
D) Home Improvement Loans
F) Non-occupant Loans on < 5 Family Dwellings (A B C & D)
Number
Average Value
Number
Average Value
Number
Average Value
Number
Average Value
Number
Average Value
LOANS ORIGINATED
112
$216,117
251
$229,540
423
$189,401
83
$56,294
29
$135,429
APPLICATIONS APPROVED, NOT ACCEPTED
2
$144,435
29
$220,927
114
$213,376
31
$55,450
12
$191,439
APPLICATIONS DENIED
20
$232,920
45
$205,030
301
$216,810
63
$62,259
8
$203,486
APPLICATIONS WITHDRAWN
4
$259,717
22
$221,302
157
$227,712
8
$154,081
2
$321,750
FILES CLOSED FOR INCOMPLETENESS
6
$303,728
10
$226,666
28
$218,209
2
$59,400
2
$139,555
Aggregated Statistics For Year 2007 (Based on 4 full tracts)
A) FHA, FSA/RHS & VA Home Purchase Loans
B) Conventional Home Purchase Loans
C) Refinancings
D) Home Improvement Loans
F) Non-occupant Loans on < 5 Family Dwellings (A B C & D)
G) Loans On Manufactured Home Dwelling (A B C & D)
Number
Average Value
Number
Average Value
Number
Average Value
Number
Average Value
Number
Average Value
Number
Average Value
LOANS ORIGINATED
41
$222,718
438
$195,622
644
$177,417
197
$72,881
45
$249,635
2
$19,520
APPLICATIONS APPROVED, NOT ACCEPTED
4
$196,858
51
$222,065
175
$183,307
22
$80,699
8
$180,599
2
$24,400
APPLICATIONS DENIED
4
$267,538
90
$179,887
477
$206,618
106
$98,975
27
$186,586
0
$0
APPLICATIONS WITHDRAWN
2
$250,470
27
$251,720
171
$193,668
18
$125,867
10
$145,710
2
$29,700
FILES CLOSED FOR INCOMPLETENESS
0
$0
2
$11,710
77
$252,018
2
$29,700
0
$0
0
$0
Aggregated Statistics For Year 2006 (Based on 4 full tracts)
A) FHA, FSA/RHS & VA Home Purchase Loans
B) Conventional Home Purchase Loans
C) Refinancings
D) Home Improvement Loans
E) Loans on Dwellings For 5+ Families
F) Non-occupant Loans on < 5 Family Dwellings (A B C & D)
G) Loans On Manufactured Home Dwelling (A B C & D)
Number
Average Value
Number
Average Value
Number
Average Value
Number
Average Value
Number
Average Value
Number
Average Value
Number
Average Value
LOANS ORIGINATED
27
$213,039
682
$185,883
770
$165,980
169
$62,484
4
$823,770
94
$141,855
0
$0
APPLICATIONS APPROVED, NOT ACCEPTED
2
$118,085
110
$201,606
169
$161,303
47
$90,350
0
$0
6
$155,783
0
$0
APPLICATIONS DENIED
4
$133,210
139
$168,984
369
$188,066
94
$68,128
0
$0
16
$137,486
0
$0
APPLICATIONS WITHDRAWN
4
$248,235
82
$200,980
322
$179,058
18
$107,585
0
$0
6
$107,705
2
$185,420
FILES CLOSED FOR INCOMPLETENESS
0
$0
12
$107,477
89
$175,977
6
$90,108
0
$0
0
$0
0
$0
Aggregated Statistics For Year 2005 (Based on 4 full tracts)
A) FHA, FSA/RHS & VA Home Purchase Loans
B) Conventional Home Purchase Loans
C) Refinancings
D) Home Improvement Loans
E) Loans on Dwellings For 5+ Families
F) Non-occupant Loans on < 5 Family Dwellings (A B C & D)
G) Loans On Manufactured Home Dwelling (A B C & D)
Number
Average Value
Number
Average Value
Number
Average Value
Number
Average Value
Number
Average Value
Number
Average Value
Number
Average Value
LOANS ORIGINATED
51
$175,088
757
$188,806
949
$175,883
173
$65,474
6
$1,076,958
82
$175,587
0
$0
APPLICATIONS APPROVED, NOT ACCEPTED
0
$0
86
$189,475
151
$146,251
29
$63,099
0
$0
6
$120,362
0
$0
APPLICATIONS DENIED
0
$0
134
$164,870
357
$198,588
75
$47,211
0
$0
22
$194,409
4
$252,450
APPLICATIONS WITHDRAWN
0
$0
126
$196,896
349
$183,382
41
$83,287
0
$0
18
$180,343
0
$0
FILES CLOSED FOR INCOMPLETENESS
0
$0
20
$188,795
226
$207,234
4
$77,330
0
$0
2
$161,370
0
$0
Aggregated Statistics For Year 2004 (Based on 4 full tracts)
A) FHA, FSA/RHS & VA Home Purchase Loans
B) Conventional Home Purchase Loans
C) Refinancings
D) Home Improvement Loans
E) Loans on Dwellings For 5+ Families
F) Non-occupant Loans on < 5 Family Dwellings (A B C & D)
G) Loans On Manufactured Home Dwelling (A B C & D)
Number
Average Value
Number
Average Value
Number
Average Value
Number
Average Value
Number
Average Value
Number
Average Value
Number
Average Value
LOANS ORIGINATED
53
$171,775
668
$176,039
1,031
$160,468
150
$68,849
2
$194,205
92
$128,806
0
$0
APPLICATIONS APPROVED, NOT ACCEPTED
4
$194,535
73
$186,958
179
$154,219
47
$30,547
0
$0
16
$153,650
0
$0
APPLICATIONS DENIED
8
$172,999
98
$145,199
350
$162,137
71
$75,922
0
$0
20
$133,482
2
$232,650
APPLICATIONS WITHDRAWN
4
$211,365
51
$184,488
387
$169,726
29
$91,381
4
$79,608
18
$116,484
0
$0
FILES CLOSED FOR INCOMPLETENESS
4
$172,695
20
$216,009
210
$172,489
16
$81,217
0
$0
6
$127,600
0
$0
Aggregated Statistics For Year 2003 (Based on 4 full tracts)
A) FHA, FSA/RHS & VA Home Purchase Loans
B) Conventional Home Purchase Loans
C) Refinancings
D) Home Improvement Loans
E) Loans on Dwellings For 5+ Families
F) Non-occupant Loans on < 5 Family Dwellings (A B C & D)
Number
Average Value
Number
Average Value
Number
Average Value
Number
Average Value
Number
Average Value
Number
Average Value
LOANS ORIGINATED
71
$144,045
609
$183,810
2,257
$147,606
45
$42,219
2
$761,310
86
$135,046
APPLICATIONS APPROVED, NOT ACCEPTED
4
$131,445
77
$183,140
316
$143,489
22
$46,250
0
$0
16
$152,846
APPLICATIONS DENIED
4
$136,432
59
$159,444
607
$149,968
73
$35,035
0
$0
20
$101,858
APPLICATIONS WITHDRAWN
2
$267,395
69
$177,676
346
$148,749
24
$52,990
0
$0
10
$218,841
FILES CLOSED FOR INCOMPLETENESS
2
$192,250
10
$129,663
59
$181,640
2
$12,685
0
$0
0
$0
Aggregated Statistics For Year 2002 (Based on 4 full tracts)
A) FHA, FSA/RHS & VA Home Purchase Loans
B) Conventional Home Purchase Loans
C) Refinancings
D) Home Improvement Loans
F) Non-occupant Loans on < 5 Family Dwellings (A B C & D)
Number
Average Value
Number
Average Value
Number
Average Value
Number
Average Value
Number
Average Value
LOANS ORIGINATED
90
$129,908
543
$166,288
1,263
$138,144
110
$50,177
61
$121,924
APPLICATIONS APPROVED, NOT ACCEPTED
6
$179,850
67
$182,265
210
$115,145
22
$21,931
12
$103,045
APPLICATIONS DENIED
8
$103,164
51
$131,408
295
$117,471
41
$22,634
4
$169,318
APPLICATIONS WITHDRAWN
0
$0
47
$148,442
261
$144,919
35
$36,544
8
$121,014
FILES CLOSED FOR INCOMPLETENESS
0
$0
18
$162,111
53
$155,565
0
$0
2
$171,270
Aggregated Statistics For Year 2001 (Based on 4 full tracts)
A) FHA, FSA/RHS & VA Home Purchase Loans
B) Conventional Home Purchase Loans
C) Refinancings
D) Home Improvement Loans
E) Loans on Dwellings For 5+ Families
F) Non-occupant Loans on < 5 Family Dwellings (A B C & D)
Number
Average Value
Number
Average Value
Number
Average Value
Number
Average Value
Number
Average Value
Number
Average Value
LOANS ORIGINATED
126
$118,704
471
$137,476
918
$121,608
104
$32,024
0
$0
34
$102,647
APPLICATIONS APPROVED, NOT ACCEPTED
8
$148,182
29
$107,153
108
$97,891
39
$29,443
0
$0
6
$113,318
APPLICATIONS DENIED
6
$161,330
47
$123,584
330
$86,409
77
$24,758
2
$178,200
8
$134,888
APPLICATIONS WITHDRAWN
10
$117,905
47
$147,755
220
$101,143
27
$26,691
0
$0
8
$117,796
FILES CLOSED FOR INCOMPLETENESS
4
$170,280
6
$211,200
51
$102,959
4
$27,368
0
$0
4
$64,845
Aggregated Statistics For Year 2000 (Based on 4 full tracts)
A) FHA, FSA/RHS & VA Home Purchase Loans
B) Conventional Home Purchase Loans
C) Refinancings
D) Home Improvement Loans
E) Loans on Dwellings For 5+ Families
F) Non-occupant Loans on < 5 Family Dwellings (A B C & D)
Number
Average Value
Number
Average Value
Number
Average Value
Number
Average Value
Number
Average Value
Number
Average Value
LOANS ORIGINATED
114
$104,584
356
$136,196
279
$87,257
92
$34,026
2
$1,683,000
37
$72,852
APPLICATIONS APPROVED, NOT ACCEPTED
10
$124,547
27
$129,865
63
$120,616
37
$18,784
0
$0
6
$103,445
APPLICATIONS DENIED
6
$133,983
69
$113,527
179
$75,956
69
$36,481
0
$0
6
$111,458
APPLICATIONS WITHDRAWN
8
$85,881
30
$149,694
100
$94,247
16
$31,912
2
$34,650
2
$63,360
FILES CLOSED FOR INCOMPLETENESS
2
$152,460
12
$134,852
49
$113,233
6
$20,635
0
$0
0
$0
Aggregated Statistics For Year 1999 (Based on 2 full tracts)
A) FHA, FSA/RHS & VA Home Purchase Loans
B) Conventional Home Purchase Loans
C) Refinancings
D) Home Improvement Loans
E) Loans on Dwellings For 5+ Families
F) Non-occupant Loans on < 5 Family Dwellings (A B C & D)
Detailed PMIC statistics for the following Tracts:1301.00
, 1302.00
2002 - 2018 National Fire Incident Reporting System (NFIRS) incidents
According to the data from the years 2002 - 2018 the average number of fires per year is 45. The highest number of reported fires - 79 took place in 2004, and the least - 22 in 2005. The data has a decreasing trend.
When looking into fire subcategories, the most incidents belonged to: Outside Fires (37.3%), and Structure Fires (34.0%).
Fire incident types reported to NFIRS in Zip Code 06483


 Nearest zip codes: 06401, 06418, 06403, 06525, 06478, 06524.


 According to the data from the years 2002 - 2018 the average number of fires per year is 45. The highest number of reported fires - 79 took place in 2004, and the least - 22 in 2005. The data has a decreasing trend.
 When looking into fire subcategories, the most incidents belonged to: Outside Fires (37.3%), and Structure Fires (34.0%).