Estimated zip code population in 2022: 20,018 Zip code population in 2010: 19,904 Zip code population in 2000: 18,567
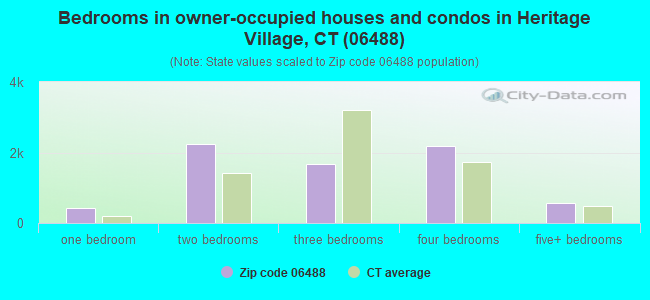
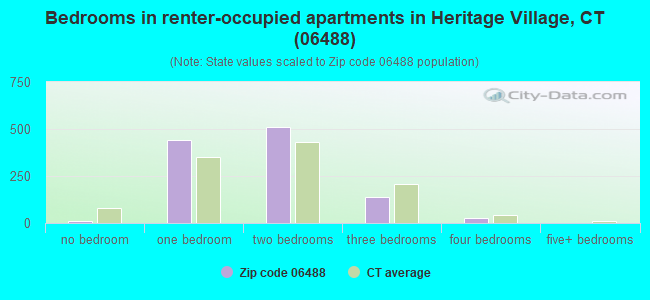
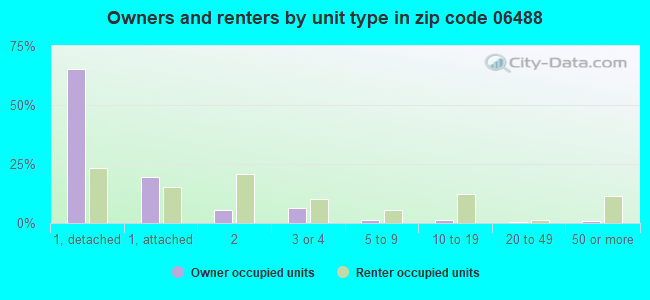
Houses and condos: 8,858 Renter-occupied apartments: 1,124
% of renters here:
14%
State:
34%
March 2022 cost of living index in zip code 06488: 128.3 (high, U.S. average is 100)
Land area: 39.0 sq. mi. Water area: 1.1 sq. mi.
Population density: 513 people per square mile
(low).
OSM Map
Google Map
MSN Map
OSM Map
General Map
Google Map
MSN Map
OSM Map
Google Map
MSN Map
OSM Map
Google Map
MSN Map
Please wait while loading the map...
Real estate property taxes paid for housing units in 2022:
This zip code:
1.5% ($5,953)
Connecticut:
1.8% ($6,189)
Median real estate property taxes paid for housing units with mortgages in 2022: $6,498 (1.5%) Median real estate property taxes paid for housing units with no mortgage in 2022: $4,964 (1.8%)
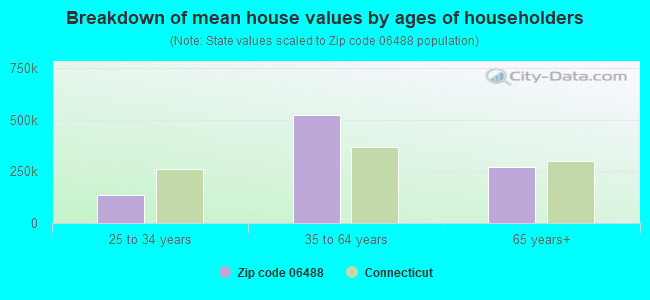
Estimated median house/condo value in 2022: $385,706
06488:
$385,706
Connecticut:
$347,200
According to our research of Connecticut and other state lists, there were 11 registered sex offenders living in 06488 zip code as of April 27, 2024. The ratio of all residents to sex offenders in zip code 06488 is 1,819 to 1. The ratio of registered sex offenders to all residents in this zip code is much lower than the state average.
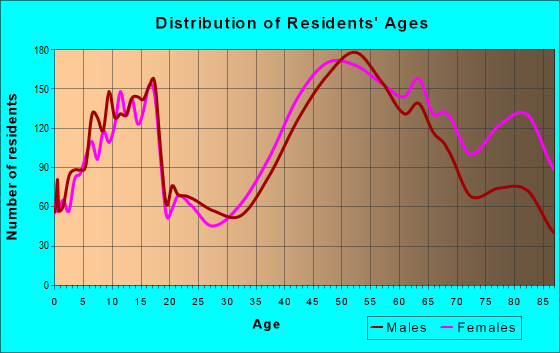
Median resident age:
This zip code:
51.5 years
Connecticut median age:
40.9 years
Average household size:
This zip code:
2.4 people
Connecticut:
2.5 people
Averages for the 2020 tax year for zip code 06488, filed in 2021:
Average Adjusted Gross Income (AGI) in 2020: $115,569 (Individual Income Tax Returns)
Here:
$115,569
State:
$105,931
Salary/wage: $96,913 (reported on 69.6% of returns)
Here:
$96,913
State:
$83,540
(% of AGI for various income ranges: 977.3% for AGIs below $25k, 2825.8% for AGIs $25k-50k, 5281.9% for AGIs $50k-75k, 8180.3% for AGIs $75k-100k, 18333.8% for AGIs $100k-200k, 74326.8% for AGIs over 200k)
Taxable interest for individuals: $1,715 (reported on 48.2% of returns)
This zip code:
$1,715
Connecticut:
$3,402
(% of AGI for various income ranges: 50.1% for AGIs below $25k, 68.0% for AGIs $25k-50k, 103.1% for AGIs $50k-75k, 136.3% for AGIs $75k-100k, 192.1% for AGIs $100k-200k, 663.2% for AGIs over 200k)
Ordinary dividends: $7,501 (reported on 40.0% of returns)
Here:
$7,501
State:
$12,683
(% of AGI for various income ranges: 115.7% for AGIs below $25k, 164.9% for AGIs $25k-50k, 317.0% for AGIs $50k-75k, 518.7% for AGIs $75k-100k, 729.6% for AGIs $100k-200k, 2805.5% for AGIs over 200k)
Net capital gain/loss in AGI: +$14,737 (reported on 34.5% of returns)
Here:
+$14,737
State:
+$44,158
(% of AGI for various income ranges: 34.7% for AGIs below $25k, 102.1% for AGIs $25k-50k, 267.3% for AGIs $50k-75k, 323.0% for AGIs $75k-100k, 845.3% for AGIs $100k-200k, 8078.6% for AGIs over 200k)
Profit/loss from business: +$26,958 (reported on 16.8% of returns)
Here:
+$26,958
State:
+$22,988
(% of AGI for various income ranges: 136.9% for AGIs below $25k, 306.8% for AGIs $25k-50k, 321.1% for AGIs $50k-75k, 540.9% for AGIs $75k-100k, 1124.6% for AGIs $100k-200k, 4860.2% for AGIs over 200k)
Taxable individual retirement arrangement distribution: $21,457 (reported on 18.0% of returns)
06488:
$21,457
Connecticut:
$22,031
(% of AGI for various income ranges: 168.6% for AGIs below $25k, 330.8% for AGIs $25k-50k, 531.9% for AGIs $50k-75k, 797.2% for AGIs $75k-100k, 1181.5% for AGIs $100k-200k, 2198.9% for AGIs over 200k)
Self-employed (Keogh) retirement plans: $27,500 (reported on 2.2% of returns)
06488:
$27,500
Connecticut:
$29,016
(% of AGI for various income ranges: 63.0% for AGIs $50k-75k, 93.1% for AGIs $100k-200k, 1006.4% for AGIs over 200k)
Total itemized deductions: $31,081 (reported on 17.3% of returns)
Here:
$31,081
State:
$37,613
(% of AGI for various income ranges: 220.7% for AGIs below $25k, 366.0% for AGIs $25k-50k, 681.8% for AGIs $50k-75k, 1064.0% for AGIs $75k-100k, 1481.7% for AGIs $100k-200k, 3949.5% for AGIs over 200k)
Charity contributions: $5,879 (reported on 14.4% of returns)
Here:
$5,879
State:
$13,557
(% of AGI for various income ranges: 8.6% for AGIs below $25k, 22.4% for AGIs $25k-50k, 51.0% for AGIs $50k-75k, 108.8% for AGIs $75k-100k, 209.0% for AGIs $100k-200k, 1046.4% for AGIs over 200k)
Taxes paid: $8,614 (reported on 17.3% of returns)
06488:
$8,614
State:
$9,096
(% of AGI for various income ranges: 35.3% for AGIs below $25k, 74.3% for AGIs $25k-50k, 190.1% for AGIs $50k-75k, 349.9% for AGIs $75k-100k, 469.8% for AGIs $100k-200k, 1001.8% for AGIs over 200k)
Earned income credit: $1,482 (reported on 4.4% of returns)
Here:
$1,482
State:
$2,059
(% of AGI for various income ranges: 27.6% for AGIs below $25k, 25.6% for AGIs $25k-50k)
Percentage of individuals using paid preparers for their 2020 taxes: 91.5%
Here:
91%
State:
93%
(% for various income ranges: 89.9% for AGIs below $25k, 91.8% for AGIs $25k-50k, 91.4% for AGIs $50k-75k, 91.3% for AGIs $75k-100k, 92.3% for AGIs $100k-200k, 92.9% for AGIs over 200k)
Averages for the 2012 tax year for zip code 06488, filed in 2013:
Average Adjusted Gross Income (AGI) in 2012: $90,833 (Individual Income Tax Returns)
Here:
$90,833
State:
$93,290
Salary/wage: $86,313 (reported on 70.5% of returns)
Here:
$86,313
State:
$73,117
(% of AGI for various income ranges: 52.1% for AGIs below $25k, 53.9% for AGIs $25k-50k, 54.9% for AGIs $50k-75k, 57.8% for AGIs $75k-100k, 73.4% for AGIs $100k-200k, 70.5% for AGIs over 200k)
Taxable interest for individuals: $1,676 (reported on 63.2% of returns)
This zip code:
$1,676
Connecticut:
$2,530
(% of AGI for various income ranges: 3.9% for AGIs below $25k, 2.3% for AGIs $25k-50k, 1.7% for AGIs $50k-75k, 1.4% for AGIs $75k-100k, 0.7% for AGIs $100k-200k, 0.9% for AGIs over 200k)
Ordinary dividends: $6,755 (reported on 44.2% of returns)
Here:
$6,755
State:
$10,909
(% of AGI for various income ranges: 7.0% for AGIs below $25k, 4.6% for AGIs $25k-50k, 4.0% for AGIs $50k-75k, 3.6% for AGIs $75k-100k, 2.4% for AGIs $100k-200k, 3.2% for AGIs over 200k)
Net capital gain/loss in AGI: +$8,791 (reported on 36.0% of returns)
Here:
+$8,791
State:
+$34,090
(% of AGI for various income ranges: 0.5% for AGIs $25k-50k, 0.7% for AGIs $50k-75k, 1.1% for AGIs $75k-100k, 1.9% for AGIs $100k-200k, 6.8% for AGIs over 200k)
Profit/loss from business: +$25,533 (reported on 17.1% of returns)
Here:
+$25,533
State:
+$22,741
(% of AGI for various income ranges: 6.2% for AGIs below $25k, 4.4% for AGIs $25k-50k, 4.5% for AGIs $50k-75k, 3.8% for AGIs $75k-100k, 5.1% for AGIs $100k-200k, 4.9% for AGIs over 200k)
Taxable individual retirement arrangement distribution: $15,594 (reported on 21.5% of returns)
06488:
$15,594
Connecticut:
$19,976
(% of AGI for various income ranges: 9.4% for AGIs below $25k, 8.1% for AGIs $25k-50k, 5.9% for AGIs $50k-75k, 5.7% for AGIs $75k-100k, 3.2% for AGIs $100k-200k, 1.9% for AGIs over 200k)
Self-employment retirement plans: $24,367 (reported on 1.8% of returns)
06488:
$24,367
Connecticut:
$24,004
(% of AGI for various income ranges: 0.5% for AGIs $25k-50k, 0.5% for AGIs $100k-200k, 0.8% for AGIs over 200k)
Total itemized deductions: $28,793 (21% of AGI, reported on 55.0% of returns)
Here:
$28,793
State:
$33,239
Here:
20.5% of AGI
State:
18.9% of AGI
(% of AGI for various income ranges: 26.8% for AGIs below $25k, 19.8% for AGIs $25k-50k, 19.3% for AGIs $50k-75k, 20.3% for AGIs $75k-100k, 19.1% for AGIs $100k-200k, 13.8% for AGIs over 200k)
Charity contributions: $2,739 (reported on 48.4% of returns)
Here:
$2,739
State:
$4,947
(% of AGI for various income ranges: 1.3% for AGIs below $25k, 1.5% for AGIs $25k-50k, 1.4% for AGIs $50k-75k, 1.5% for AGIs $75k-100k, 1.6% for AGIs $100k-200k, 1.4% for AGIs over 200k)
Taxes paid: $13,878 (reported on 54.9% of returns)
06488:
$13,878
State:
$17,397
(% of AGI for various income ranges: 6.9% for AGIs below $25k, 5.9% for AGIs $25k-50k, 7.3% for AGIs $50k-75k, 8.6% for AGIs $75k-100k, 9.3% for AGIs $100k-200k, 8.4% for AGIs over 200k)
Earned income credit: $1,450 (reported on 4.4% of returns)
Here:
$1,450
State:
$2,053
(% of AGI for various income ranges: 1.5% for AGIs below $25k, 0.3% for AGIs $25k-50k)
Percentage of individuals using paid preparers for their 2012 taxes: 55.8%
Here:
56%
State:
55%
(% for various income ranges: 47.3% for AGIs below $25k, 53.7% for AGIs $25k-50k, 60.6% for AGIs $50k-75k, 62.1% for AGIs $75k-100k, 58.5% for AGIs $100k-200k, 66.7% for AGIs over 200k)
Averages for the 2004 tax year for zip code 06488, filed in 2005:
Average Adjusted Gross Income (AGI) in 2004: $73,582 (Individual Income Tax Returns)
Here:
$73,582
State:
$73,265
Salary/wage: $72,565 (reported on 68.7% of returns)
Here:
$72,565
State:
$62,030
(% of AGI for various income ranges: 105.2% for AGIs below $10k, 41.8% for AGIs $10k-25k, 53.5% for AGIs $25k-50k, 57.7% for AGIs $50k-75k, 69.0% for AGIs $75k-100k, 72.6% for AGIs over 100k)
Taxable interest for individuals: $2,276 (reported on 77.0% of returns)
This zip code:
$2,276
Connecticut:
$2,287
(% of AGI for various income ranges: 13.6% for AGIs below $10k, 8.9% for AGIs $10k-25k, 4.5% for AGIs $25k-50k, 3.4% for AGIs $50k-75k, 2.2% for AGIs $75k-100k, 1.4% for AGIs over 100k)
Taxable dividends: $5,084 (reported on 53.5% of returns)
Here:
$5,084
State:
$5,735
(% of AGI for various income ranges: 15.7% for AGIs below $10k, 9.1% for AGIs $10k-25k, 5.7% for AGIs $25k-50k, 4.7% for AGIs $50k-75k, 3.6% for AGIs $75k-100k, 2.8% for AGIs over 100k)
Net capital gain/loss: +$7,329 (reported on 43.7% of returns)
Here:
+$7,329
State:
+$23,694
(% of AGI for various income ranges: -11.3% for AGIs below $10k, 1.2% for AGIs $10k-25k, 0.6% for AGIs $25k-50k, 1.6% for AGIs $50k-75k, 1.7% for AGIs $75k-100k, 6.3% for AGIs over 100k)
Profit/loss from business: +$24,091 (reported on 16.2% of returns)
Here:
+$24,091
State:
+$20,783
(% of AGI for various income ranges: 5.2% for AGIs below $10k, 7.3% for AGIs $10k-25k, 5.4% for AGIs $25k-50k, 5.0% for AGIs $50k-75k, 4.6% for AGIs $75k-100k, 5.4% for AGIs over 100k)
IRA payment deduction: $3,482 (reported on 3.9% of returns)
06488:
$3,482
Connecticut:
$3,216
(% of AGI for various income ranges: 1.0% for AGIs below $10k, 0.3% for AGIs $10k-25k, 0.4% for AGIs $25k-50k, 0.3% for AGIs $50k-75k, 0.3% for AGIs $75k-100k, 0.1% for AGIs over 100k)
Self-employed pension: $15,252 (reported on 2.7% of returns)
Here:
$15,252
Connecticut:
$17,335
(% of AGI for various income ranges: 0.2% for AGIs $10k-25k, 0.2% for AGIs $25k-50k, 0.3% for AGIs $50k-75k, 0.3% for AGIs $75k-100k, 0.7% for AGIs over 100k)
Total itemized deductions: $24,025 (22% of AGI, reported on 56.5% of returns)
Here:
$24,025
State:
$24,919
Here:
21.7% of AGI
State:
18.6% of AGI
(% of AGI for various income ranges: 39.5% for AGIs below $10k, 27.8% for AGIs $10k-25k, 21.2% for AGIs $25k-50k, 21.3% for AGIs $50k-75k, 20.6% for AGIs $75k-100k, 16.3% for AGIs over 100k)
Charity contributions deductions: $2,976 (3% of AGI, reported on 52.4% of returns)
Here:
$2,976
State:
$3,762
Here:
2.6% of AGI
State:
2.7% of AGI
(% of AGI for various income ranges: 1.4% for AGIs below $10k, 1.9% for AGIs $10k-25k, 2.0% for AGIs $25k-50k, 2.1% for AGIs $50k-75k, 2.0% for AGIs $75k-100k, 2.2% for AGIs over 100k)
Total tax: $13,156 (reported on 82.4% of returns)
06488:
$13,156
State:
$15,148
(% of AGI for various income ranges: 3.7% for AGIs below $10k, 4.6% for AGIs $10k-25k, 8.0% for AGIs $25k-50k, 9.6% for AGIs $50k-75k, 10.3% for AGIs $75k-100k, 18.3% for AGIs over 100k)
Earned income credit: $1,247 (reported on 2.8% of returns)
Here:
$1,247
State:
$1,570
Percentage of individuals using paid preparers for their 2004 taxes: 59.4%
Here:
59%
State:
59%
(% for various income ranges: 50.2% for AGIs below $10k, 60.3% for AGIs $10k-25k, 61.6% for AGIs $25k-50k, 65.6% for AGIs $50k-75k, 59.2% for AGIs $75k-100k, 60.6% for AGIs over 100k)
Likely homosexual households (counted as self-reported same-sex unmarried-partner households)
Lesbian couples: 0.2% of all households
Gay men: 0.2% of all households
Household received Food Stamps/SNAP in the past 12 months: 370 Household did not receive Food Stamps/SNAP in the past 12 months: 7,753
Women who had a birth in the past 12 months: 147 (114 now married, 30 unmarried) Women who did not have a birth in the past 12 months: 3,125 (1,694 now married, 1,384 unmarried)
Housing units in zip code 06488 with a mortgage: 3,966 (371 second mortgage, 299 both second mortgage and home equity loan) Houses without a mortgage: 179
Median monthly owner costs for units with a mortgage: $2,420 Median monthly owner costs for units without a mortgage: $1,180
Residents with income below the poverty level in 2022:
This zip code:
3.6%
Whole state:
9.8%
Residents with income below 50% of the poverty level in 2022:
This zip code:
1.4%
Whole state:
4.8%
Median number of rooms in houses and condos:
Here:
6.7
State:
6.5
Median number of rooms in apartments:
Here:
3.8
State:
4.0
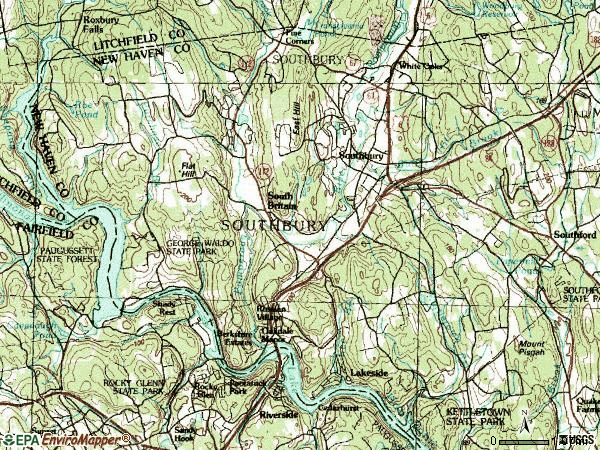
Notable locations in this zip code not listed on our city pages
Notable locations in zip code 06488: Southbury Shopping Plaza (A), Pomperaug Golf Club (B), White Oaks (C), Heritage Country Club (D), Pine Corners (E), Southbury Public Library (F), Southbury Playhouse (G), Old Town Museum (H), Southbury Ambulance Association (I), Heritage Village Ambulance Association (J), Southbury Training School Fire Department (K), Southbury Volunteer Firemens Association Southford Fire House (L), Southbury Volunteer Firemens Association Purchase Fire House (M), Southbury Volunteer Firemens Association South Britain Fire House (N), Southbury Volunteer Firemens Association Headquarters (O), Southbury Fire Marshal's Office (P). Display/hide their locations on the map
Churches in zip code 06488 include: Sacred Heart Church (A), South Britain Congregational Church (B), United Church of Christ (C), Church of the Epiphany (D). Display/hide their locations on the map
Cemeteries: Pine Hill Cemetery (1), Stiles Memorial Cemetery (2), Pierce Hollow Cemetery (3), Middleground Cemetery (4). Display/hide their locations on the map
Streams, rivers, and creeks: Little Pootatuck Brook (A), Pomperaug River (B), Purchase Brook (C), Shepaug River (D), Spruce Brook (E), Bullet Hill Brook (F), Transylvania Brook (G), Kettletown Brook (H), Stiles Brook (I). Display/hide their locations on the map
Parks in zip code 06488 include: Union Square (1), Southbury Historic District Number 1 (2), South Britain Historic District (3), George C Waldo State Park (4), Russian Village Historic District (5), Platt Park (6), Bend of the River Sanctuary (7), Edward Park (8), Lake Zoar Wildlife Area (9). Display/hide their locations on the map
In group quarters: 587 (-1 institutionalized population)
Size of family households: 2,369 2-persons, 1,060 3-persons, 1,063 4-persons, 270 5-persons, 168 6-persons, 59 7-or-more-persons
Size of nonfamily households: 2,776 1-person, 394 2-persons, 16 3-persons
3,155 married couples with children.
370 single-parent households (42 men, 328 women).
90.6% of residents of 06488 zip code speak English at home.
1.8% of residents speak Spanish at home (82% very well, 10% well, 8% not well).
4.0% of residents speak other Indo-European language at home (75% very well, 17% well, 2% not well, 5% not at all).
3.1% of residents speak Asian or Pacific Island language at home (69% very well, 5% well, 26% not well).
0.7% of residents speak other language at home (88% very well, 12% well).
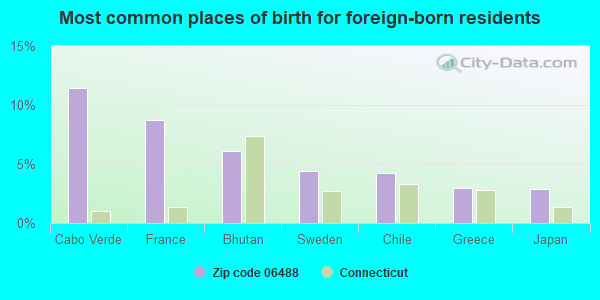
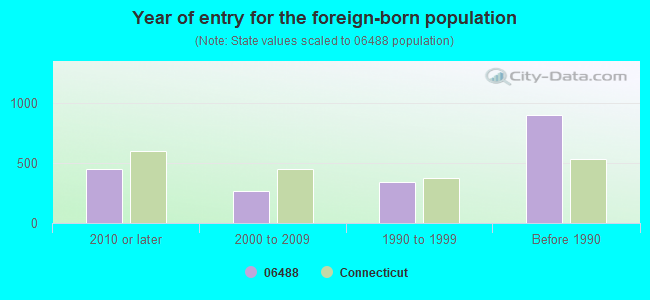
Foreign born population: 1,686 (8.4%) (69.5% of them are naturalized citizens)
This zip code:
8.4%
Whole state:
15.7%
11%Cabo Verde
9%France
6%Bhutan
4%Sweden
4%Chile
3%Greece
3%Japan
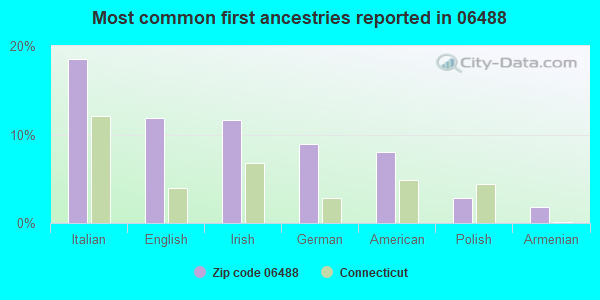
19%Italian
12%English
12%Irish
9%German
8%American
3%Polish
2%Armenian
Year of entry for the foreign-born population
4472010 or later
2712000 to 2009
3441990 to 1999
901Before 1990
Major facilities with environmental interests located in this zip code:
O & G INDUSTRIES CONCRETE SAND & GRAVEL (236 ROXBURY ROAD, ROUTE 67 in SOUTHBURY, CT)
AIR MINOR (AIRS/AFS) AIR SYNTHETIC MINOR (AIRS/AFS) CRITERIA AND HAZARDOUS AIR POLLUTANT INVENTORY (Inventory of air pollution sources) Small Quantity Generators, between 100 kg and 1000 kg of hazardous waste/month (Resource Conservation and Recovery Act (tracking hazardous waste)) USED OIL PROGRAM (Resource Conservation and Recovery Act (tracking hazardous waste)) TRI REPORTER (Tracking of toxic chemicals releasing facilities) Business SIC classification: CRUSHED AND BROKEN STONE; ASPHALT PAVING MIXTURES AND BLOCKS; READY-MIXED CONCRETE Organizations: O & G INDUSTRIES INC (CONTACT/OPERATOR)
, O & G IND INC (CONTACT/OWNER)
Alternative names: O & G INDUSTRIES INC, O & G IND INC SOUTHBURY REPAIR GARAGE, O & G INDUSTRIES INC(STILES Q), O & G INDUSTRIES, INC., O&G INDUSTRIES, INC. - SOUTHBURY QUARRY
GAINFIELD ELEMENTARY SCHOOL (307 OLD FIELD ROAD in SOUTHBURY, CT)
(National Center for Education Statistics) - STATE ID-4 Organizations: REGIONAL SCHOOL DISTRICT 15 (SCHOOL DISTRICT)
HINE BROS, INC (67 MAIN ST in SOUTHBURY, CT)
AIR MINOR (AIRS/AFS) Small Quantity Generators, between 100 kg and 1000 kg of hazardous waste/month (Resource Conservation and Recovery Act (tracking hazardous waste)) - notification Business SIC classification: GASOLINE SERVICE STATIONS Organizations: KENNETH R HINE (CONTACT/OWNER)
ADVANCED ANIMATIONS INC (800 MAIN ST in SOUTHBURY, CT)
(Resource Conservation and Recovery Act (tracking hazardous waste)) Organizations: MARQUIS JIM (CONTACT/OWNER)
GENOVESE DRUG STORE NO 81 (775 MAIN ST in SOUTHBURY, CT)
IBM CORPORATION (150 KETTLETOWN ROAD in SOUTHBURY, CT)
AIR SYNTHETIC MINOR (AIRS/AFS) National Pollutant Discharge Elimination System NON-MAJOR (Tracking pollutant discharge elimination systems) - permit Business SIC classification: COMPUTER PROGRAMMING SERVICES; COMPUTER RELATED SERVICES Alternative names: I B M CORPORATION, IBM PRINTING SYSTEMS COMPANY, IBM PRINTING SYSTEMS CO (DBA PENNANT SYSTEMS), IBM (SOUTHBURY)
HERITAGE VILLAGE SEWER AUTHORITY (316 HERITAGE ROAD in SOUTHBURY, CT)
National Pollutant Discharge Elimination System NON-MAJOR (Tracking pollutant discharge elimination systems) - permit Business SIC classification: OPERATORS OF DWELLINGS OTHER THAN APARTMENT BUILDINGS Alternative names: HERITAGE VILLAGE WATER CO
A G T VALVE 23 (623-661 SOUTHFORD RD in SOUTHBURY, CT)
Small Quantity Generators, between 100 kg and 1000 kg of hazardous waste/month (Resource Conservation and Recovery Act (tracking hazardous waste)) - notification Organizations: ALGONQUIN GAS TRANSMISSION COMPANY (CONTACT/OWNER)
C V S # 1123 (22 DEPOT HILL RD in SOUTHBURY, CT)
Small Quantity Generators, between 100 kg and 1000 kg of hazardous waste/month (Resource Conservation and Recovery Act (tracking hazardous waste)) - notification Organizations: C V S PHARMACY (CONTACT/OWNER)
C V S 1887 (SOUTHBURY PLAZA AND NEW HEAVEN in SOUTHBURY, CT)
Small Quantity Generators, between 100 kg and 1000 kg of hazardous waste/month (Resource Conservation and Recovery Act (tracking hazardous waste)) - notification Organizations: CVS PHARMACY (CONTACT/OWNER)
CLASSIC COACH WORKS (1319 SOUTHFORD RD in SOUTHBURY, CT)
Conditionally Exempt Small Quantity Generators, less than 100 kg/month of hazardous waste (Resource Conservation and Recovery Act (tracking hazardous waste)) Organizations: JIM MONGELLI (CONTACT/OWNER)
FOOD CONCEPTS UNLIMITED (56 MAIN ST in SOUTHBURY, CT)
Small Quantity Generators, between 100 kg and 1000 kg of hazardous waste/month (Resource Conservation and Recovery Act (tracking hazardous waste)) - notification Organizations: EXXON CO USA (CONTACT/OWNER)
Alternative names: EXXON CO USA 38930
PALLADINO MICHAEL G DPM (1 POMPERAUG OFFICE PK in SOUTHBURY, CT)
Conditionally Exempt Small Quantity Generators, less than 100 kg/month of hazardous waste (Resource Conservation and Recovery Act (tracking hazardous waste)) - notification Organizations: MICHAEL G PALLADINO (CONTACT/OWNER)
Housing units lacking complete plumbing facilities: 0.8% Housing units lacking complete kitchen facilities: 0.4%
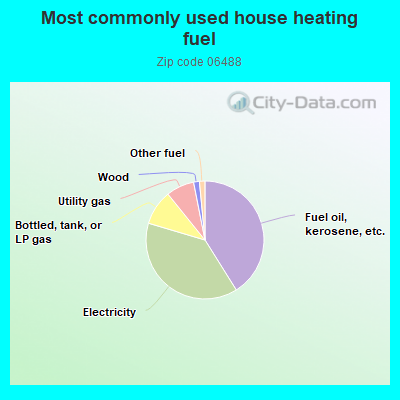
41.1%Fuel oil, kerosene, etc.
38.5%Electricity
9.6%Bottled, tank, or LP gas
7.7%Utility gas
1.6%Wood
1.5%Other fuel
Population in 1990: 15,818. Population change in the 1990s: +2,749 (+17.4%).
Place of birth for U.S.-born residents:
This state: 9,610
Northeast: 6,542
Midwest: 803
South: 679
West: 396
60% of the 06488 zip code residents lived in the same house 5 years ago. Out of people who lived in different houses, 43% lived in this county. Out of people who lived in different counties, 50% lived in Connecticut.
92% of the 06488 zip code residents lived in the same house 1 year ago. Out of people who lived in different houses, 23% moved from this county. Out of people who lived in different houses, 43% moved from different county within same state. Out of people who lived in different houses, 38% moved from different state. Out of people who lived in different houses, 2% moved from abroad.
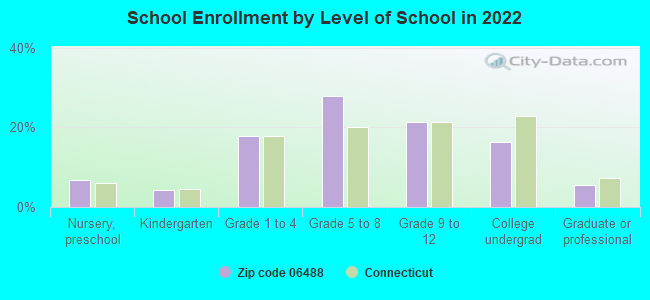
Private vs. public school enrollment:
Students in private schools in grades 1 to 8 (elementary and middle school): 53
Here:
2.9%
Connecticut:
9.5%
Students in private schools in grades 9 to 12 (high school): 8
Here:
1.1%
Connecticut:
12.9%
Students in private undergraduate colleges: 304
Here:
46.2%
Connecticut:
35.5%
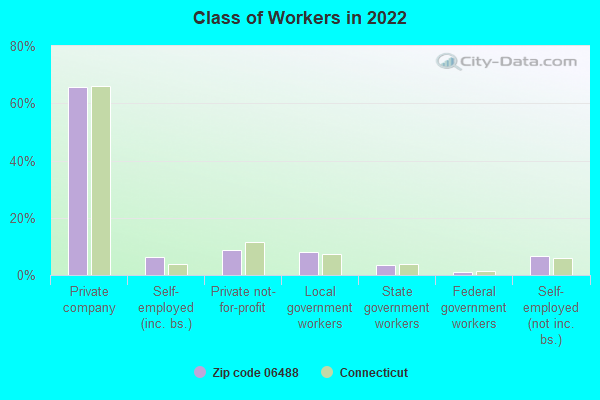
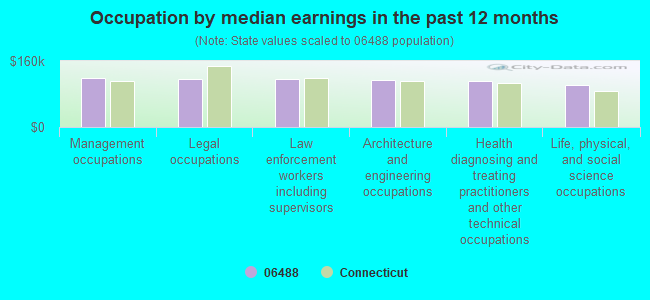
Occupation by median earnings in the past 12 months ($)
118,299Management occupations
117,481Legal occupations
117,402Law enforcement workers including supervisors
114,435Architecture and engineering occupations
112,190Health diagnosing and treating practitioners and other technical occupations
102,674Life, physical, and social science occupations
Companies with federal contracts located in this zip code (SOUTHBURY, CT):
HISTORICAL ART PRINTS (464 BURR RD; small business) : $32,525 in 5 contractsfrom 2004 to 2005
Contracts for Other Professional Services, Outerwear, Men's, Collectors. and/or Historical Items, Miscellaneous Items by National Park Service, Army Signed by year:2000: $0; 2001: $0; 2002: $0; 2003: $0; 2004: $10,000; 2005: $22,525; 2006: $0.
Biggest contracts:
$9,000 with National Park Service for Other Professional Services. Signed on 2005-09-21. Completion date: 2005-11-30.
$8,525 with Army for Outerwear, Men's. Taking place in AL. Signed on 2005-09-29. Completion date: 2005-09-29.
$6,500 with Army for Collectors. and/or Historical Items. Signed on 2004-09-23. Completion date: 2005-01-03.
$5,000 with Army for Miscellaneous Items. Signed on 2005-07-28. Completion date: 2005-08-12.
FURNACE CONCEPTS (186 BEECHER DR; small business)
$24,354 with Navy for Other Defense -- Applied Research and Exploratory Development (R&D). Signed on 2005-04-27. Completion date: 2005-06-30.
THE STONE CONSTRUCTION CO INC (168 MAIN ST SOUTH; small business)
$9,369 with U.S. Army Corps of Engineers - civil program financing only for Ores. Signed on 2003-06-24. Completion date: 2003-07-30.
TECH SERVICES INC (609 JUDD RD; small business)
$3,900 with Army for Maintenance, Repair and Rebuilding of Equipment -- Pumps and Compressors. Signed on 2003-08-14. Completion date: 2003-08-30.
Top industries in this zip code by the number of employees in 2005:
Management of Companies and Enterprises: Corporate, Subsidiary, and Regional Managing Offices (over 1000 employees: 1 establishment, 5-9 employees: 1 establishment, 1-4 employees: 1 establishment)
Health Care and Social Assistance: Nursing Care Facilities (100-249: 3)
Accommodation and Food Services: Hotels (except Casino Hotels) and Motels (100-249: 2, 1-4: 1)
Health Care and Social Assistance: Offices of Physicians (except Mental Health Specialists) (20-49: 3, 10-19: 2, 5-9: 5, 1-4: 8)
Other Services (except Public Administration): Other Similar Organizations (except Business, Professional, Labor, and Political Organizations) (100-249: 1, 1-4: 2)
Finance and Insurance: Real Estate Credit (100-249: 1, 1-4: 2)
Health Care and Social Assistance: Continuing Care Retirement Communities (100-249: 1)
Health Care and Social Assistance: Home Health Care Services (100-249: 1)
People in group quarters in 2010:
484 people in group homes intended for adults
283 people in nursing facilities/skilled-nursing facilities
People in group quarters in 2000:
684 people in homes for the mentally retarded
480 people in nursing homes
Fatal accident statistics in 2014:
Fatal accident count: 1
Vehicles involved in fatal accidents: 1
Fatal accidents caused by drunken drivers: 0
Fatalities: 1
Persons involved in fatal accidents: 1
Pedestrians involved in fatal accidents: 0
Fatal accident statistics in 2013:
Fatal accident count: 1
Vehicles involved in fatal accidents: 2
Fatal accidents caused by drunken drivers: 0
Fatalities: 1
Persons involved in fatal accidents: 2
Pedestrians involved in fatal accidents: 0
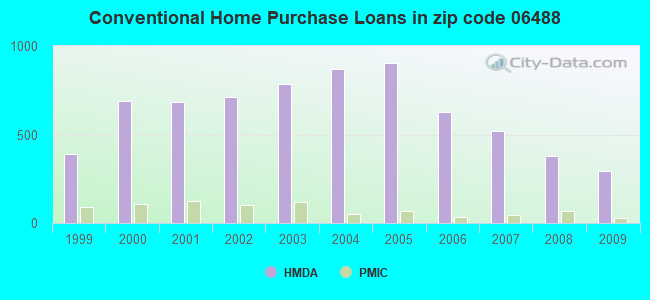
Home Mortgage Disclosure Act Aggregated Statistics For Year 2009 (Based on 6 full tracts)
A) FHA, FSA/RHS & VA Home Purchase Loans
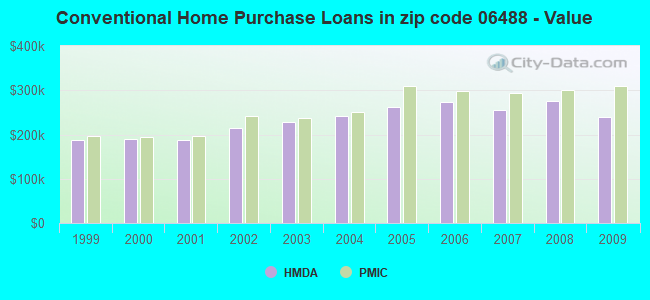
B) Conventional Home Purchase Loans
C) Refinancings
D) Home Improvement Loans
F) Non-occupant Loans on < 5 Family Dwellings (A B C & D)
Number
Average Value
Number
Average Value
Number
Average Value
Number
Average Value
Number
Average Value
LOANS ORIGINATED
71
$244,756
291
$239,635
1,146
$255,064
63
$165,858
29
$206,423
APPLICATIONS APPROVED, NOT ACCEPTED
4
$219,245
22
$268,997
89
$240,957
4
$4,452
2
$254,655
APPLICATIONS DENIED
22
$180,311
38
$248,064
307
$282,741
18
$39,318
20
$130,966
APPLICATIONS WITHDRAWN
6
$207,107
26
$272,945
181
$280,911
0
$0
8
$131,969
FILES CLOSED FOR INCOMPLETENESS
2
$555,930
8
$224,095
41
$290,620
4
$27,362
4
$108,322
Aggregated Statistics For Year 2008 (Based on 6 full tracts)
A) FHA, FSA/RHS & VA Home Purchase Loans
B) Conventional Home Purchase Loans
C) Refinancings
D) Home Improvement Loans
F) Non-occupant Loans on < 5 Family Dwellings (A B C & D)
G) Loans On Manufactured Home Dwelling (A B C & D)
Number
Average Value
Number
Average Value
Number
Average Value
Number
Average Value
Number
Average Value
Number
Average Value
LOANS ORIGINATED
24
$231,764
380
$275,018
514
$253,385
77
$99,273
44
$138,224
2
$99,770
APPLICATIONS APPROVED, NOT ACCEPTED
4
$346,930
62
$294,586
89
$209,285
18
$85,304
14
$191,468
0
$0
APPLICATIONS DENIED
12
$267,160
67
$283,084
229
$268,398
45
$84,658
14
$204,693
0
$0
APPLICATIONS WITHDRAWN
2
$258,180
47
$316,686
124
$273,742
4
$277,720
10
$244,551
0
$0
FILES CLOSED FOR INCOMPLETENESS
0
$0
12
$305,844
22
$336,057
4
$29,675
2
$139,970
0
$0
Aggregated Statistics For Year 2007 (Based on 6 full tracts)
A) FHA, FSA/RHS & VA Home Purchase Loans
B) Conventional Home Purchase Loans
C) Refinancings
D) Home Improvement Loans
F) Non-occupant Loans on < 5 Family Dwellings (A B C & D)
G) Loans On Manufactured Home Dwelling (A B C & D)
Number
Average Value
Number
Average Value
Number
Average Value
Number
Average Value
Number
Average Value
Number
Average Value
LOANS ORIGINATED
8
$247,145
521
$255,453
623
$218,700
142
$113,298
63
$188,578
2
$129,975
APPLICATIONS APPROVED, NOT ACCEPTED
2
$210,945
51
$334,908
154
$235,590
31
$95,943
8
$203,055
0
$0
APPLICATIONS DENIED
0
$0
53
$283,150
375
$285,305
63
$128,050
31
$231,286
2
$63,310
APPLICATIONS WITHDRAWN
2
$270,805
47
$315,827
111
$261,220
18
$148,310
4
$106,978
0
$0
FILES CLOSED FOR INCOMPLETENESS
0
$0
10
$198,922
44
$265,743
8
$84,082
6
$319,937
0
$0
Aggregated Statistics For Year 2006 (Based on 6 full tracts)
A) FHA, FSA/RHS & VA Home Purchase Loans
B) Conventional Home Purchase Loans
C) Refinancings
D) Home Improvement Loans
E) Loans on Dwellings For 5+ Families
F) Non-occupant Loans on < 5 Family Dwellings (A B C & D)
Number
Average Value
Number
Average Value
Number
Average Value
Number
Average Value
Number
Average Value
Number
Average Value
LOANS ORIGINATED
10
$224,281
628
$273,531
815
$226,443
160
$105,674
0
$0
77
$218,896
APPLICATIONS APPROVED, NOT ACCEPTED
2
$202,960
112
$267,261
154
$197,473
24
$115,945
0
$0
16
$325,568
APPLICATIONS DENIED
0
$0
98
$261,223
378
$316,511
65
$99,816
0
$0
12
$236,592
APPLICATIONS WITHDRAWN
2
$226,150
67
$266,517
291
$299,480
22
$81,544
2
$989,200
8
$241,280
FILES CLOSED FOR INCOMPLETENESS
0
$0
21
$257,628
77
$287,592
8
$195,301
0
$0
2
$113,075
Aggregated Statistics For Year 2005 (Based on 6 full tracts)
A) FHA, FSA/RHS & VA Home Purchase Loans
B) Conventional Home Purchase Loans
C) Refinancings
D) Home Improvement Loans
E) Loans on Dwellings For 5+ Families
F) Non-occupant Loans on < 5 Family Dwellings (A B C & D)
Number
Average Value
Number
Average Value
Number
Average Value
Number
Average Value
Number
Average Value
Number
Average Value
LOANS ORIGINATED
4
$172,958
904
$261,899
935
$245,301
146
$77,928
4
$11,193,760
131
$241,302
APPLICATIONS APPROVED, NOT ACCEPTED
0
$0
87
$269,206
138
$241,677
18
$86,091
0
$0
10
$245,644
APPLICATIONS DENIED
0
$0
101
$233,940
301
$280,479
55
$85,891
0
$0
24
$257,148
APPLICATIONS WITHDRAWN
0
$0
81
$273,191
290
$245,481
27
$167,637
0
$0
14
$358,354
FILES CLOSED FOR INCOMPLETENESS
0
$0
18
$172,287
164
$271,874
4
$234,935
0
$0
2
$198,960
Aggregated Statistics For Year 2004 (Based on 6 full tracts)
A) FHA, FSA/RHS & VA Home Purchase Loans
B) Conventional Home Purchase Loans
C) Refinancings
D) Home Improvement Loans
F) Non-occupant Loans on < 5 Family Dwellings (A B C & D)
G) Loans On Manufactured Home Dwelling (A B C & D)
Number
Average Value
Number
Average Value
Number
Average Value
Number
Average Value
Number
Average Value
Number
Average Value
LOANS ORIGINATED
4
$249,772
868
$242,059
1,063
$223,289
142
$90,432
77
$169,248
0
$0
APPLICATIONS APPROVED, NOT ACCEPTED
0
$0
105
$237,456
128
$231,557
30
$126,870
10
$275,220
0
$0
APPLICATIONS DENIED
0
$0
75
$273,890
243
$275,138
57
$74,541
10
$114,855
2
$24,730
APPLICATIONS WITHDRAWN
4
$142,365
63
$246,290
237
$221,052
35
$83,043
2
$396,670
0
$0
FILES CLOSED FOR INCOMPLETENESS
0
$0
26
$255,936
146
$220,507
6
$26,378
0
$0
0
$0
Aggregated Statistics For Year 2003 (Based on 6 full tracts)
A) FHA, FSA/RHS & VA Home Purchase Loans
B) Conventional Home Purchase Loans
C) Refinancings
D) Home Improvement Loans
E) Loans on Dwellings For 5+ Families
F) Non-occupant Loans on < 5 Family Dwellings (A B C & D)
Number
Average Value
Number
Average Value
Number
Average Value
Number
Average Value
Number
Average Value
Number
Average Value
LOANS ORIGINATED
14
$169,908
788
$229,333
2,978
$202,632
102
$68,285
2
$366,005
97
$179,767
APPLICATIONS APPROVED, NOT ACCEPTED
2
$169,965
79
$242,116
343
$204,694
18
$49,856
0
$0
6
$91,910
APPLICATIONS DENIED
2
$178,640
51
$215,867
457
$219,073
31
$57,445
0
$0
24
$416,866
APPLICATIONS WITHDRAWN
0
$0
49
$235,878
268
$196,864
6
$85,730
0
$0
8
$122,468
FILES CLOSED FOR INCOMPLETENESS
4
$137,848
16
$304,152
79
$246,077
2
$23,755
0
$0
4
$140,472
Aggregated Statistics For Year 2002 (Based on 6 full tracts)
A) FHA, FSA/RHS & VA Home Purchase Loans
B) Conventional Home Purchase Loans
C) Refinancings
D) Home Improvement Loans
F) Non-occupant Loans on < 5 Family Dwellings (A B C & D)
Number
Average Value
Number
Average Value
Number
Average Value
Number
Average Value
Number
Average Value
LOANS ORIGINATED
12
$170,927
710
$214,208
1,899
$190,006
138
$44,021
60
$155,165
APPLICATIONS APPROVED, NOT ACCEPTED
6
$173,057
73
$192,542
241
$150,246
35
$53,530
8
$198,210
APPLICATIONS DENIED
0
$0
28
$253,111
282
$182,476
53
$35,792
20
$175,359
APPLICATIONS WITHDRAWN
0
$0
53
$259,644
246
$183,733
18
$37,151
4
$47,510
FILES CLOSED FOR INCOMPLETENESS
0
$0
12
$292,430
140
$201,553
6
$78,807
2
$359,930
Aggregated Statistics For Year 2001 (Based on 6 full tracts)
A) FHA, FSA/RHS & VA Home Purchase Loans
B) Conventional Home Purchase Loans
C) Refinancings
D) Home Improvement Loans
F) Non-occupant Loans on < 5 Family Dwellings (A B C & D)
Number
Average Value
Number
Average Value
Number
Average Value
Number
Average Value
Number
Average Value
LOANS ORIGINATED
26
$159,503
684
$187,321
1,310
$179,305
118
$38,397
59
$106,619
APPLICATIONS APPROVED, NOT ACCEPTED
2
$146,970
54
$207,758
148
$162,037
20
$25,388
8
$237,856
APPLICATIONS DENIED
0
$0
29
$213,395
242
$140,969
39
$30,895
6
$152,788
APPLICATIONS WITHDRAWN
2
$106,835
41
$148,914
153
$156,126
18
$27,366
6
$59,867
FILES CLOSED FOR INCOMPLETENESS
0
$0
4
$106,105
71
$234,659
2
$11,400
0
$0
Aggregated Statistics For Year 2000 (Based on 6 full tracts)
A) FHA, FSA/RHS & VA Home Purchase Loans
B) Conventional Home Purchase Loans
C) Refinancings
D) Home Improvement Loans
F) Non-occupant Loans on < 5 Family Dwellings (A B C & D)
Number
Average Value
Number
Average Value
Number
Average Value
Number
Average Value
Number
Average Value
LOANS ORIGINATED
12
$139,730
688
$189,035
307
$125,642
140
$33,958
32
$130,024
APPLICATIONS APPROVED, NOT ACCEPTED
2
$106,835
61
$216,521
38
$114,777
31
$29,394
8
$123,915
APPLICATIONS DENIED
6
$154,142
63
$250,895
149
$132,423
41
$64,804
4
$204,270
APPLICATIONS WITHDRAWN
2
$84,985
59
$239,752
77
$131,439
30
$65,339
4
$78,670
FILES CLOSED FOR INCOMPLETENESS
4
$142,585
10
$147,575
43
$162,687
4
$29,285
0
$0
Aggregated Statistics For Year 1999 (Based on 2 full and 1 partial tracts)
A) FHA, FSA/RHS & VA Home Purchase Loans
B) Conventional Home Purchase Loans
C) Refinancings
D) Home Improvement Loans
F) Non-occupant Loans on < 5 Family Dwellings (A B C & D)
2002 - 2018 National Fire Incident Reporting System (NFIRS) incidents
According to the data from the years 2002 - 2018 the average number of fires per year is 58. The highest number of reported fires - 82 took place in 2005, and the least - 39 in 2012. The data has an increasing trend.
When looking into fire subcategories, the most incidents belonged to: Structure Fires (45.0%), and Outside Fires (28.5%).
Fire incident types reported to NFIRS in Zip Code 06488


 Nearest zip codes: 06482, 06798, 06478, 06783, 06470, 06762.


 According to the data from the years 2002 - 2018 the average number of fires per year is 58. The highest number of reported fires - 82 took place in 2005, and the least - 39 in 2012. The data has an increasing trend.
 When looking into fire subcategories, the most incidents belonged to: Structure Fires (45.0%), and Outside Fires (28.5%).