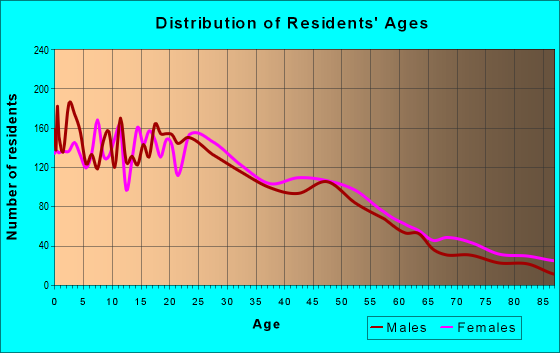
Estimated zip code population in 2022: 16,116 Zip code population in 2010: 16,428 Zip code population in 2000: 16,063
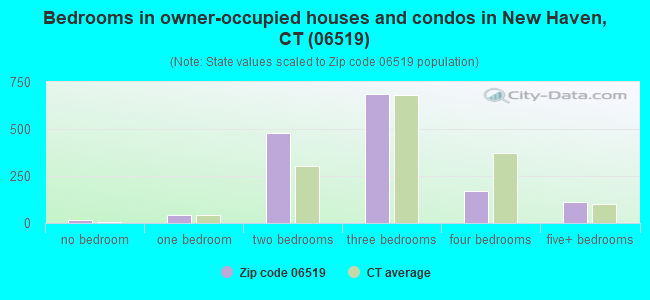
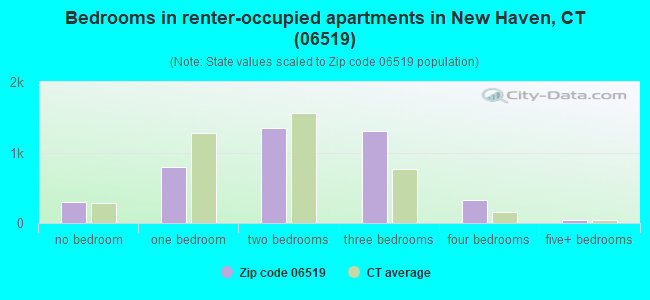
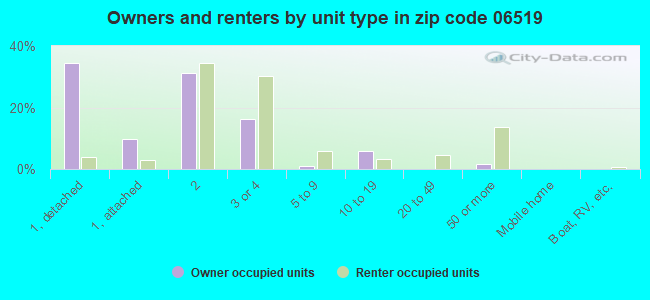
Houses and condos: 6,391 Renter-occupied apartments: 4,142
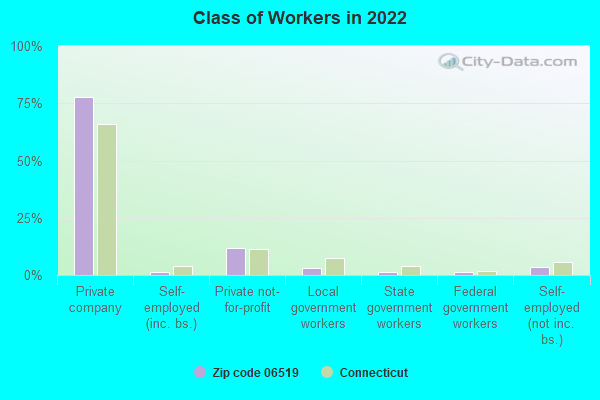
% of renters here:
74%
State:
34%
March 2022 cost of living index in zip code 06519: 129.9 (high, U.S. average is 100)
Land area: 1.7 sq. mi. Water area: 0.6 sq. mi.
Population density: 9,642 people per square mile
(high).
OSM Map
Google Map
MSN Map
OSM Map
General Map
Google Map
MSN Map
OSM Map
Google Map
MSN Map
OSM Map
Google Map
MSN Map
Please wait while loading the map...
Real estate property taxes paid for housing units in 2022:
This zip code:
1.9% ($4,382)
Connecticut:
1.8% ($6,189)
Median real estate property taxes paid for housing units with mortgages in 2022: $4,371 (1.8%) Median real estate property taxes paid for housing units with no mortgage in 2022: $4,409 (2.0%)
Averages for the 2020 tax year for zip code 06519, filed in 2021:
Average Adjusted Gross Income (AGI) in 2020: $35,439 (Individual Income Tax Returns)
Here:
$35,439
State:
$105,931
Salary/wage: $33,297 (reported on 88.3% of returns)
Here:
$33,297
State:
$83,540
(% of AGI for various income ranges: 1192.9% for AGIs below $25k, 3624.8% for AGIs $25k-50k, 6755.4% for AGIs $50k-75k, 10069.5% for AGIs $75k-100k, 16292.5% for AGIs $100k-200k)
Taxable interest for individuals: $543 (reported on 8.7% of returns)
This zip code:
$543
Connecticut:
$3,402
(% of AGI for various income ranges: 3.9% for AGIs below $25k, 3.0% for AGIs $25k-50k, 4.8% for AGIs $50k-75k, 12.5% for AGIs $75k-100k, 20.0% for AGIs $100k-200k)
Ordinary dividends: $1,992 (reported on 4.0% of returns)
Here:
$1,992
State:
$12,683
(% of AGI for various income ranges: 4.0% for AGIs below $25k, 4.5% for AGIs $25k-50k, 5.7% for AGIs $50k-75k, 69.0% for AGIs $75k-100k, 50.8% for AGIs $100k-200k)
Net capital gain/loss in AGI: +$8,292 (reported on 3.7% of returns)
Here:
+$8,292
State:
+$44,158
(% of AGI for various income ranges: 3.1% for AGIs below $25k, 8.0% for AGIs $25k-50k, 12.5% for AGIs $50k-75k, 48.5% for AGIs $75k-100k, 184.2% for AGIs $100k-200k)
Profit/loss from business: +$6,013 (reported on 13.8% of returns)
Here:
+$6,013
State:
+$22,988
(% of AGI for various income ranges: 99.5% for AGIs below $25k, 48.7% for AGIs $25k-50k, 140.8% for AGIs $50k-75k, 252.0% for AGIs $75k-100k, 507.5% for AGIs $100k-200k)
Taxable individual retirement arrangement distribution: $10,608 (reported on 2.0% of returns)
06519:
$10,608
Connecticut:
$22,031
(% of AGI for various income ranges: 9.8% for AGIs below $25k, 17.3% for AGIs $25k-50k, 85.6% for AGIs $50k-75k, 252.5% for AGIs $100k-200k)
Total itemized deductions: $26,511 (reported on 2.9% of returns)
Here:
$26,511
State:
$37,613
(% of AGI for various income ranges: 78.4% for AGIs $25k-50k, 175.1% for AGIs $50k-75k, 471.5% for AGIs $75k-100k, 737.5% for AGIs $100k-200k)
Charity contributions: $8,136 (reported on 2.2% of returns)
Here:
$8,136
State:
$13,557
(% of AGI for various income ranges: 11.4% for AGIs $25k-50k, 20.2% for AGIs $50k-75k, 111.5% for AGIs $75k-100k, 493.3% for AGIs $100k-200k)
Taxes paid: $7,237 (reported on 2.9% of returns)
06519:
$7,237
State:
$9,096
(% of AGI for various income ranges: 14.0% for AGIs $25k-50k, 44.9% for AGIs $50k-75k, 148.0% for AGIs $75k-100k, 288.3% for AGIs $100k-200k)
Earned income credit: $2,482 (reported on 32.0% of returns)
Here:
$2,482
State:
$2,059
(% of AGI for various income ranges: 136.4% for AGIs below $25k, 95.3% for AGIs $25k-50k)
Percentage of individuals using paid preparers for their 2020 taxes: 92.9%
Here:
93%
State:
93%
(% for various income ranges: 91.6% for AGIs below $25k, 94.3% for AGIs $25k-50k, 93.5% for AGIs $50k-75k, 92.9% for AGIs $75k-100k, 94.4% for AGIs $100k-200k, 100.0% for AGIs over 200k)
Averages for the 2012 tax year for zip code 06519, filed in 2013:
Average Adjusted Gross Income (AGI) in 2012: $27,570 (Individual Income Tax Returns)
Here:
$27,570
State:
$93,290
Salary/wage: $26,249 (reported on 89.8% of returns)
Here:
$26,249
State:
$73,117
(% of AGI for various income ranges: 83.6% for AGIs below $25k, 91.9% for AGIs $25k-50k, 89.8% for AGIs $50k-75k, 82.2% for AGIs $75k-100k, 66.3% for AGIs $100k-200k)
Taxable interest for individuals: $710 (reported on 12.6% of returns)
This zip code:
$710
Connecticut:
$2,530
(% of AGI for various income ranges: 0.2% for AGIs below $25k, 0.1% for AGIs $25k-50k, 0.2% for AGIs $50k-75k, 1.6% for AGIs $75k-100k, 0.6% for AGIs $100k-200k)
Ordinary dividends: $2,461 (reported on 3.8% of returns)
Here:
$2,461
State:
$10,909
(% of AGI for various income ranges: 0.3% for AGIs below $25k, 0.3% for AGIs $25k-50k, 0.8% for AGIs $75k-100k, 0.6% for AGIs $100k-200k)
Net capital gain/loss in AGI: +$175 (reported on 2.0% of returns)
Here:
+$175
State:
+$34,090
(% of AGI for various income ranges: 0.1% for AGIs $100k-200k)
Profit/loss from business: +$8,239 (reported on 10.0% of returns)
Here:
+$8,239
State:
+$22,741
(% of AGI for various income ranges: 5.7% for AGIs below $25k, 0.9% for AGIs $25k-50k, 1.6% for AGIs $50k-75k, 7.0% for AGIs $100k-200k)
Taxable individual retirement arrangement distribution: $9,788 (reported on 2.8% of returns)
06519:
$9,788
Connecticut:
$19,976
(% of AGI for various income ranges: 0.6% for AGIs below $25k, 0.5% for AGIs $25k-50k, 1.7% for AGIs $50k-75k, 3.1% for AGIs $100k-200k)
Total itemized deductions: $17,553 (29% of AGI, reported on 12.5% of returns)
Here:
$17,553
State:
$33,239
Here:
28.7% of AGI
State:
18.9% of AGI
(% of AGI for various income ranges: 3.7% for AGIs below $25k, 7.3% for AGIs $25k-50k, 9.5% for AGIs $50k-75k, 14.2% for AGIs $75k-100k, 13.5% for AGIs $100k-200k)
Charity contributions: $3,373 (reported on 8.5% of returns)
Here:
$3,373
State:
$4,947
(% of AGI for various income ranges: 0.3% for AGIs below $25k, 0.7% for AGIs $25k-50k, 1.4% for AGIs $50k-75k, 2.8% for AGIs $75k-100k, 2.2% for AGIs $100k-200k)
Taxes paid: $6,157 (reported on 11.5% of returns)
06519:
$6,157
State:
$17,397
(% of AGI for various income ranges: 0.8% for AGIs below $25k, 1.6% for AGIs $25k-50k, 3.3% for AGIs $50k-75k, 5.3% for AGIs $75k-100k, 7.0% for AGIs $100k-200k)
Earned income credit: $2,567 (reported on 39.2% of returns)
Here:
$2,567
State:
$2,053
(% of AGI for various income ranges: 11.0% for AGIs below $25k, 1.7% for AGIs $25k-50k)
Percentage of individuals using paid preparers for their 2012 taxes: 50.1%
Here:
50%
State:
55%
(% for various income ranges: 46.5% for AGIs below $25k, 51.7% for AGIs $25k-50k, 60.4% for AGIs $50k-75k, 66.7% for AGIs $75k-100k, 69.2% for AGIs $100k-200k)
Averages for the 2004 tax year for zip code 06519, filed in 2005:
Average Adjusted Gross Income (AGI) in 2004: $24,622 (Individual Income Tax Returns)
Here:
$24,622
State:
$73,265
Salary/wage: $24,046 (reported on 91.9% of returns)
Here:
$24,046
State:
$62,030
(% of AGI for various income ranges: 92.1% for AGIs below $10k, 90.7% for AGIs $10k-25k, 94.3% for AGIs $25k-50k, 91.6% for AGIs $50k-75k, 86.6% for AGIs $75k-100k, 66.6% for AGIs over 100k)
Taxable interest for individuals: $699 (reported on 18.2% of returns)
This zip code:
$699
Connecticut:
$2,287
(% of AGI for various income ranges: 1.2% for AGIs below $10k, 0.5% for AGIs $10k-25k, 0.3% for AGIs $25k-50k, 0.6% for AGIs $50k-75k, 0.4% for AGIs $75k-100k, 1.1% for AGIs over 100k)
Taxable dividends: $1,704 (reported on 5.1% of returns)
Here:
$1,704
State:
$5,735
(% of AGI for various income ranges: 0.5% for AGIs below $10k, 0.4% for AGIs $10k-25k, 0.2% for AGIs $25k-50k, 0.4% for AGIs $50k-75k, 0.1% for AGIs $75k-100k, 0.9% for AGIs over 100k)
Net capital gain/loss: +$5,725 (reported on 3.6% of returns)
Here:
+$5,725
State:
+$23,694
(% of AGI for various income ranges: -0.3% for AGIs below $10k, -0.0% for AGIs $10k-25k, 0.2% for AGIs $25k-50k, 1.0% for AGIs $50k-75k, 1.9% for AGIs $75k-100k, 5.5% for AGIs over 100k)
Profit/loss from business: +$4,734 (reported on 7.2% of returns)
Here:
+$4,734
State:
+$20,783
(% of AGI for various income ranges: 1.2% for AGIs below $10k, 2.9% for AGIs $10k-25k, 1.2% for AGIs $25k-50k, 0.7% for AGIs $50k-75k, 0.3% for AGIs $75k-100k, 0.0% for AGIs over 100k)
IRA payment deduction: $2,569 (reported on 1.2% of returns)
06519:
$2,569
Connecticut:
$3,216
Total itemized deductions: $14,705 (26% of AGI, reported on 13.0% of returns)
Here:
$14,705
State:
$24,919
Here:
26.1% of AGI
State:
18.6% of AGI
(% of AGI for various income ranges: 3.2% for AGIs below $10k, 3.7% for AGIs $10k-25k, 6.4% for AGIs $25k-50k, 11.7% for AGIs $50k-75k, 13.8% for AGIs $75k-100k, 15.2% for AGIs over 100k)
Charity contributions deductions: $3,082 (5% of AGI, reported on 11.1% of returns)
Here:
$3,082
State:
$3,762
Here:
5.2% of AGI
State:
2.7% of AGI
(% of AGI for various income ranges: 0.2% for AGIs below $10k, 0.4% for AGIs $10k-25k, 1.2% for AGIs $25k-50k, 2.4% for AGIs $50k-75k, 2.9% for AGIs $75k-100k, 2.4% for AGIs over 100k)
Total tax: $3,163 (reported on 52.5% of returns)
06519:
$3,163
State:
$15,148
(% of AGI for various income ranges: 1.3% for AGIs below $10k, 2.6% for AGIs $10k-25k, 5.7% for AGIs $25k-50k, 9.5% for AGIs $50k-75k, 11.3% for AGIs $75k-100k, 17.0% for AGIs over 100k)
Earned income credit: $1,975 (reported on 40.9% of returns)
Here:
$1,975
State:
$1,570
Percentage of individuals using paid preparers for their 2004 taxes: 67.9%
Here:
68%
State:
59%
(% for various income ranges: 63.1% for AGIs below $10k, 70.2% for AGIs $10k-25k, 68.1% for AGIs $25k-50k, 71.7% for AGIs $50k-75k, 70.7% for AGIs $75k-100k, 74.0% for AGIs over 100k)
Household received Food Stamps/SNAP in the past 12 months: 2,305 Household did not receive Food Stamps/SNAP in the past 12 months: 3,422
Women who had a birth in the past 12 months: 184 (108 now married, 79 unmarried) Women who did not have a birth in the past 12 months: 4,473 (1,311 now married, 3,189 unmarried)
Housing units in zip code 06519 with a mortgage: 977 (172 second mortgage, 118 both second mortgage and home equity loan) Houses without a mortgage: 21
Median monthly owner costs for units with a mortgage: $1,994 Median monthly owner costs for units without a mortgage: $820
Residents with income below the poverty level in 2022:
This zip code:
29.7%
Whole state:
9.8%
Residents with income below 50% of the poverty level in 2022:
This zip code:
15.5%
Whole state:
4.8%
Median number of rooms in houses and condos:
Here:
5.3
State:
6.5
Median number of rooms in apartments:
Here:
4.4
State:
4.0
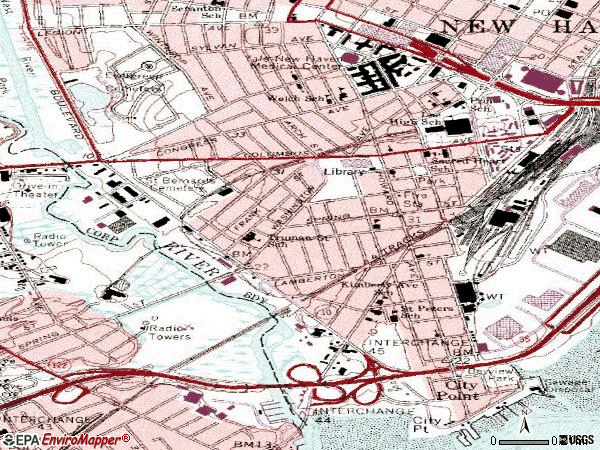
Notable locations in this zip code not listed on our city pages
Notable locations in zip code 06519: New Haven Long Whorf (A), Union Station (B), Bell Dock (C), Lippard Building (D), Lauder Building (E), Jewish Home for the Aged (F), Jewish Historical Society Building (G), Hunter Building (H), Hope Building (I), Fitkin Building (J), Farnam Wing (K), Davenport Public Library (L), Cushing-Whitney Library (M), Connecticut Mental Health Center Library (N), Connecticut Mental Health Center (O), Bradley Building (P), Boys and Girls Club (Q), Boyer Building (R), Boardman Building (S), Yale Physicians Building (T). Display/hide their locations on the map
Churches in zip code 06519 include: Mount Zion Pentecostal Church (A), Resurrection Lutheran Church (B), Saint Anthony Roman Catholic Church (C), Shekinah Glory Apostolic Church (D), Varick African Methodist Episcopal Zion Church (E), Walk of Faith Church (F), Bienvenota Iglesias (G), Church of the Sacred Heart (H), Iglesia Cristiana (I). Display/hide their locations on the map
Parks in zip code 06519 include: Bayview Park (1), Washington Playgrounds (2), Trowbridge Square Historic District (3), Spireworth Park (4), Oyster Point Historic District (5), Howard Avenue Historic District (6), Kimberly Playgrounds (7). Display/hide their locations on the map
1,939 married couples with children.
2,278 single-parent households (346 men, 1,932 women).
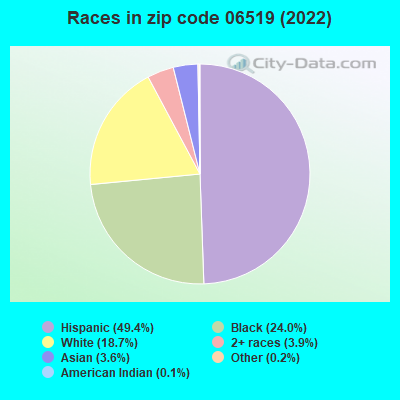
45.4% of residents of 06519 zip code speak English at home.
44.4% of residents speak Spanish at home (51% very well, 15% well, 17% not well, 17% not at all).
5.9% of residents speak other Indo-European language at home (41% very well, 13% well, 33% not well, 14% not at all).
0.6% of residents speak Asian or Pacific Island language at home (91% very well, 9% well).
5.0% of residents speak other language at home (59% very well, 7% well, 31% not well, 3% not at all).
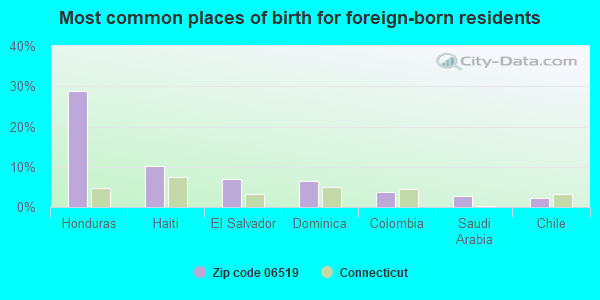
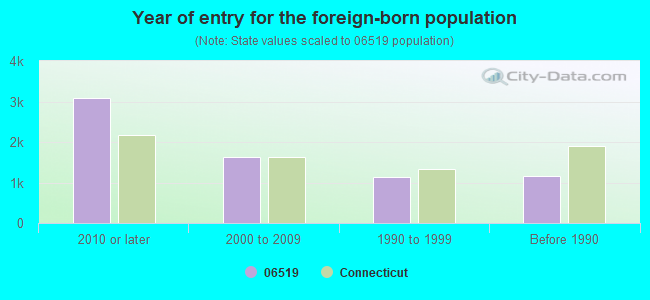
Foreign born population: 4,817 (29.9%) (26.5% of them are naturalized citizens)
Facilities with environmental interests located in this zip code:
AMTRAK GENERAL MAINTENANCE FACILITY (186 HALLOCK AVENUE in NEW HAVEN, CT)
AIR MINOR (AIRS/AFS) SUPERFUND (Superfund database) COMPLIANCE ACTIVITY (Tracking inspections of insecticide, fungicide, and rodenticide, and toxic substances) CRITERIA AND HAZARDOUS AIR POLLUTANT INVENTORY (Inventory of air pollution sources) HAZARDOUS WASTE BIENNIAL REPORTER (Resource Conservation and Recovery Act (tracking hazardous waste)) (Resource Conservation and Recovery Act (tracking hazardous waste)) Business SIC classification: RAILROADS, LINE-HAUL OPERATING Business NAICS classification: LINE-HAUL RAILROADS. Organizations: NATIONAL RAILROAD PASSENGER CORPORATION (CONTACT/OWNER)
Alternative names: AMTRAK ENG MAINTENANCE FACIL, AMTRAK ENG. MAINTENANCE FACILI, AMTRAK NATIONAL RAILROAD PASSENGER COrporation, AMTRSCK-NAT. R.R. PASSENGER CORP., NATIONAL RAILROAD PASSENGER CORP
CLEMENTE MIDDLE SCHOOL (360 COLUMBUS AVENUE in NEW HAVEN, CT)
(Geographic Names Information System) (National Center for Education Statistics) - STATE ID-58 Organizations: NEW HAVEN SCHOOL DISTRICT (SCHOOL DISTRICT)
HILL CENTRAL SCHOOL (140 DEWITT STREET in NEW HAVEN, CT)
(Geographic Names Information System) (National Center for Education Statistics) - STATE ID-7 Organizations: NEW HAVEN SCHOOL DISTRICT (SCHOOL DISTRICT)
COLLINS TIRES (4 ORCHARD ST in NEW HAVEN, CT)
(Integrated Compliance Information System) - ICIS-HQ-2000-0026, FORMAL ENFORCEMENT ACTION Business SIC classification: GASOLINE SERVICE STATIONS; AUTOMOTIVE SERVICES, EXCEPT REPAIR AND CARWASHES
ALS FURNITURE RESTORERS (425 ELLA GRASSO BLVD in NEW HAVEN, CT)
(Resource Conservation and Recovery Act (tracking hazardous waste)) Organizations: ALEX ZHITNITSKY (CONTACT/OWNER)
BENEVENTO BROTHERS INC (44 SPRING ST in NEW HAVEN, CT)
(Resource Conservation and Recovery Act (tracking hazardous waste))
CONTINENTAL GARAGE INC (209 DAVENPORT AVE in NEW HAVEN, CT)
(Resource Conservation and Recovery Act (tracking hazardous waste)) Organizations: JOSEPH MINNOLLI (CONTACT/OWNER)
ATLAS PAINTING & SHEETING CORP (2 UNION AVE in NEW HAVEN, CT)
Large Quantity Generators, more that 1000 kg of hazardous waste/month (Resource Conservation and Recovery Act (tracking hazardous waste))
CONN MENTAL HEALTH CENTER (34 PARK ST in NEW HAVEN, CT)
AIR MINOR (AIRS/AFS) Business SIC classification: PSYCHIATRIC HOSPITALS
CONRAIL CEDERHILL YARD (54 MEADOW ST in NEW HAVEN, CT)
Conditionally Exempt Small Quantity Generators, less than 100 kg/month of hazardous waste (Resource Conservation and Recovery Act (tracking hazardous waste)) Organizations: CSX TRANSPORTATION (CONTACT/OWNER)
CATAPANO AUTO BODY (267 KIMBERLY AVE in NEW HAVEN, CT)
Conditionally Exempt Small Quantity Generators, less than 100 kg/month of hazardous waste (Resource Conservation and Recovery Act (tracking hazardous waste)) - notification Organizations: CATAPANO BROS INC (CONTACT/OWNER)
CLARKSON CO INC THE (354-358 DAVENPORT AVE in NEW HAVEN, CT)
Conditionally Exempt Small Quantity Generators, less than 100 kg/month of hazardous waste (Resource Conservation and Recovery Act (tracking hazardous waste)) - notification Organizations: CHARLES VACCA (CONTACT/OWNER)
COLUMBUS AUTO BODY (487 COLUMBUS AVE in NEW HAVEN, CT)
Small Quantity Generators, between 100 kg and 1000 kg of hazardous waste/month (Resource Conservation and Recovery Act (tracking hazardous waste)) - notification Organizations: DI LAURO REALTOR (CONTACT/OWNER)
Housing units lacking complete plumbing facilities: 0.6% Housing units lacking complete kitchen facilities: 0.7%
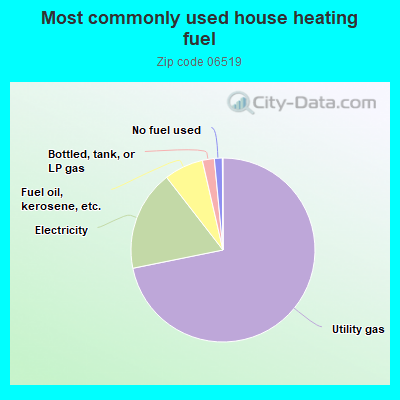
71.9%Utility gas
17.7%Electricity
6.9%Fuel oil, kerosene, etc.
2.1%Bottled, tank, or LP gas
1.4%No fuel used
Population in 1990: 19,410.
Place of birth for U.S.-born residents:
This state: 6,633
Northeast: 1,744
Midwest: 37
South: 836
West: 137
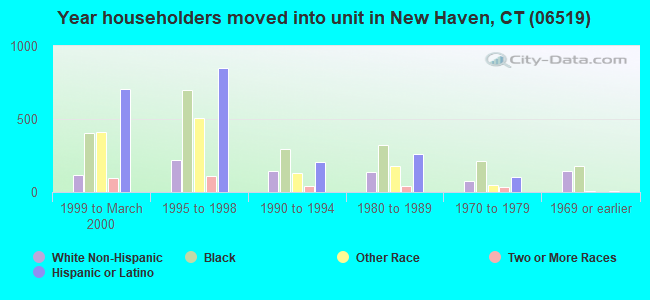
52% of the 06519 zip code residents lived in the same house 5 years ago. Out of people who lived in different houses, 81% lived in this county. Out of people who lived in different counties, 50% lived in Connecticut.
85% of the 06519 zip code residents lived in the same house 1 year ago. Out of people who lived in different houses, 45% moved from this county. Out of people who lived in different houses, 13% moved from different county within same state. Out of people who lived in different houses, 29% moved from different state. Out of people who lived in different houses, 11% moved from abroad.
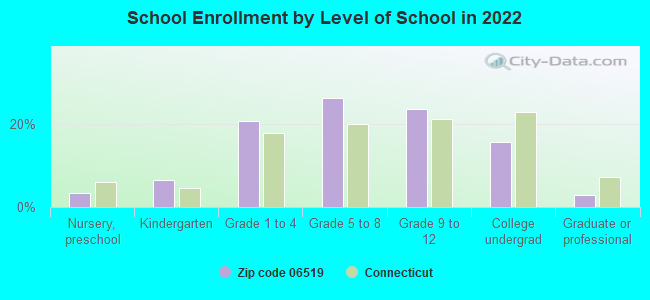
Private vs. public school enrollment:
Students in private schools in grades 1 to 8 (elementary and middle school): 20
Here:
0.9%
Connecticut:
9.5%
Students in private schools in grades 9 to 12 (high school): 47
Here:
4.3%
Connecticut:
12.9%
Students in private undergraduate colleges: 168
Here:
22.8%
Connecticut:
35.5%
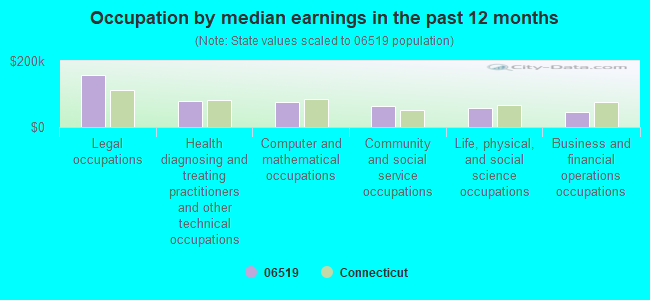
Occupation by median earnings in the past 12 months ($)
156,202Legal occupations
77,808Health diagnosing and treating practitioners and other technical occupations
74,537Computer and mathematical occupations
63,166Community and social service occupations
56,273Life, physical, and social science occupations
45,532Business and financial operations occupations
Companies with federal contracts located in this zip code:
RUOTOLO PLUMBING & HEATING (29 PRINTERS LANE in NEW HAVEN, CT; small business) : $19,075 in 5 contractsfrom 2002 to 2003
Contracts for Maintenance, Repair or Alteration of Real Property -- Other Non-Building Facilities, Maintenance, Repair or Alteration of Real Property -- Other Administrative Facilities and Service Buildings by United States Coast Guard (disused code: now 7008), U.S. Coast Guard Signed by year:2000: $0; 2001: $0; 2002: $19,075; 2003: $0; 2004: $0; 2005: $0; 2006: $0.
Biggest contracts:
$8,075 with United States Coast Guard (disused code: now 7008) for Maintenance, Repair or Alteration of Real Property -- Other Non-Building Facilities. Signed on 2002-12-15. Completion date: 2003-04-15.
$6,000, same as above.Signed on 2002-10-15. Completion date: 2002-12-15.
$5,000 with United States Coast Guard (disused code: now 7008) for Maintenance, Repair or Alteration of Real Property -- Other Administrative Facilities and Service Buildings. Signed on 2002-03-15. Completion date: 2002-06-15.
$0 with U.S. Coast Guard for Maintenance, Repair or Alteration of Real Property -- Other Non-Building Facilities. Signed on 2003-12-10. Effective on 2003-12-22. Completion date: 2003-12-22.
SUPREME CORP (410 ELLA T GRASSO BLVD in NEW HAVEN, CT; small business) : $6,130 in 6 contractsfrom 2002 to 2006
Contracts for Specialized Shipping and Storage Containers, Lease or Rental of Equipment -- Containers, Packaging, and Packing Supplies, Telephone and/or Communications Services (includes Telegraph, Telex, and Cablevision Services), Lease or Rental of Equipment -- Ground Effect Vehicles, Motor Vehicles, Trailers, and Cycles by Army Signed by year:2000: $0; 2001: $0; 2002: $660; 2003: $660; 2004: $660; 2005: $550; 2006: $3,600.
Biggest contracts:
$3,600 with Army for Specialized Shipping and Storage Containers. Signed on 2006-03-30. Completion date: 2006-04-04.
$660 with Army for Lease or Rental of Equipment -- Containers, Packaging, and Packing Supplies. Signed on 2005-10-07. Completion date: 2006-09-30.
$660 with Army for Telephone and/or Communications Services (includes Telegraph, Telex, and Cablevision Services). Signed on 2004-10-01. Completion date: 2005-09-30.
$660 with Army for Lease or Rental of Equipment -- Containers, Packaging, and Packing Supplies. Signed on 2003-10-03. Completion date: 2004-09-30.
Top industries in this zip code by the number of employees in 2005:
Health Care and Social Assistance: Nursing Care Facilities (250-499 employees: 1 establishment, 100-249 employees: 1 establishment)
Health Care and Social Assistance: Psychiatric and Substance Abuse Hospitals (250-499: 1)
Health Care and Social Assistance: All Other Outpatient Care Centers (100-249: 1, 20-49: 1, 5-9: 1, 1-4: 4)
Health Care and Social Assistance: Temporary Shelters (100-249: 1, 20-49: 1)
Health Care and Social Assistance: Offices of Physicians (except Mental Health Specialists) (20-49: 1, 10-19: 4, 5-9: 5, 1-4: 22)
Finance and Insurance: Direct Property and Casualty Insurance Carriers (100-249: 1)
Health Care and Social Assistance: Outpatient Mental Health and Substance Abuse Centers (20-49: 1, 10-19: 2, 5-9: 1, 1-4: 2)
Wholesale Trade: Automobile and Other Motor Vehicle Merchant Wholesalers (50-99: 1)
2004 - 2018 National Fire Incident Reporting System (NFIRS) incidents
According to the data from the years 2004 - 2018 the average number of fires per year is 25. The highest number of fires - 60 took place in 2007, and the least - 0 in 2014. The data has a growing trend.
When looking into fire subcategories, the most reports belonged to: Structure Fires (45.3%), and Outside Fires (27.9%).
Fire incident types reported to NFIRS in Zip Code 06519


 Nearest zip codes: 06510, 06511, 06516, 06515, 06512, 06517.
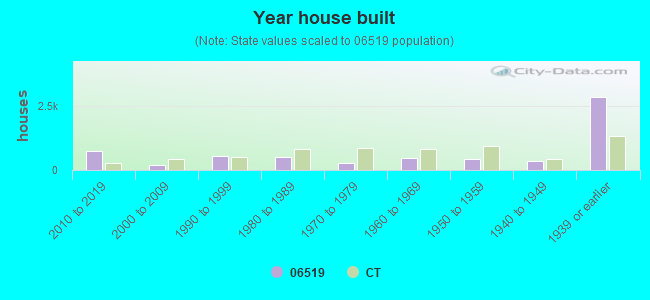


 According to the data from the years 2004 - 2018 the average number of fires per year is 25. The highest number of fires - 60 took place in 2007, and the least - 0 in 2014. The data has a growing trend.
 When looking into fire subcategories, the most reports belonged to: Structure Fires (45.3%), and Outside Fires (27.9%).