Estimated zip code population in 2022: 6,147 Zip code population in 2010: 5,599 Zip code population in 2000: 5,589
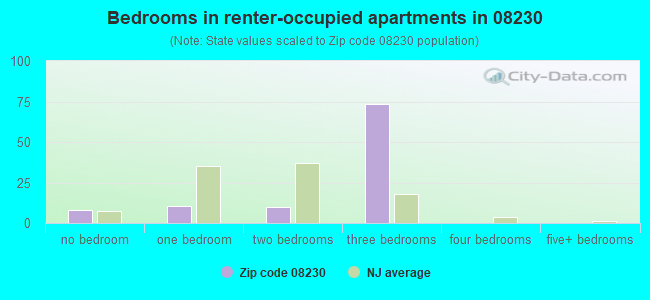
Houses and condos: 2,720 Renter-occupied apartments: 104
% of renters here:
4%
State:
35%
March 2022 cost of living index in zip code 08230: 102.3 (near average, U.S. average is 100)
Land area: 12.6 sq. mi. Water area: 0.2 sq. mi.
Population density: 489 people per square mile
(low).
OSM Map
Google Map
MSN Map
OSM Map
General Map
Google Map
MSN Map
OSM Map
Google Map
MSN Map
OSM Map
Google Map
MSN Map
Please wait while loading the map...
Real estate property taxes paid for housing units in 2022:
This zip code:
1.4% ($5,814)
New Jersey:
2.1% ($8,897)
Median real estate property taxes paid for housing units with mortgages in 2022: $5,769 (1.3%) Median real estate property taxes paid for housing units with no mortgage in 2022: $5,894 (1.6%)
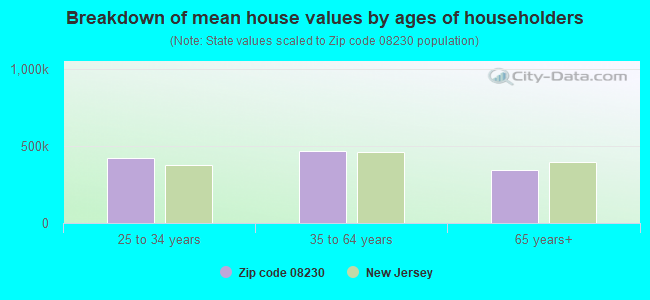
Estimated median house/condo value in 2022: $419,925
08230:
$419,925
New Jersey:
$428,900
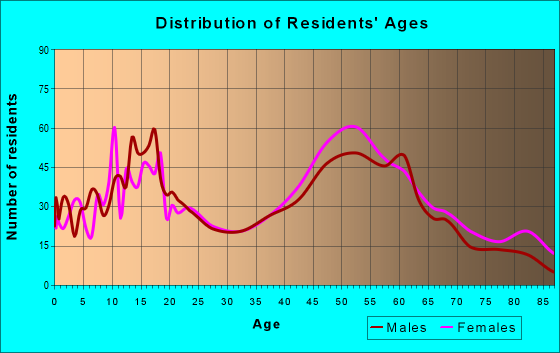
Median resident age:
This zip code:
45.7 years
New Jersey median age:
40.4 years
Average household size:
This zip code:
2.6 people
New Jersey:
2.6 people
Averages for the 2020 tax year for zip code 08230, filed in 2021:
Average Adjusted Gross Income (AGI) in 2020: $87,049 (Individual Income Tax Returns)
Here:
$87,049
State:
$95,247
Salary/wage: $68,355 (reported on 76.9% of returns)
Here:
$68,355
State:
$80,635
(% of AGI for various income ranges: 1252.7% for AGIs below $25k, 3532.3% for AGIs $25k-50k, 6117.7% for AGIs $50k-75k, 8481.0% for AGIs $75k-100k, 18153.5% for AGIs $100k-200k, 88456.0% for AGIs over 200k)
Taxable interest for individuals: $1,725 (reported on 39.1% of returns)
This zip code:
$1,725
New Jersey:
$2,414
(% of AGI for various income ranges: 22.7% for AGIs below $25k, 32.3% for AGIs $25k-50k, 73.1% for AGIs $50k-75k, 90.0% for AGIs $75k-100k, 178.4% for AGIs $100k-200k, 1678.0% for AGIs over 200k)
Ordinary dividends: $4,827 (reported on 30.4% of returns)
Here:
$4,827
State:
$8,057
(% of AGI for various income ranges: 68.1% for AGIs below $25k, 99.7% for AGIs $25k-50k, 181.2% for AGIs $50k-75k, 298.0% for AGIs $75k-100k, 483.0% for AGIs $100k-200k, 2032.0% for AGIs over 200k)
Net capital gain/loss in AGI: +$11,289 (reported on 26.6% of returns)
Here:
+$11,289
State:
+$25,022
(% of AGI for various income ranges: 37.7% for AGIs below $25k, 55.1% for AGIs $25k-50k, 115.0% for AGIs $50k-75k, 237.5% for AGIs $75k-100k, 538.9% for AGIs $100k-200k, 12412.0% for AGIs over 200k)
Profit/loss from business: +$36,015 (reported on 17.0% of returns)
Here:
+$36,015
State:
+$18,035
(% of AGI for various income ranges: 79.0% for AGIs below $25k, 241.8% for AGIs $25k-50k, 501.9% for AGIs $50k-75k, 636.5% for AGIs $75k-100k, 1232.2% for AGIs $100k-200k, 21258.0% for AGIs over 200k)
Taxable individual retirement arrangement distribution: $18,780 (reported on 14.4% of returns)
08230:
$18,780
New Jersey:
$21,558
(% of AGI for various income ranges: 84.2% for AGIs below $25k, 240.8% for AGIs $25k-50k, 395.4% for AGIs $50k-75k, 772.0% for AGIs $75k-100k, 719.2% for AGIs $100k-200k, 3750.0% for AGIs over 200k)
Self-employed (Keogh) retirement plans: $18,720 (reported on 1.6% of returns)
08230:
$18,720
New Jersey:
$30,844
(% of AGI for various income ranges: 253.0% for AGIs $100k-200k)
Total itemized deductions: $28,732 (reported on 13.1% of returns)
Here:
$28,732
State:
$32,863
(% of AGI for various income ranges: 125.6% for AGIs below $25k, 278.2% for AGIs $25k-50k, 603.8% for AGIs $50k-75k, 773.0% for AGIs $75k-100k, 1074.9% for AGIs $100k-200k, 5998.0% for AGIs over 200k)
Charity contributions: $5,491 (reported on 10.9% of returns)
Here:
$5,491
State:
$7,880
(% of AGI for various income ranges: 23.6% for AGIs $25k-50k, 50.0% for AGIs $50k-75k, 89.0% for AGIs $75k-100k, 178.6% for AGIs $100k-200k, 1612.0% for AGIs over 200k)
Taxes paid: $8,078 (reported on 13.1% of returns)
08230:
$8,078
State:
$9,183
(% of AGI for various income ranges: 25.8% for AGIs below $25k, 54.4% for AGIs $25k-50k, 180.4% for AGIs $50k-75k, 265.0% for AGIs $75k-100k, 332.7% for AGIs $100k-200k, 1492.0% for AGIs over 200k)
Earned income credit: $1,662 (reported on 6.7% of returns)
Here:
$1,662
State:
$2,148
(% of AGI for various income ranges: 33.3% for AGIs below $25k, 48.5% for AGIs $25k-50k)
Percentage of individuals using paid preparers for their 2020 taxes: 93.6%
Here:
94%
State:
92%
(% for various income ranges: 91.5% for AGIs below $25k, 94.8% for AGIs $25k-50k, 93.2% for AGIs $50k-75k, 94.3% for AGIs $75k-100k, 94.4% for AGIs $100k-200k, 95.2% for AGIs over 200k)
Averages for the 2012 tax year for zip code 08230, filed in 2013:
Average Adjusted Gross Income (AGI) in 2012: $67,781 (Individual Income Tax Returns)
Here:
$67,781
State:
$79,688
Salary/wage: $55,141 (reported on 81.2% of returns)
Here:
$55,141
State:
$68,122
(% of AGI for various income ranges: 69.2% for AGIs below $25k, 65.5% for AGIs $25k-50k, 66.0% for AGIs $50k-75k, 66.1% for AGIs $75k-100k, 74.0% for AGIs $100k-200k, 53.5% for AGIs over 200k)
Taxable interest for individuals: $1,580 (reported on 45.5% of returns)
This zip code:
$1,580
New Jersey:
$2,193
(% of AGI for various income ranges: 2.0% for AGIs below $25k, 1.6% for AGIs $25k-50k, 1.3% for AGIs $50k-75k, 0.5% for AGIs $75k-100k, 0.8% for AGIs $100k-200k, 1.2% for AGIs over 200k)
Ordinary dividends: $4,573 (reported on 31.0% of returns)
Here:
$4,573
State:
$6,828
(% of AGI for various income ranges: 3.3% for AGIs below $25k, 1.7% for AGIs $25k-50k, 2.4% for AGIs $50k-75k, 1.2% for AGIs $75k-100k, 1.2% for AGIs $100k-200k, 3.8% for AGIs over 200k)
Net capital gain/loss in AGI: +$6,215 (reported on 22.4% of returns)
Here:
+$6,215
State:
+$15,358
(% of AGI for various income ranges: 0.7% for AGIs $75k-100k, 0.9% for AGIs $100k-200k, 7.5% for AGIs over 200k)
Profit/loss from business: +$28,840 (reported on 15.8% of returns)
Here:
+$28,840
State:
+$19,577
(% of AGI for various income ranges: 5.0% for AGIs below $25k, 5.0% for AGIs $25k-50k, 5.4% for AGIs $50k-75k, 4.8% for AGIs $75k-100k, 5.2% for AGIs $100k-200k, 12.3% for AGIs over 200k)
Taxable individual retirement arrangement distribution: $15,119 (reported on 13.9% of returns)
08230:
$15,119
New Jersey:
$18,214
(% of AGI for various income ranges: 4.1% for AGIs below $25k, 3.5% for AGIs $25k-50k, 3.7% for AGIs $50k-75k, 4.2% for AGIs $75k-100k, 2.5% for AGIs $100k-200k, 2.5% for AGIs over 200k)
Self-employment retirement plans: $16,540 (reported on 1.7% of returns)
08230:
$16,540
New Jersey:
$24,511
Total itemized deductions: $23,963 (21% of AGI, reported on 44.9% of returns)
Here:
$23,963
State:
$30,827
Here:
21.1% of AGI
State:
21.2% of AGI
(% of AGI for various income ranges: 15.7% for AGIs below $25k, 14.5% for AGIs $25k-50k, 17.9% for AGIs $50k-75k, 16.5% for AGIs $75k-100k, 16.1% for AGIs $100k-200k, 14.7% for AGIs over 200k)
Charity contributions: $2,569 (reported on 38.6% of returns)
Here:
$2,569
State:
$3,451
(% of AGI for various income ranges: 0.9% for AGIs below $25k, 1.3% for AGIs $25k-50k, 1.6% for AGIs $50k-75k, 1.5% for AGIs $75k-100k, 1.6% for AGIs $100k-200k, 1.4% for AGIs over 200k)
Taxes paid: $10,123 (reported on 44.6% of returns)
08230:
$10,123
State:
$15,801
(% of AGI for various income ranges: 3.9% for AGIs below $25k, 4.3% for AGIs $25k-50k, 6.2% for AGIs $50k-75k, 5.8% for AGIs $75k-100k, 7.3% for AGIs $100k-200k, 8.1% for AGIs over 200k)
Earned income credit: $1,667 (reported on 6.9% of returns)
Here:
$1,667
State:
$2,182
(% of AGI for various income ranges: 2.4% for AGIs below $25k, 0.4% for AGIs $25k-50k)
Percentage of individuals using paid preparers for their 2012 taxes: 62.7%
Here:
63%
State:
65%
(% for various income ranges: 53.8% for AGIs below $25k, 58.2% for AGIs $25k-50k, 64.1% for AGIs $50k-75k, 69.4% for AGIs $75k-100k, 72.2% for AGIs $100k-200k, 92.3% for AGIs over 200k)
Averages for the 2004 tax year for zip code 08230, filed in 2005:
Average Adjusted Gross Income (AGI) in 2004: $64,600 (Individual Income Tax Returns)
Here:
$64,600
State:
$64,921
Salary/wage: $51,347 (reported on 83.7% of returns)
Here:
$51,347
State:
$57,755
(% of AGI for various income ranges: 122.6% for AGIs below $10k, 65.3% for AGIs $10k-25k, 72.4% for AGIs $25k-50k, 77.5% for AGIs $50k-75k, 77.8% for AGIs $75k-100k, 58.4% for AGIs over 100k)
Taxable interest for individuals: $1,393 (reported on 61.4% of returns)
This zip code:
$1,393
New Jersey:
$2,068
(% of AGI for various income ranges: 9.4% for AGIs below $10k, 4.3% for AGIs $10k-25k, 2.4% for AGIs $25k-50k, 1.2% for AGIs $50k-75k, 0.9% for AGIs $75k-100k, 0.9% for AGIs over 100k)
Taxable dividends: $2,276 (reported on 36.7% of returns)
Here:
$2,276
State:
$3,959
(% of AGI for various income ranges: 7.4% for AGIs below $10k, 3.7% for AGIs $10k-25k, 1.9% for AGIs $25k-50k, 1.2% for AGIs $50k-75k, 1.2% for AGIs $75k-100k, 0.9% for AGIs over 100k)
Net capital gain/loss: +$14,810 (reported on 27.4% of returns)
Here:
+$14,810
State:
+$13,591
(% of AGI for various income ranges: -4.8% for AGIs below $10k, -0.6% for AGIs $10k-25k, 0.1% for AGIs $25k-50k, 0.9% for AGIs $50k-75k, 1.7% for AGIs $75k-100k, 11.0% for AGIs over 100k)
Profit/loss from business: +$34,804 (reported on 15.8% of returns)
Here:
+$34,804
State:
+$17,520
(% of AGI for various income ranges: 7.0% for AGIs below $10k, 4.7% for AGIs $10k-25k, 5.9% for AGIs $25k-50k, 3.4% for AGIs $50k-75k, 5.8% for AGIs $75k-100k, 11.5% for AGIs over 100k)
IRA payment deduction: $3,585 (reported on 4.2% of returns)
08230:
$3,585
New Jersey:
$3,270
(% of AGI for various income ranges: 0.4% for AGIs $10k-25k, 0.4% for AGIs $25k-50k, 0.3% for AGIs $50k-75k, 0.2% for AGIs $75k-100k, 0.2% for AGIs over 100k)
Self-employed pension: $16,866 (reported on 2.3% of returns)
Here:
$16,866
New Jersey:
$17,258
Total itemized deductions: $20,210 (19% of AGI, reported on 47.1% of returns)
Here:
$20,210
State:
$23,924
Here:
18.6% of AGI
State:
21.1% of AGI
(% of AGI for various income ranges: 15.6% for AGIs below $10k, 16.3% for AGIs $10k-25k, 15.2% for AGIs $25k-50k, 16.8% for AGIs $50k-75k, 18.5% for AGIs $75k-100k, 12.9% for AGIs over 100k)
Charity contributions deductions: $3,222 (3% of AGI, reported on 43.5% of returns)
Here:
$3,222
State:
$3,242
Here:
2.9% of AGI
State:
2.7% of AGI
(% of AGI for various income ranges: 1.3% for AGIs below $10k, 2.0% for AGIs $10k-25k, 1.5% for AGIs $25k-50k, 1.7% for AGIs $50k-75k, 2.3% for AGIs $75k-100k, 2.4% for AGIs over 100k)
Total tax: $12,072 (reported on 78.6% of returns)
08230:
$12,072
State:
$12,321
(% of AGI for various income ranges: 3.4% for AGIs below $10k, 4.2% for AGIs $10k-25k, 7.7% for AGIs $25k-50k, 9.0% for AGIs $50k-75k, 10.0% for AGIs $75k-100k, 19.9% for AGIs over 100k)
Earned income credit: $1,530 (reported on 5.6% of returns)
Here:
$1,530
State:
$1,711
Percentage of individuals using paid preparers for their 2004 taxes: 63.7%
Here:
64%
State:
65%
(% for various income ranges: 54.2% for AGIs below $10k, 59.3% for AGIs $10k-25k, 66.6% for AGIs $25k-50k, 64.0% for AGIs $50k-75k, 66.5% for AGIs $75k-100k, 74.7% for AGIs over 100k)
Likely homosexual households (counted as self-reported same-sex unmarried-partner households)
Lesbian couples: 0.1% of all households
Gay men: 0.0% of all households
Household received Food Stamps/SNAP in the past 12 months: 35 Household did not receive Food Stamps/SNAP in the past 12 months: 2,282
Women who had a birth in the past 12 months: 81 (83 now married, 0 unmarried) Women who did not have a birth in the past 12 months: 1,001 (572 now married, 425 unmarried)
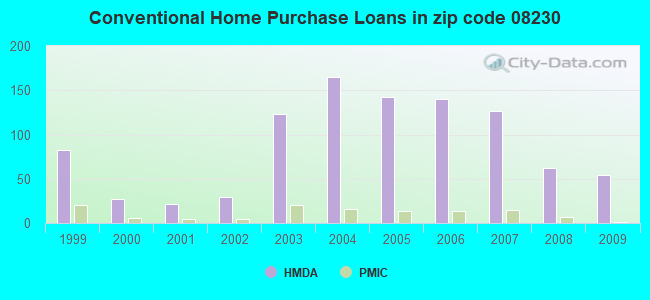
Housing units in zip code 08230 with a mortgage: 1,478 (161 second mortgage, 140 both second mortgage and home equity loan) Houses without a mortgage: 122
Median monthly owner costs for units with a mortgage: $2,182 Median monthly owner costs for units without a mortgage: $897
Residents with income below the poverty level in 2022:
This zip code:
1.6%
Whole state:
9.7%
Residents with income below 50% of the poverty level in 2022:
This zip code:
0.7%
Whole state:
5.2%
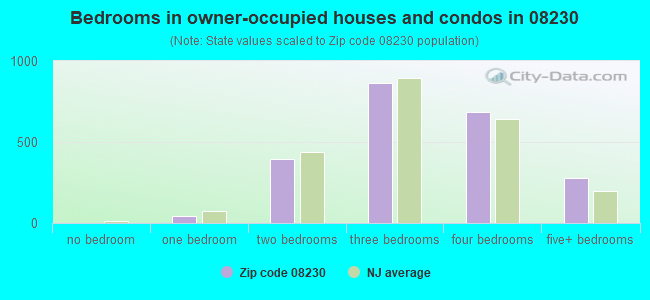
Median number of rooms in houses and condos:
Here:
7.2
State:
6.8
Median number of rooms in apartments:
Here:
6.2
State:
3.9
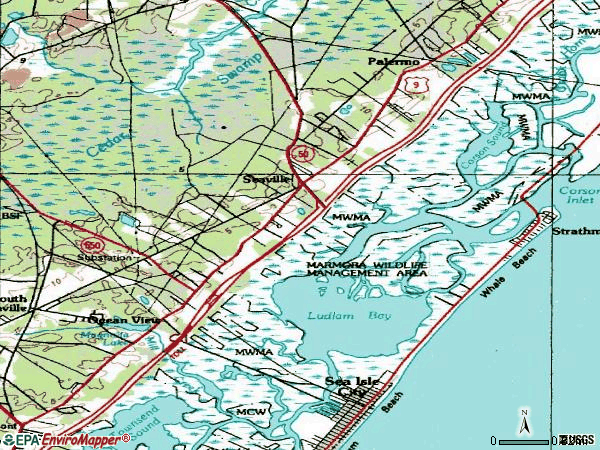
Notable locations in this zip code not listed on our city pages
Notable locations in zip code 08230: Seaville Volunteer Fire and Rescue Company (A), Ocean View Volunteer Fire Department (B). Display/hide their locations on the map
In group quarters: 102 (-1 institutionalized population)
Size of family households: 843 2-persons, 347 3-persons, 433 4-persons, 138 5-persons, 51 6-persons, 46 7-or-more-persons
Size of nonfamily households: 406 1-person, 73 2-persons
1,172 married couples with children.
197 single-parent households (140 men, 57 women).
94.2% of residents of 08230 zip code speak English at home.
1.4% of residents speak Spanish at home (48% very well, 52% well).
2.3% of residents speak other Indo-European language at home (95% very well, 3% well, 2% not well).
2.2% of residents speak Asian or Pacific Island language at home (100% very well).
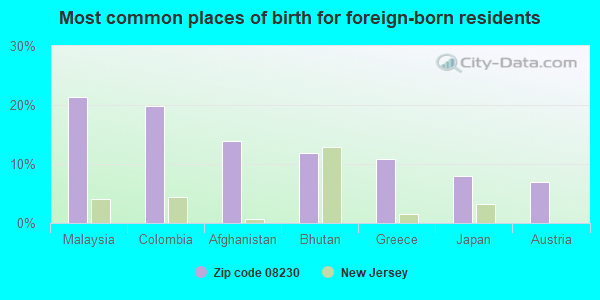
Foreign born population: 203 (3.3%) (91.0% of them are naturalized citizens)
This zip code:
3.3%
Whole state:
23.5%
21%Malaysia
20%Colombia
14%Afghanistan
12%Bhutan
11%Greece
8%Japan
7%Austria
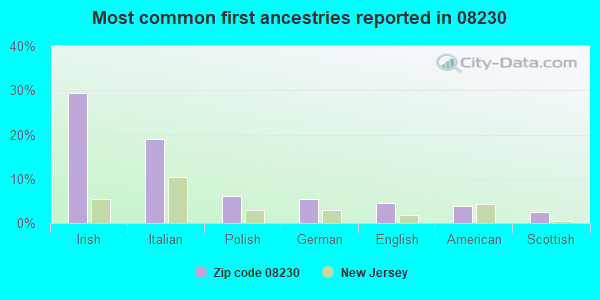
29%Irish
19%Italian
6%Polish
6%German
5%English
4%American
2%Scottish
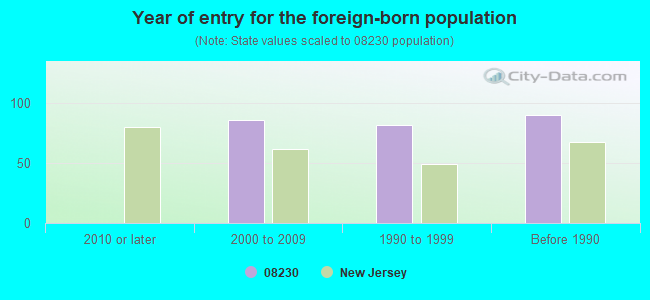
Year of entry for the foreign-born population
02010 or later
862000 to 2009
821990 to 1999
90Before 1990
Facilities with environmental interests located in this zip code:
NJ MARINE SCIENCES CONSORTIUM (1731 S SHORE RD in SEAVILLE, NJ)
(Integrated Compliance Information System) - ICIS-02-1991-0022, FORMAL ENFORCEMENT ACTION COMPLIANCE ACTIVITY (Tracking inspections of insecticide, fungicide, and rodenticide, and toxic substances) STATE MASTER (New Jersey environmental info) - NJEMS-020033, STATE CLEANUP SITE (Resource Conservation and Recovery Act (tracking hazardous waste)) Organizations: NJ MARINE SCIENCES CONORTIUM (CONTACT/OWNER)
Alternative names: NJ MARINE SCIENCES (TO ORC 3/22/91)
ACTION SUPPLY INC (1413 OLD STAGECOACH RD in SEAVILLE, NJ)
AIR SYNTHETIC MINOR (AIRS/AFS) COMPLIANCE ACTIVITY (Tracking inspections of insecticide, fungicide, and rodenticide, and toxic substances) STATE MASTER (New Jersey environmental info) - NJEMS-132071, MATERIAL RECYCLING, NJEMS-201595, REFUSE DISPOSAL, NJEMS-2285P, DRINKING WATER PROGRAM, NJEMS-47948, National Pollutant Discharge Elimination System Permit, NJEMS-73120, AIR PROGRAM National Pollutant Discharge Elimination System NON-MAJOR (Tracking pollutant discharge elimination systems) - permit Business SIC classification: READY-MIXED CONCRETE
ACME MARKETS INCORPORATED (2087 SHORE ROAD in SEAVILLE, NJ)
(Resource Conservation and Recovery Act (tracking hazardous waste))
AMERICAN STORES (2087 SHORE RD in SEAVILLE, NJ)
(Resource Conservation and Recovery Act (tracking hazardous waste))
9 & 50 MOBIL (ROUTE 9 AND ROUTE 50 in UPPERTOWNSHIP, NJ)
ENFORCEMENT/COMPLIANCE ACTIVITY (Integrated Compliance Information System)
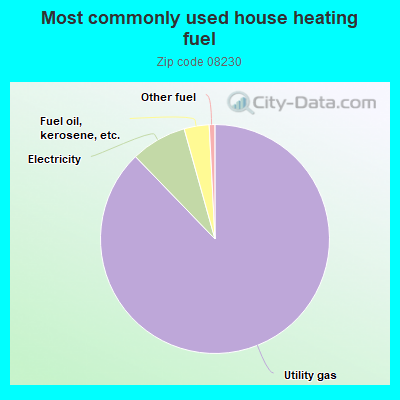
87.0%Utility gas
7.8%Electricity
3.5%Fuel oil, kerosene, etc.
0.8%Other fuel
Population in 1990: 4,443. Population change in the 1990s: +1,146 (+25.8%).
Place of birth for U.S.-born residents:
This state: 3,654
Northeast: 1,703
Midwest: 215
South: 295
West: 6
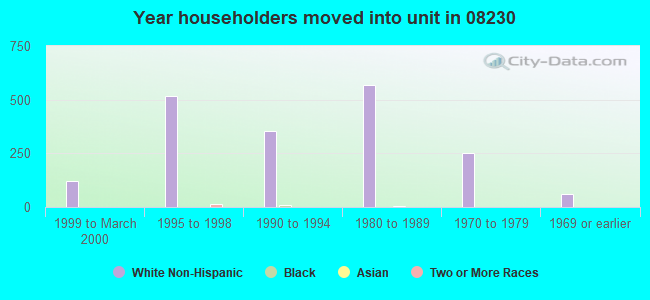
71% of the 08230 zip code residents lived in the same house 5 years ago. Out of people who lived in different houses, 56% lived in this county. Out of people who lived in different counties, 50% lived in New Jersey.
92% of the 08230 zip code residents lived in the same house 1 year ago. Out of people who lived in different houses, 56% moved from this county. Out of people who lived in different houses, 32% moved from different county within same state. Out of people who lived in different houses, 7% moved from different state.
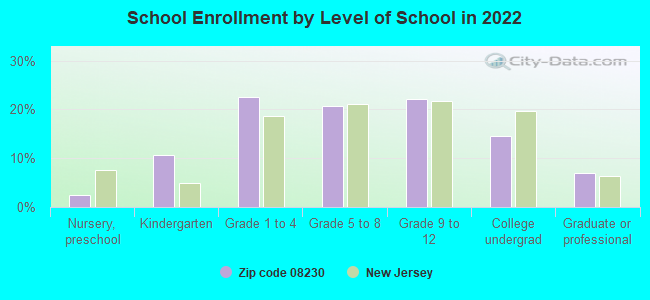
Private vs. public school enrollment:
Students in private schools in grades 1 to 8 (elementary and middle school): 38
Here:
6.0%
New Jersey:
12.3%
Students in private schools in grades 9 to 12 (high school): 47
Here:
14.7%
New Jersey:
13.1%
Students in private undergraduate colleges: 82
Here:
38.3%
New Jersey:
33.2%
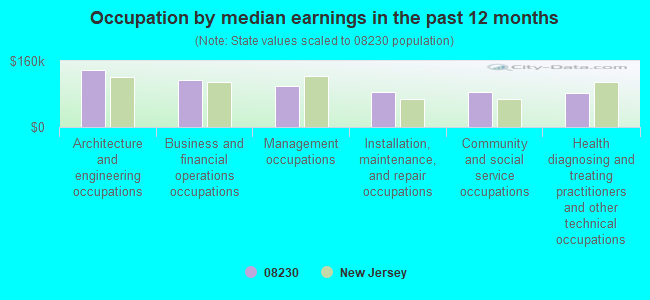
Occupation by median earnings in the past 12 months ($)
138,832Architecture and engineering occupations
114,034Business and financial operations occupations
100,132Management occupations
84,358Installation, maintenance, and repair occupations
83,661Community and social service occupations
81,391Health diagnosing and treating practitioners and other technical occupations
Companies with federal contracts located in this zip code:
KALIMEX INCORPORATED (1300 STAGECOACH ROAD in OCEAN VIEW, NJ; small business) : $12,799,069 in 77 contractsfrom 2001 to 2006
Contracts for Construction of Structures and Facilities -- Dams, Maintenance, Repair or Alteration of Real Property -- Laboratories and Clinics, Maintenance, Repair or Alteration of Real Property -- Other Administrative Facilities and Service Buildings, Maintenance, Repair or Alteration of Real Property -- Other Conservation and Development Facilities, and moreby Army, U.S. Army Corps of Engineers - civil program financing only, U.S. Coast Guard, National Park Service, and others Signed by year:2000: $0; 2001: $118,000; 2002: $0; 2003: $1,147,791; 2004: $7,580,684; 2005: $3,785,157; 2006: $167,437.
Biggest contracts:
$2,929,281 with Army for Construction of Structures and Facilities -- Dams. Taking place in PA. Signed on 2004-03-31. Completion date: 2005-05-16.
$1,416,689 with U.S. Army Corps of Engineers - civil program financing only for Construction of Structures and Facilities -- Dams. Taking place in PA. Signed on 2004-09-02. Completion date: 2005-05-16.
$1,416,689 with Army for Construction of Structures and Facilities -- Dams. Taking place in PA. Signed on 2004-09-02. Completion date: 2005-05-16.
$1,074,710 with Army for Maintenance, Repair or Alteration of Real Property -- Laboratories and Clinics. Taking place in PA. Signed on 2005-08-25. Completion date: 2006-08-02.
Top industries in this zip code by the number of employees in 2005:
Health Care and Social Assistance: Nursing Care Facilities (100-249 employees: 1 establishment, 5-9 employees: 1 establishment)
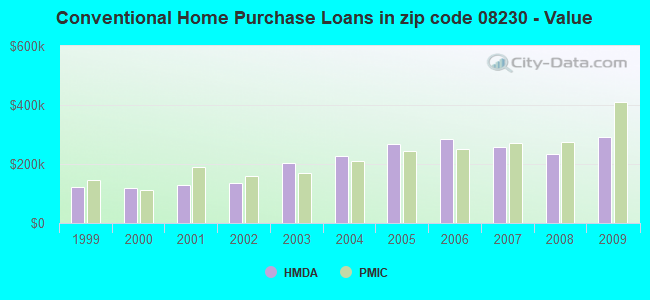
Detailed PMIC statistics for the following Tracts:0203.02
, 0207.00
2003 - 2018 National Fire Incident Reporting System (NFIRS) incidents
According to the data from the years 2003 - 2018 the average number of fires per year is 19. The highest number of reported fire incidents - 35 took place in 2015, and the least - 6 in 2003. The data has a growing trend.
When looking into fire subcategories, the most incidents belonged to: Structure Fires (41.5%), and Outside Fires (28.8%).
Fire incident types reported to NFIRS in Zip Code 08230


 Nearest zip codes: 08246, 08243, 08248, 08270, 08223, 08202.


 According to the data from the years 2003 - 2018 the average number of fires per year is 19. The highest number of reported fire incidents - 35 took place in 2015, and the least - 6 in 2003. The data has a growing trend.
 When looking into fire subcategories, the most incidents belonged to: Structure Fires (41.5%), and Outside Fires (28.8%).