Estimated zip code population in 2022: 5,753 Zip code population in 2010: 5,532 Zip code population in 2000: 5,082
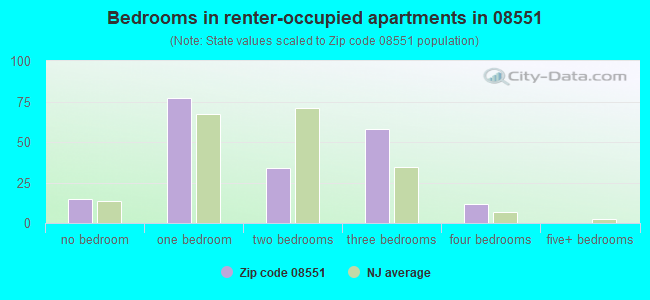
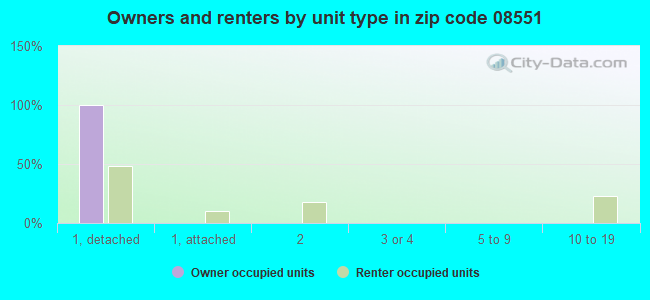
Houses and condos: 2,180 Renter-occupied apartments: 196
% of renters here:
9%
State:
35%
March 2022 cost of living index in zip code 08551: 117.5 (more than average, U.S. average is 100)
Land area: 27.0 sq. mi. Water area: 0.1 sq. mi.
Population density: 213 people per square mile
(very low).
OSM Map
Google Map
MSN Map
OSM Map
General Map
Google Map
MSN Map
OSM Map
Google Map
MSN Map
OSM Map
Google Map
MSN Map
Please wait while loading the map...
Real estate property taxes paid for housing units in 2022:
This zip code:
1.6% ($9,521)
New Jersey:
2.1% ($8,897)
Median real estate property taxes paid for housing units with mortgages in 2022: $9,557 (1.5%) Median real estate property taxes paid for housing units with no mortgage in 2022: $9,002 (2.0%)
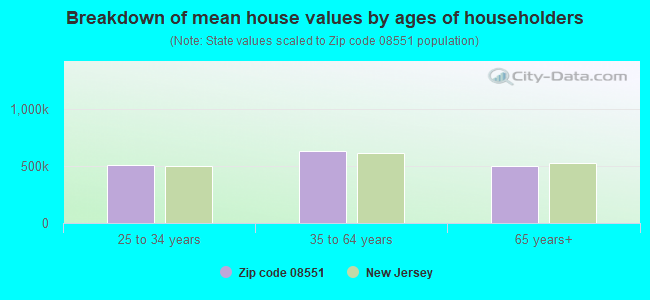
Estimated median house/condo value in 2022: $580,415
08551:
$580,415
New Jersey:
$428,900
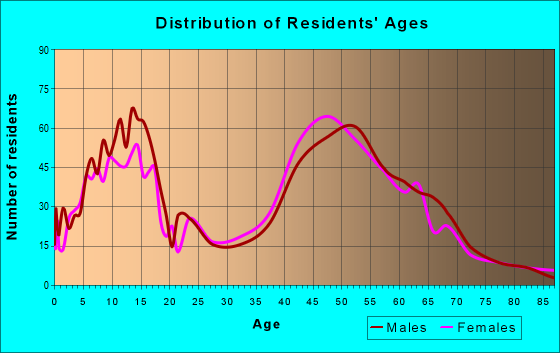
Median resident age:
This zip code:
49.9 years
New Jersey median age:
40.4 years
Average household size:
This zip code:
2.7 people
New Jersey:
2.6 people
Averages for the 2020 tax year for zip code 08551, filed in 2021:
Average Adjusted Gross Income (AGI) in 2020: $152,598 (Individual Income Tax Returns)
Here:
$152,598
State:
$95,247
Salary/wage: $129,156 (reported on 81.1% of returns)
Here:
$129,156
State:
$80,635
(% of AGI for various income ranges: 1374.1% for AGIs below $25k, 3964.4% for AGIs $25k-50k, 6711.5% for AGIs $50k-75k, 10490.0% for AGIs $75k-100k, 18785.6% for AGIs $100k-200k, 107713.9% for AGIs over 200k)
Taxable interest for individuals: $2,486 (reported on 50.9% of returns)
This zip code:
$2,486
New Jersey:
$2,414
(% of AGI for various income ranges: 30.6% for AGIs below $25k, 56.8% for AGIs $25k-50k, 77.0% for AGIs $50k-75k, 214.2% for AGIs $75k-100k, 312.4% for AGIs $100k-200k, 1047.8% for AGIs over 200k)
Ordinary dividends: $11,559 (reported on 46.7% of returns)
Here:
$11,559
State:
$8,057
(% of AGI for various income ranges: 80.3% for AGIs below $25k, 115.6% for AGIs $25k-50k, 232.5% for AGIs $50k-75k, 470.0% for AGIs $75k-100k, 775.9% for AGIs $100k-200k, 6191.1% for AGIs over 200k)
Net capital gain/loss in AGI: +$32,007 (reported on 39.6% of returns)
Here:
+$32,007
State:
+$25,022
(% of AGI for various income ranges: 12.6% for AGIs below $25k, 140.4% for AGIs $25k-50k, 208.0% for AGIs $50k-75k, 527.5% for AGIs $75k-100k, 819.4% for AGIs $100k-200k, 17743.9% for AGIs over 200k)
Profit/loss from business: +$24,222 (reported on 17.9% of returns)
Here:
+$24,222
State:
+$18,035
(% of AGI for various income ranges: 155.6% for AGIs below $25k, 222.0% for AGIs $25k-50k, 404.5% for AGIs $50k-75k, 605.8% for AGIs $75k-100k, 750.6% for AGIs $100k-200k, 3989.4% for AGIs over 200k)
Taxable individual retirement arrangement distribution: $24,274 (reported on 13.3% of returns)
08551:
$24,274
New Jersey:
$21,558
(% of AGI for various income ranges: 101.5% for AGIs below $25k, 190.8% for AGIs $25k-50k, 417.0% for AGIs $50k-75k, 507.5% for AGIs $75k-100k, 974.7% for AGIs $100k-200k, 2025.0% for AGIs over 200k)
Self-employed (Keogh) retirement plans: $32,500 (reported on 2.1% of returns)
08551:
$32,500
New Jersey:
$30,844
(% of AGI for various income ranges: 1083.3% for AGIs over 200k)
Total itemized deductions: $33,124 (reported on 22.1% of returns)
Here:
$33,124
State:
$32,863
(% of AGI for various income ranges: 197.6% for AGIs below $25k, 361.6% for AGIs $25k-50k, 592.5% for AGIs $50k-75k, 1385.8% for AGIs $75k-100k, 1568.8% for AGIs $100k-200k, 6172.2% for AGIs over 200k)
Charity contributions: $8,479 (reported on 18.6% of returns)
Here:
$8,479
State:
$7,880
(% of AGI for various income ranges: 29.6% for AGIs $25k-50k, 32.0% for AGIs $50k-75k, 145.8% for AGIs $75k-100k, 200.6% for AGIs $100k-200k, 1943.9% for AGIs over 200k)
Taxes paid: $9,302 (reported on 22.1% of returns)
08551:
$9,302
State:
$9,183
(% of AGI for various income ranges: 64.4% for AGIs below $25k, 124.0% for AGIs $25k-50k, 239.5% for AGIs $50k-75k, 480.8% for AGIs $75k-100k, 493.5% for AGIs $100k-200k, 1442.8% for AGIs over 200k)
Earned income credit: $1,523 (reported on 4.6% of returns)
Here:
$1,523
State:
$2,148
(% of AGI for various income ranges: 32.4% for AGIs below $25k, 35.2% for AGIs $25k-50k)
Percentage of individuals using paid preparers for their 2020 taxes: 90.9%
Here:
91%
State:
92%
(% for various income ranges: 89.7% for AGIs below $25k, 92.3% for AGIs $25k-50k, 90.9% for AGIs $50k-75k, 90.9% for AGIs $75k-100k, 89.4% for AGIs $100k-200k, 93.0% for AGIs over 200k)
Averages for the 2012 tax year for zip code 08551, filed in 2013:
Average Adjusted Gross Income (AGI) in 2012: $123,198 (Individual Income Tax Returns)
Here:
$123,198
State:
$79,688
Salary/wage: $108,667 (reported on 83.2% of returns)
Here:
$108,667
State:
$68,122
(% of AGI for various income ranges: 73.7% for AGIs below $25k, 66.1% for AGIs $25k-50k, 68.4% for AGIs $50k-75k, 70.2% for AGIs $75k-100k, 78.2% for AGIs $100k-200k, 72.6% for AGIs over 200k)
Taxable interest for individuals: $1,933 (reported on 55.7% of returns)
This zip code:
$1,933
New Jersey:
$2,193
(% of AGI for various income ranges: 2.6% for AGIs below $25k, 1.9% for AGIs $25k-50k, 1.3% for AGIs $50k-75k, 0.6% for AGIs $75k-100k, 0.8% for AGIs $100k-200k, 0.8% for AGIs over 200k)
Ordinary dividends: $5,958 (reported on 47.5% of returns)
Here:
$5,958
State:
$6,828
(% of AGI for various income ranges: 2.9% for AGIs below $25k, 3.1% for AGIs $25k-50k, 2.7% for AGIs $50k-75k, 1.8% for AGIs $75k-100k, 1.8% for AGIs $100k-200k, 2.5% for AGIs over 200k)
Net capital gain/loss in AGI: +$5,686 (reported on 36.8% of returns)
Here:
+$5,686
State:
+$15,358
(% of AGI for various income ranges: 0.7% for AGIs $75k-100k, 1.3% for AGIs $100k-200k, 2.4% for AGIs over 200k)
Profit/loss from business: +$24,033 (reported on 18.2% of returns)
Here:
+$24,033
State:
+$19,577
(% of AGI for various income ranges: 10.2% for AGIs below $25k, 4.8% for AGIs $25k-50k, 7.6% for AGIs $50k-75k, 5.7% for AGIs $75k-100k, 3.7% for AGIs $100k-200k, 2.6% for AGIs over 200k)
Taxable individual retirement arrangement distribution: $24,760 (reported on 12.5% of returns)
08551:
$24,760
New Jersey:
$18,214
(% of AGI for various income ranges: 4.1% for AGIs below $25k, 5.6% for AGIs $25k-50k, 3.0% for AGIs $50k-75k, 3.9% for AGIs $75k-100k, 3.0% for AGIs $100k-200k, 1.8% for AGIs over 200k)
Self-employment retirement plans: $26,617 (reported on 2.1% of returns)
08551:
$26,617
New Jersey:
$24,511
Total itemized deductions: $37,724 (20% of AGI, reported on 58.9% of returns)
Here:
$37,724
State:
$30,827
Here:
19.9% of AGI
State:
21.2% of AGI
(% of AGI for various income ranges: 25.9% for AGIs below $25k, 21.8% for AGIs $25k-50k, 22.1% for AGIs $50k-75k, 22.1% for AGIs $75k-100k, 20.5% for AGIs $100k-200k, 15.6% for AGIs over 200k)
Charity contributions: $3,598 (reported on 51.4% of returns)
Here:
$3,598
State:
$3,451
(% of AGI for various income ranges: 0.9% for AGIs below $25k, 1.1% for AGIs $25k-50k, 1.6% for AGIs $50k-75k, 1.9% for AGIs $75k-100k, 1.6% for AGIs $100k-200k, 1.5% for AGIs over 200k)
Taxes paid: $20,642 (reported on 58.9% of returns)
08551:
$20,642
State:
$15,801
(% of AGI for various income ranges: 10.4% for AGIs below $25k, 8.9% for AGIs $25k-50k, 8.4% for AGIs $50k-75k, 9.6% for AGIs $75k-100k, 10.3% for AGIs $100k-200k, 9.9% for AGIs over 200k)
Earned income credit: $1,414 (reported on 5.0% of returns)
Here:
$1,414
State:
$2,182
(% of AGI for various income ranges: 1.9% for AGIs below $25k, 0.4% for AGIs $25k-50k)
Percentage of individuals using paid preparers for their 2012 taxes: 62.9%
Here:
63%
State:
65%
(% for various income ranges: 57.0% for AGIs below $25k, 60.0% for AGIs $25k-50k, 66.7% for AGIs $50k-75k, 71.4% for AGIs $75k-100k, 61.3% for AGIs $100k-200k, 70.8% for AGIs over 200k)
Averages for the 2004 tax year for zip code 08551, filed in 2005:
Average Adjusted Gross Income (AGI) in 2004: $99,441 (Individual Income Tax Returns)
Here:
$99,441
State:
$64,921
Salary/wage: $91,645 (reported on 83.7% of returns)
Here:
$91,645
State:
$57,755
(% of AGI for various income ranges: 123.6% for AGIs below $10k, 66.2% for AGIs $10k-25k, 75.5% for AGIs $25k-50k, 73.3% for AGIs $50k-75k, 79.1% for AGIs $75k-100k, 77.3% for AGIs over 100k)
Taxable interest for individuals: $2,471 (reported on 67.4% of returns)
This zip code:
$2,471
New Jersey:
$2,068
(% of AGI for various income ranges: 10.8% for AGIs below $10k, 3.2% for AGIs $10k-25k, 2.2% for AGIs $25k-50k, 2.3% for AGIs $50k-75k, 1.1% for AGIs $75k-100k, 1.5% for AGIs over 100k)
Taxable dividends: $3,651 (reported on 51.5% of returns)
Here:
$3,651
State:
$3,959
(% of AGI for various income ranges: 13.2% for AGIs below $10k, 3.2% for AGIs $10k-25k, 1.3% for AGIs $25k-50k, 2.4% for AGIs $50k-75k, 2.1% for AGIs $75k-100k, 1.8% for AGIs over 100k)
Net capital gain/loss: +$18,029 (reported on 41.3% of returns)
Here:
+$18,029
State:
+$13,591
(% of AGI for various income ranges: -7.4% for AGIs below $10k, -0.8% for AGIs $10k-25k, -0.3% for AGIs $25k-50k, 1.6% for AGIs $50k-75k, 2.2% for AGIs $75k-100k, 9.4% for AGIs over 100k)
Profit/loss from business: +$24,528 (reported on 17.4% of returns)
Here:
+$24,528
State:
+$17,520
(% of AGI for various income ranges: 10.3% for AGIs below $10k, 11.4% for AGIs $10k-25k, 5.8% for AGIs $25k-50k, 7.4% for AGIs $50k-75k, 5.3% for AGIs $75k-100k, 3.6% for AGIs over 100k)
IRA payment deduction: $3,596 (reported on 3.9% of returns)
08551:
$3,596
New Jersey:
$3,270
(% of AGI for various income ranges: 0.4% for AGIs $25k-50k, 0.3% for AGIs $50k-75k, 0.3% for AGIs $75k-100k, 0.1% for AGIs over 100k)
Self-employed pension: $14,161 (reported on 2.2% of returns)
Here:
$14,161
New Jersey:
$17,258
Total itemized deductions: $34,031 (22% of AGI, reported on 58.1% of returns)
Here:
$34,031
State:
$23,924
Here:
22.2% of AGI
State:
21.1% of AGI
(% of AGI for various income ranges: 40.9% for AGIs below $10k, 22.8% for AGIs $10k-25k, 17.5% for AGIs $25k-50k, 23.8% for AGIs $50k-75k, 22.5% for AGIs $75k-100k, 19.2% for AGIs over 100k)
Charity contributions deductions: $3,384 (2% of AGI, reported on 53.6% of returns)
Here:
$3,384
State:
$3,242
Here:
2.2% of AGI
State:
2.7% of AGI
(% of AGI for various income ranges: 1.0% for AGIs below $10k, 1.9% for AGIs $10k-25k, 1.5% for AGIs $25k-50k, 2.2% for AGIs $50k-75k, 2.1% for AGIs $75k-100k, 1.8% for AGIs over 100k)
Total tax: $20,082 (reported on 83.7% of returns)
08551:
$20,082
State:
$12,321
(% of AGI for various income ranges: 5.2% for AGIs below $10k, 5.7% for AGIs $10k-25k, 8.5% for AGIs $25k-50k, 9.9% for AGIs $50k-75k, 10.3% for AGIs $75k-100k, 19.2% for AGIs over 100k)
Earned income credit: $1,127 (reported on 3.6% of returns)
Here:
$1,127
State:
$1,711
Percentage of individuals using paid preparers for their 2004 taxes: 63.8%
Here:
64%
State:
65%
(% for various income ranges: 55.5% for AGIs below $10k, 61.9% for AGIs $10k-25k, 61.8% for AGIs $25k-50k, 72.7% for AGIs $50k-75k, 71.9% for AGIs $75k-100k, 65.2% for AGIs over 100k)
Household received Food Stamps/SNAP in the past 12 months: 17 Household did not receive Food Stamps/SNAP in the past 12 months: 2,063
Women who did not have a birth in the past 12 months: 1,275 (454 now married, 822 unmarried)
Housing units in zip code 08551 with a mortgage: 1,292 (293 second mortgage, 293 both second mortgage and home equity loan) Houses without a mortgage: 66
Median monthly owner costs for units with a mortgage: $3,311 Median monthly owner costs for units without a mortgage: $1,075
Residents with income below the poverty level in 2022:
This zip code:
0.7%
Whole state:
9.7%
Residents with income below 50% of the poverty level in 2022:
This zip code:
0.6%
Whole state:
5.2%
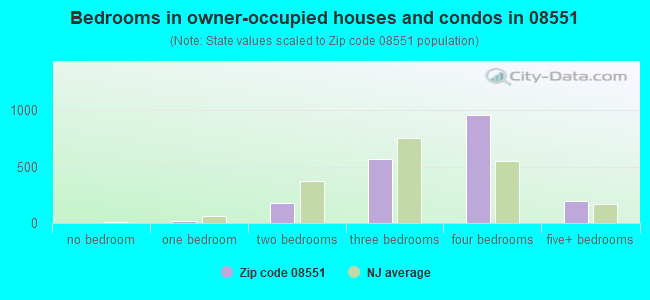
Median number of rooms in houses and condos:
Here:
10.0
State:
6.8
Median number of rooms in apartments:
Here:
4.4
State:
3.9
Notable locations in this zip code not listed on our city pages
Notable locations in zip code 08551: Copper Hill Country Club (A), Vanlieu Corners (B), Amwell Valley Fire Company (C), Amwell Valley Ambulance (D). Display/hide their locations on the map
Churches in zip code 08551 include: Calvary Presbyterian Church of Amwell (A), Amwell First Presbyterian Church (B), Kirkpatrick Presbyterian Church (C), United First Presbyterian Church (D), Linvale United Methodist Church (E). Display/hide their locations on the map
Cemeteries: Union Cemetery (1), Pleasant Ridge Cemetery (2), Union Cemetery of Wertsville (3), Larison's Corner Cemetery (4), Wertsville Baptist Church Yard (5). Display/hide their locations on the map
In group quarters: 2 (-1 institutionalized population)
Size of family households: 795 2-persons, 313 3-persons, 308 4-persons, 243 5-persons, 19 6-persons
Size of nonfamily households: 324 1-person, 97 2-persons
841 married couples with children.
84 single-parent households (23 men, 61 women).
88.5% of residents of 08551 zip code speak English at home.
1.3% of residents speak Spanish at home (83% very well, 17% well).
7.3% of residents speak other Indo-European language at home (87% very well, 4% well, 9% not well).
2.1% of residents speak Asian or Pacific Island language at home (93% very well, 7% not well).
0.2% of residents speak other language at home (100% very well).
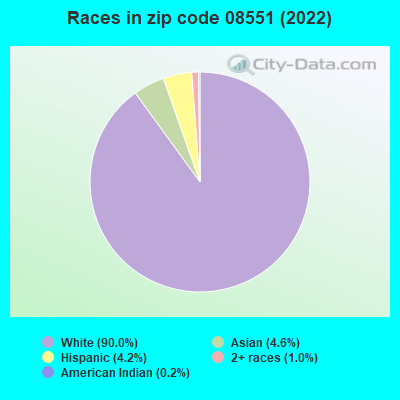
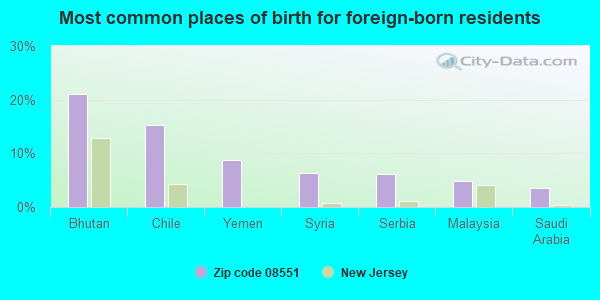
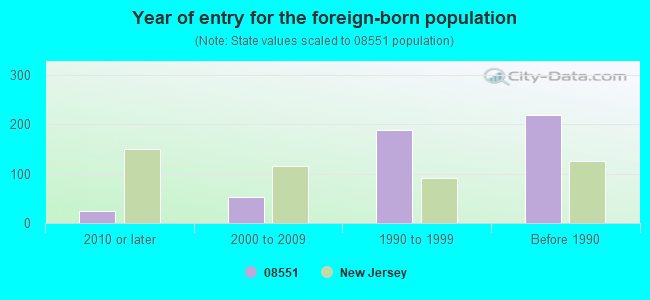
Foreign born population: 472 (8.2%) (85.0% of them are naturalized citizens)
This zip code:
8.2%
Whole state:
23.5%
21%Bhutan
15%Chile
9%Yemen
6%Syria
6%Serbia
5%Malaysia
4%Saudi Arabia
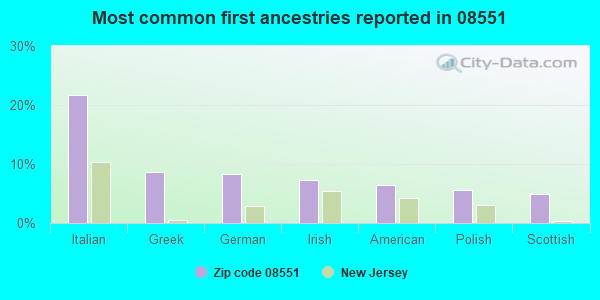
22%Italian
9%Greek
8%German
7%Irish
6%American
6%Polish
5%Scottish
Year of entry for the foreign-born population
242010 or later
532000 to 2009
1881990 to 1999
219Before 1990
Public elementary/middle schools in in zip code 08551 not listed on the city page:
Private elementary/middle school in in this zip code not listed on the city page:
OUR HOPE CHRISTIAN ACADEMY (Students: 6, Location: 191 OLD YORK RD, Grades: 1-4)
Facilities with environmental interests located in this zip code:
PRO AUTO RECYCLERS OF FLEMINGT (RD 1 BOX 167 RTE 31 & 202 in RINGOES, NJ)
National Pollutant Discharge Elimination System NON-MAJOR (Tracking pollutant discharge elimination systems) - permit (Resource Conservation and Recovery Act (tracking hazardous waste)) Organizations: LENTINI AUTO SALVAGE INC (CONTACT/OPERATOR)
Alternative names: LENTINI AUTO SALVAGE
ATHERTON RESIDENCE (45 EVERITTS RD in RINGOES, NJ)
(Resource Conservation and Recovery Act (tracking hazardous waste))
ANDREWS NANCY (BOX 384 RTE 31 N OFF LINVALE in RINGOES, NJ)
Conditionally Exempt Small Quantity Generators, less than 100 kg/month of hazardous waste (Resource Conservation and Recovery Act (tracking hazardous waste)) - notification Organizations: NANCY ANDREWS (CONTACT/OWNER)
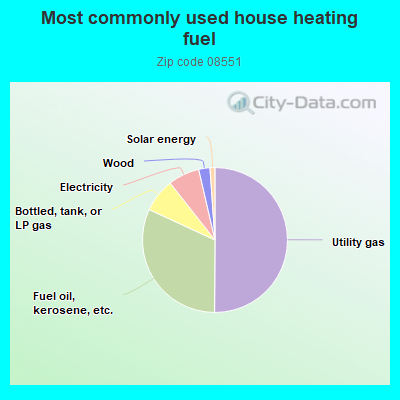
50.1%Utility gas
31.8%Fuel oil, kerosene, etc.
7.5%Bottled, tank, or LP gas
7.0%Electricity
2.5%Wood
1.1%Solar energy
Population in 1990: 5,106.
Place of birth for U.S.-born residents:
This state: 3,517
Northeast: 1,366
Midwest: 183
South: 146
West: 22
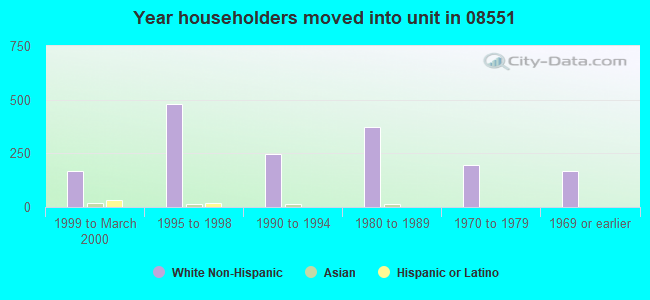
60% of the 08551 zip code residents lived in the same house 5 years ago. Out of people who lived in different houses, 34% lived in this county. Out of people who lived in different counties, 50% lived in New Jersey.
92% of the 08551 zip code residents lived in the same house 1 year ago. Out of people who lived in different houses, 20% moved from this county. Out of people who lived in different houses, 61% moved from different county within same state. Out of people who lived in different houses, 9% moved from different state. Out of people who lived in different houses, 8% moved from abroad.
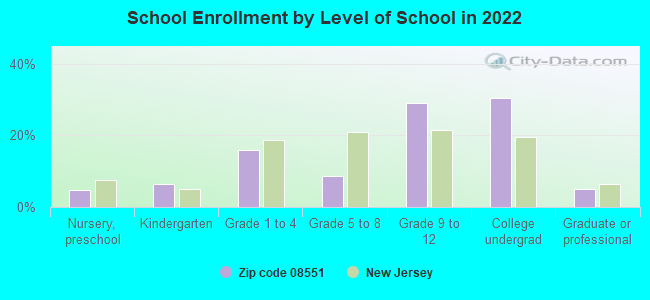
Private vs. public school enrollment:
Students in private schools in grades 1 to 8 (elementary and middle school): 17
Here:
5.3%
New Jersey:
12.3%
Students in private schools in grades 9 to 12 (high school): 58
Here:
14.5%
New Jersey:
13.1%
Students in private undergraduate colleges: 93
Here:
22.3%
New Jersey:
33.2%
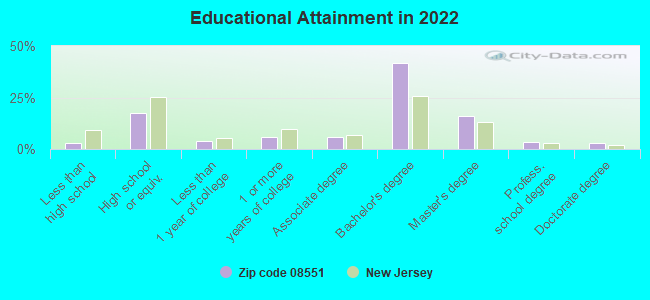
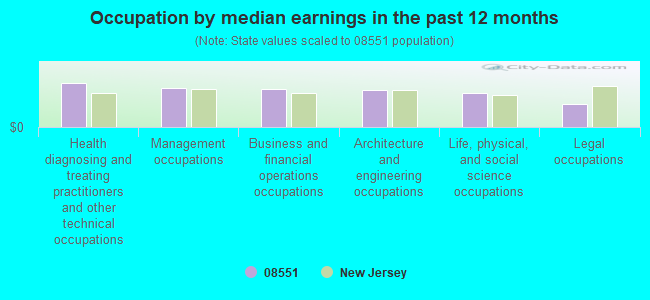
Occupation by median earnings in the past 12 months ($)
121,505Health diagnosing and treating practitioners and other technical occupations
109,064Management occupations
105,040Business and financial operations occupations
102,258Architecture and engineering occupations
93,442Life, physical, and social science occupations
64,731Legal occupations
Companies with federal contracts located in this zip code (RINGOES, NJ):
SCIENTIFIC INSTRUMENT SERVICES (1027 OLD YORK ROAD; small business) : $189,704 in 13 contractsfrom 2000 to 2006
Contracts for Electrical and Electronic Properties Measuring and Testing Instruments, Laboratory Equipment and Supplies, Liquid and Gas Flow, Liquid Level, and Mechanical Motion Measuring Instruments, by NASA, Army, Navy, Centers for Disease Control and Prevention, and others Signed by year:2000: $33,000; 2001: $43,050; 2002: $47,321; 2003: $0; 2004: $0; 2005: $61,437; 2006: $4,896.
Biggest contracts:
$40,635 with NASA for Electrical and Electronic Properties Measuring and Testing Instruments. Signed on 2005-06-13. Completion date: 2005-07-22.
$40,310 with Army for Laboratory Equipment and Supplies. Signed on 2002-09-05. Completion date: 2002-10-17.
$39,050 with Navy for Laboratory Equipment and Supplies. Taking place in CA. Signed on 2001-07-31. Completion date: 2001-10-01.
$33,000 with Centers for Disease Control and Prevention for Electrical and Electronic Properties Measuring and Testing Instruments. Signed on 2000-09-15. Completion date: 2001-12-15.
REAGENT CHEMICAL & RESEARCH (115 ROUTE 202; small business) : $71,120 in 7 contractsfrom 2002 to 2006
Contracts for Armament Training Devices, Training Aids, Athletic and Sporting Equipment by Army Signed by year:2000: $0; 2001: $0; 2002: $19,976; 2003: $19,976; 2004: $20,288; 2005: $0; 2006: $10,880.
Biggest contracts:
$10,880 with Army for Armament Training Devices. Signed on 2006-05-12. Completion date: 2006-07-27.
$10,300 with Army for Armament Training Devices. Taking place in PA. Signed on 2004-09-20. Completion date: 2005-02-03.
$9,988 with Army for Armament Training Devices. Taking place in GA. Signed on 2002-07-30. Completion date: 2002-08-29.
$9,988 with Army for Training Aids. Signed on 2003-07-30. Completion date: 2003-09-01.
ABR MAINTENANCE SYSTEMS, INC (45 MANNERS RD; small business)
$15,600 with Defense Logistics Agency for Maintenance, Repair or Alteration of Real Property -- Other Administrative Facilities and Service Buildings. Signed on 2004-12-15. Completion date: 2005-12-31.
CHESTNUT GROUP INC (137 US HIGHWAY 202; small business) : $8,161 in 2 contractsfrom 2004 to 2005
$7,116 with Navy for Coil, Flat, Leaf, and Wire Springs. Signed on 2004-09-23. Completion date: 2004-11-19.
$1,045 with Navy for Plate, Sheet, Strip, Foil, and Wire; Precious Metal. Signed on 2005-08-10. Completion date: 2005-08-19.
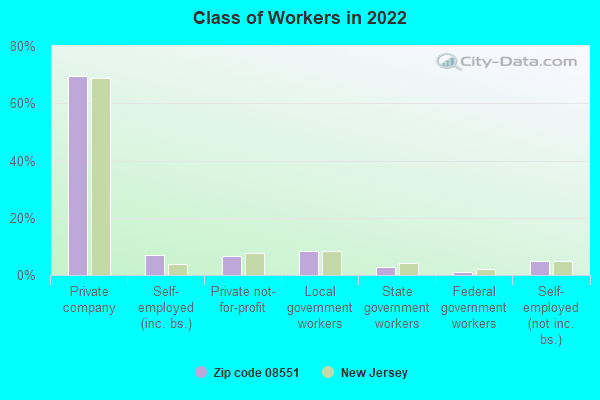
Top industries in this zip code by the number of employees in 2005:
Administrative and Support and Waste Management and Remediation Services: Landscaping Services (250-499 employees: 1 establishment, 5-9 employees: 2 establishments, 1-4 employees: 3 establishments)
Arts, Entertainment, and Recreation: Golf Courses and Country Clubs (50-99: 1, 20-49: 1)
Construction: Water and Sewer Line and Related Structures Construction (20-49: 1, 10-19: 1, 5-9: 1, 1-4: 1)
Construction: Site Preparation Contractors (20-49: 1, 10-19: 1, 5-9: 1)
2002 - 2018 National Fire Incident Reporting System (NFIRS) incidents
Based on the data from the years 2002 - 2018 the average number of fires per year is 24. The highest number of fire incidents - 49 took place in 2011, and the least - 0 in 2003. The data has a rising trend.
When looking into fire subcategories, the most reports belonged to: Structure Fires (60.0%), and Outside Fires (27.4%).
Fire incident types reported to NFIRS in Zip Code 08551


 Nearest zip codes: 08525, 08822, 08887, 08530, 08534, 08853.
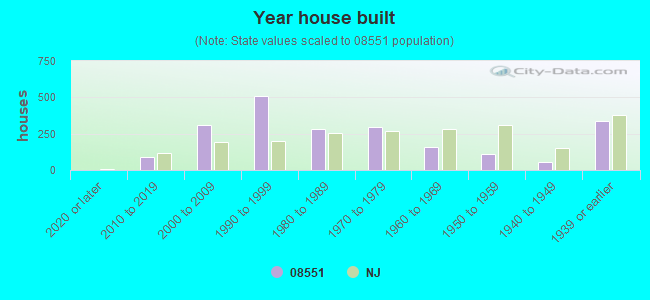


 (Students: 551, Location: 100 EVERITTS RD, Grades: PK-4)
 Based on the data from the years 2002 - 2018 the average number of fires per year is 24. The highest number of fire incidents - 49 took place in 2011, and the least - 0 in 2003. The data has a rising trend.
 When looking into fire subcategories, the most reports belonged to: Structure Fires (60.0%), and Outside Fires (27.4%).