Estimated zip code population in 2022: 3,568 Zip code population in 2010: 3,725 Zip code population in 2000: 3,798
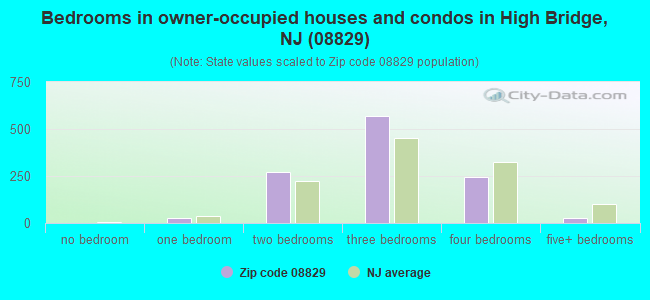
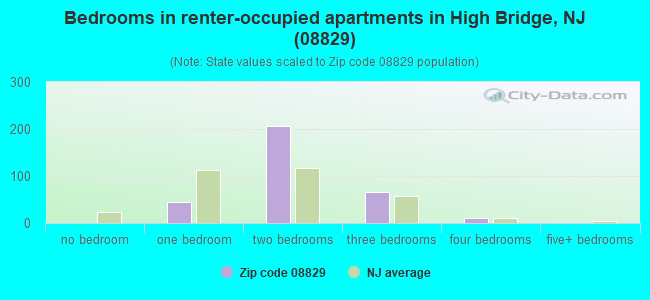
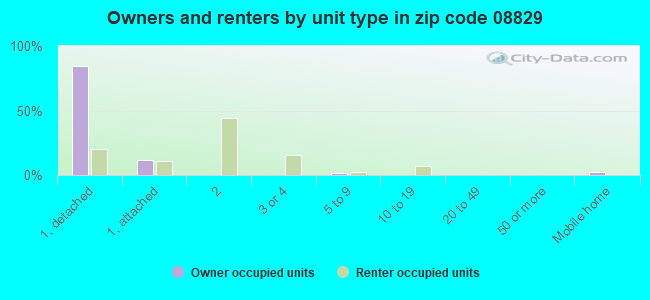
Houses and condos: 1,477 Renter-occupied apartments: 328
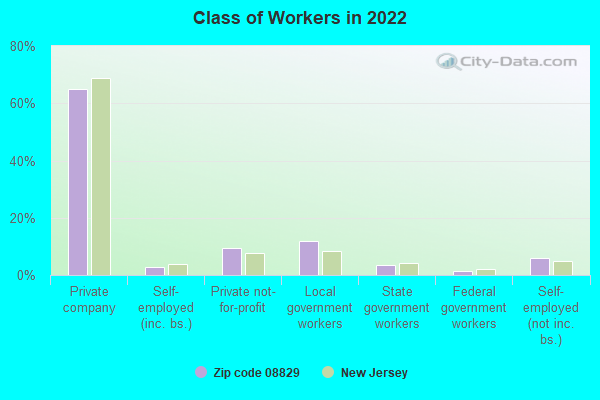
% of renters here:
22%
State:
35%
March 2022 cost of living index in zip code 08829: 117.1 (more than average, U.S. average is 100)
Land area: 2.5 sq. mi. Water area: 0.0 sq. mi.
Population density: 1,444 people per square mile
(low).
OSM Map
Google Map
MSN Map
OSM Map
General Map
Google Map
MSN Map
OSM Map
Google Map
MSN Map
OSM Map
Google Map
MSN Map
Please wait while loading the map...
Real estate property taxes paid for housing units in 2022:
This zip code:
3.0% ($9,521)
New Jersey:
2.1% ($8,897)
Median real estate property taxes paid for housing units with mortgages in 2022: $9,557 (3.0%) Median real estate property taxes paid for housing units with no mortgage in 2022: $9,482 (2.9%)
Business Search- 14 Million verified businesses
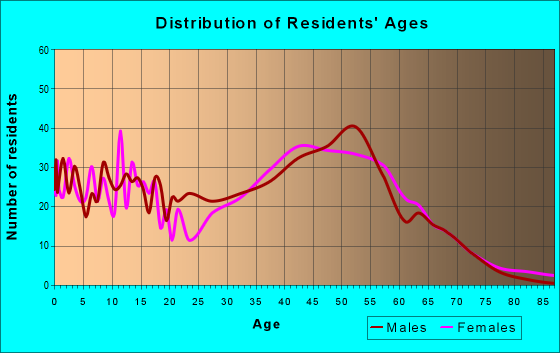
Males: 1,863
(52.2%)
Females: 1,705
(47.8%)
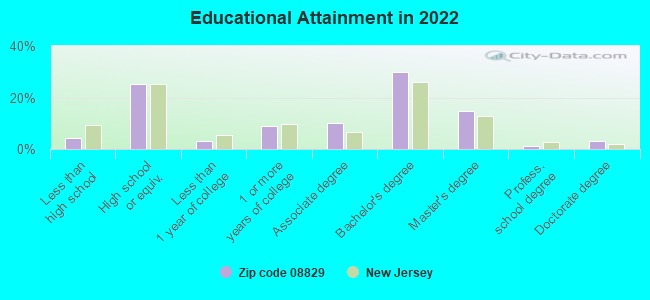
For population 25 years and over in 08829:
High school or higher: 95.7%
Bachelor's degree or higher: 48.6%
Graduate or professional degree: 18.8%
Unemployed: 4.6%
Mean travel time to work (commute): 38.0 minutes
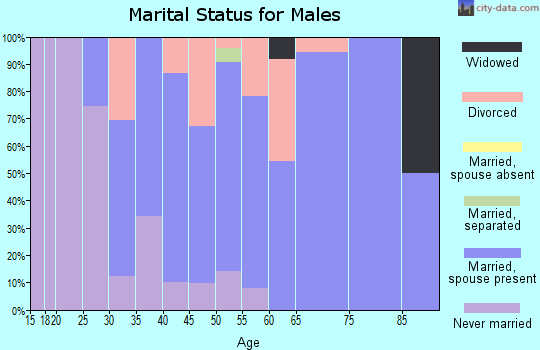
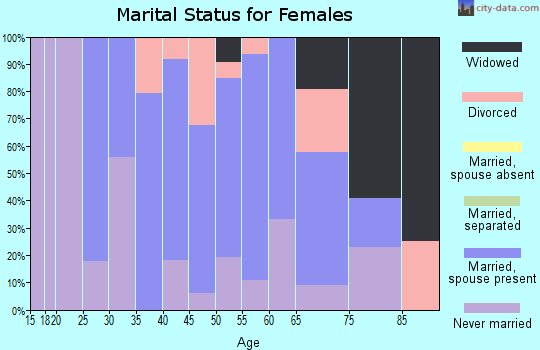
For population 15 years and over in 08829:
Never married: 33.6%
Now married: 53.5%
Separated: 0.7%
Widowed: 3.7%
Divorced: 8.5%
Zip code 08829 compared to state average:
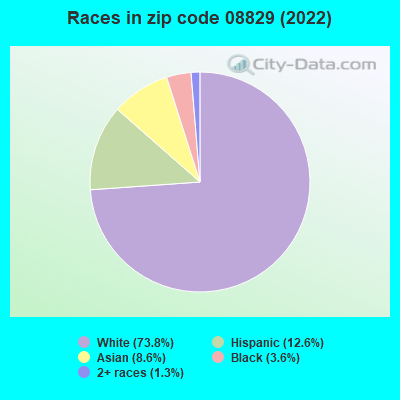
Black race population percentage significantly below state average.
Renting percentage below state average.
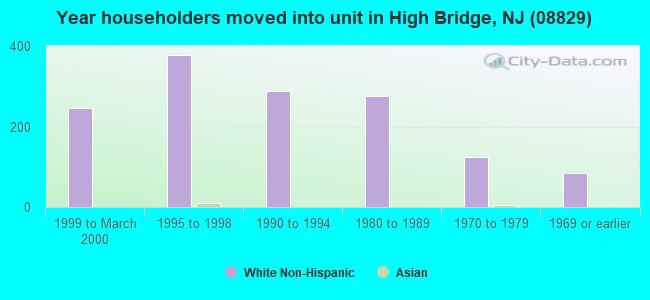
Length of stay since moving in significantly above state average.
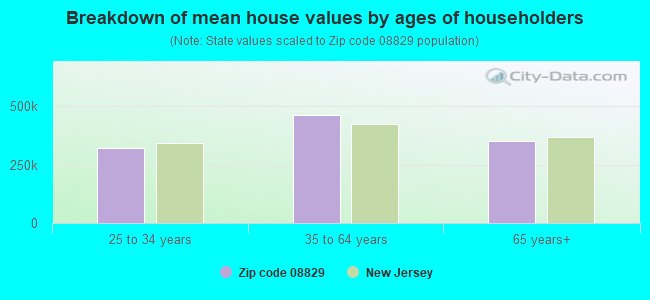
Estimated median house/condo value in 2022: $316,920
08829:
$316,920
New Jersey:
$428,900
According to our research of New Jersey and other state lists, there was 1 registered sex offender living in 08829 zip code as of April 28, 2024. The ratio of all residents to sex offenders in zip code 08829 is 3,684 to 1. The ratio of registered sex offenders to all residents in this zip code is lower than the state average.
Median resident age:
This zip code:
40.4 years
New Jersey median age:
40.4 years
Average household size:
This zip code:
2.4 people
New Jersey:
2.6 people
Averages for the 2020 tax year for zip code 08829, filed in 2021:
Average Adjusted Gross Income (AGI) in 2020: $90,950 (Individual Income Tax Returns)
Here:
$90,950
State:
$95,247
Salary/wage: $81,511 (reported on 84.6% of returns)
Here:
$81,511
State:
$80,635
(% of AGI for various income ranges: 1308.8% for AGIs below $25k, 3485.2% for AGIs $25k-50k, 7127.8% for AGIs $50k-75k, 10317.1% for AGIs $75k-100k, 18492.4% for AGIs $100k-200k, 62571.7% for AGIs over 200k)
Taxable interest for individuals: $1,079 (reported on 37.8% of returns)
This zip code:
$1,079
New Jersey:
$2,414
(% of AGI for various income ranges: 20.0% for AGIs below $25k, 41.7% for AGIs $25k-50k, 26.7% for AGIs $50k-75k, 66.4% for AGIs $75k-100k, 86.9% for AGIs $100k-200k, 381.7% for AGIs over 200k)
Ordinary dividends: $4,528 (reported on 30.9% of returns)
Here:
$4,528
State:
$8,057
(% of AGI for various income ranges: 32.1% for AGIs below $25k, 60.0% for AGIs $25k-50k, 65.6% for AGIs $50k-75k, 175.7% for AGIs $75k-100k, 232.8% for AGIs $100k-200k, 2286.7% for AGIs over 200k)
Net capital gain/loss in AGI: +$9,302 (reported on 25.0% of returns)
Here:
+$9,302
State:
+$25,022
(% of AGI for various income ranges: 6.7% for AGIs below $25k, 59.6% for AGIs $25k-50k, 140.6% for AGIs $50k-75k, 117.9% for AGIs $75k-100k, 383.4% for AGIs $100k-200k, 4481.7% for AGIs over 200k)
Profit/loss from business: +$21,855 (reported on 15.4% of returns)
Here:
+$21,855
State:
+$18,035
(% of AGI for various income ranges: 88.8% for AGIs below $25k, 307.0% for AGIs $25k-50k, 241.1% for AGIs $50k-75k, 465.0% for AGIs $75k-100k, 626.6% for AGIs $100k-200k, 4195.0% for AGIs over 200k)
Taxable individual retirement arrangement distribution: $21,700 (reported on 11.2% of returns)
08829:
$21,700
New Jersey:
$21,558
(% of AGI for various income ranges: 51.7% for AGIs below $25k, 83.9% for AGIs $25k-50k, 230.0% for AGIs $50k-75k, 686.4% for AGIs $75k-100k, 604.8% for AGIs $100k-200k, 1851.7% for AGIs over 200k)
Total itemized deductions: $25,250 (reported on 16.0% of returns)
Here:
$25,250
State:
$32,863
(% of AGI for various income ranges: 199.2% for AGIs below $25k, 266.5% for AGIs $25k-50k, 576.7% for AGIs $50k-75k, 957.9% for AGIs $75k-100k, 847.9% for AGIs $100k-200k, 2743.3% for AGIs over 200k)
Charity contributions: $4,641 (reported on 11.7% of returns)
Here:
$4,641
State:
$7,880
(% of AGI for various income ranges: 11.2% for AGIs below $25k, 45.0% for AGIs $50k-75k, 50.7% for AGIs $75k-100k, 111.7% for AGIs $100k-200k, 863.3% for AGIs over 200k)
Taxes paid: $9,170 (reported on 16.0% of returns)
08829:
$9,170
State:
$9,183
(% of AGI for various income ranges: 62.5% for AGIs below $25k, 94.8% for AGIs $25k-50k, 267.2% for AGIs $50k-75k, 366.4% for AGIs $75k-100k, 322.8% for AGIs $100k-200k, 755.0% for AGIs over 200k)
Earned income credit: $1,723 (reported on 6.9% of returns)
Here:
$1,723
State:
$2,148
(% of AGI for various income ranges: 48.3% for AGIs below $25k, 47.0% for AGIs $25k-50k)
Percentage of individuals using paid preparers for their 2020 taxes: 92.6%
Here:
93%
State:
92%
(% for various income ranges: 90.0% for AGIs below $25k, 93.8% for AGIs $25k-50k, 92.6% for AGIs $50k-75k, 95.7% for AGIs $75k-100k, 91.8% for AGIs $100k-200k, 94.1% for AGIs over 200k)
Averages for the 2012 tax year for zip code 08829, filed in 2013:
Average Adjusted Gross Income (AGI) in 2012: $76,755 (Individual Income Tax Returns)
Here:
$76,755
State:
$79,688
Salary/wage: $70,039 (reported on 87.6% of returns)
Here:
$70,039
State:
$68,122
(% of AGI for various income ranges: 71.5% for AGIs below $25k, 73.2% for AGIs $25k-50k, 75.6% for AGIs $50k-75k, 80.3% for AGIs $75k-100k, 85.2% for AGIs $100k-200k, 75.4% for AGIs over 200k)
Taxable interest for individuals: $684 (reported on 46.3% of returns)
This zip code:
$684
New Jersey:
$2,193
(% of AGI for various income ranges: 0.7% for AGIs below $25k, 0.9% for AGIs $25k-50k, 0.6% for AGIs $50k-75k, 0.6% for AGIs $75k-100k, 0.3% for AGIs $100k-200k, 0.2% for AGIs over 200k)
Ordinary dividends: $2,142 (reported on 32.2% of returns)
Here:
$2,142
State:
$6,828
(% of AGI for various income ranges: 1.7% for AGIs below $25k, 0.9% for AGIs $25k-50k, 1.2% for AGIs $50k-75k, 0.9% for AGIs $75k-100k, 0.7% for AGIs $100k-200k, 1.0% for AGIs over 200k)
Net capital gain/loss in AGI: +$2,492 (reported on 22.6% of returns)
Here:
+$2,492
State:
+$15,358
(% of AGI for various income ranges: 3.9% for AGIs over 200k)
Profit/loss from business: +$13,493 (reported on 15.8% of returns)
Here:
+$13,493
State:
+$19,577
(% of AGI for various income ranges: 6.7% for AGIs below $25k, 5.3% for AGIs $25k-50k, 2.1% for AGIs $50k-75k, 2.6% for AGIs $75k-100k, 2.0% for AGIs $100k-200k, 3.2% for AGIs over 200k)
Taxable individual retirement arrangement distribution: $12,777 (reported on 12.4% of returns)
08829:
$12,777
New Jersey:
$18,214
(% of AGI for various income ranges: 4.0% for AGIs below $25k, 3.0% for AGIs $25k-50k, 3.1% for AGIs $50k-75k, 2.5% for AGIs $75k-100k, 2.2% for AGIs $100k-200k)
Total itemized deductions: $24,037 (22% of AGI, reported on 59.3% of returns)
Here:
$24,037
State:
$30,827
Here:
22.3% of AGI
State:
21.2% of AGI
(% of AGI for various income ranges: 22.1% for AGIs below $25k, 19.2% for AGIs $25k-50k, 21.8% for AGIs $50k-75k, 19.5% for AGIs $75k-100k, 18.5% for AGIs $100k-200k, 15.1% for AGIs over 200k)
Charity contributions: $2,133 (reported on 50.3% of returns)
Here:
$2,133
State:
$3,451
(% of AGI for various income ranges: 0.7% for AGIs below $25k, 1.0% for AGIs $25k-50k, 1.6% for AGIs $50k-75k, 1.2% for AGIs $75k-100k, 1.5% for AGIs $100k-200k, 1.5% for AGIs over 200k)
Taxes paid: $12,488 (reported on 58.8% of returns)
08829:
$12,488
State:
$15,801
(% of AGI for various income ranges: 8.7% for AGIs below $25k, 8.5% for AGIs $25k-50k, 10.2% for AGIs $50k-75k, 9.3% for AGIs $75k-100k, 9.9% for AGIs $100k-200k, 9.1% for AGIs over 200k)
Earned income credit: $1,864 (reported on 7.9% of returns)
Here:
$1,864
State:
$2,182
(% of AGI for various income ranges: 3.7% for AGIs below $25k, 0.7% for AGIs $25k-50k)
Percentage of individuals using paid preparers for their 2012 taxes: 54.8%
Here:
55%
State:
65%
(% for various income ranges: 46.8% for AGIs below $25k, 56.7% for AGIs $25k-50k, 55.6% for AGIs $50k-75k, 59.1% for AGIs $75k-100k, 57.1% for AGIs $100k-200k, 66.7% for AGIs over 200k)
Averages for the 2004 tax year for zip code 08829, filed in 2005:
Average Adjusted Gross Income (AGI) in 2004: $63,781 (Individual Income Tax Returns)
Here:
$63,781
State:
$64,921
Salary/wage: $61,309 (reported on 90.2% of returns)
Here:
$61,309
State:
$57,755
(% of AGI for various income ranges: 82.6% for AGIs below $10k, 69.5% for AGIs $10k-25k, 82.0% for AGIs $25k-50k, 83.8% for AGIs $50k-75k, 87.1% for AGIs $75k-100k, 89.9% for AGIs over 100k)
Taxable interest for individuals: $767 (reported on 61.2% of returns)
This zip code:
$767
New Jersey:
$2,068
(% of AGI for various income ranges: 3.7% for AGIs below $10k, 2.0% for AGIs $10k-25k, 1.3% for AGIs $25k-50k, 0.6% for AGIs $50k-75k, 0.8% for AGIs $75k-100k, 0.5% for AGIs over 100k)
Taxable dividends: $1,379 (reported on 37.3% of returns)
Here:
$1,379
State:
$3,959
(% of AGI for various income ranges: 4.0% for AGIs below $10k, 0.7% for AGIs $10k-25k, 1.3% for AGIs $25k-50k, 0.7% for AGIs $50k-75k, 0.7% for AGIs $75k-100k, 0.7% for AGIs over 100k)
Net capital gain/loss: +$2,095 (reported on 24.9% of returns)
Here:
+$2,095
State:
+$13,591
(% of AGI for various income ranges: -2.1% for AGIs below $10k, -0.5% for AGIs $10k-25k, -0.0% for AGIs $25k-50k, -0.1% for AGIs $50k-75k, 0.4% for AGIs $75k-100k, 1.6% for AGIs over 100k)
Profit/loss from business: +$12,720 (reported on 16.2% of returns)
Here:
+$12,720
State:
+$17,520
(% of AGI for various income ranges: 9.0% for AGIs below $10k, 8.6% for AGIs $10k-25k, 5.7% for AGIs $25k-50k, 2.8% for AGIs $50k-75k, 2.7% for AGIs $75k-100k, 2.5% for AGIs over 100k)
IRA payment deduction: $3,349 (reported on 3.5% of returns)
08829:
$3,349
New Jersey:
$3,270
(% of AGI for various income ranges: 0.5% for AGIs $25k-50k, 0.2% for AGIs $50k-75k, 0.2% for AGIs $75k-100k, 0.1% for AGIs over 100k)
Self-employed pension: $6,750 (reported on 1.1% of returns)
Here:
$6,750
New Jersey:
$17,258
Total itemized deductions: $19,927 (22% of AGI, reported on 60.3% of returns)
Here:
$19,927
State:
$23,924
Here:
22.2% of AGI
State:
21.1% of AGI
(% of AGI for various income ranges: 16.1% for AGIs below $10k, 20.2% for AGIs $10k-25k, 20.1% for AGIs $25k-50k, 21.2% for AGIs $50k-75k, 20.1% for AGIs $75k-100k, 17.2% for AGIs over 100k)
Charity contributions deductions: $1,992 (2% of AGI, reported on 54.7% of returns)
Here:
$1,992
State:
$3,242
Here:
2.1% of AGI
State:
2.7% of AGI
(% of AGI for various income ranges: 0.9% for AGIs $10k-25k, 1.4% for AGIs $25k-50k, 1.8% for AGIs $50k-75k, 1.8% for AGIs $75k-100k, 1.8% for AGIs over 100k)
Total tax: $9,023 (reported on 85.1% of returns)
08829:
$9,023
State:
$12,321
(% of AGI for various income ranges: 3.1% for AGIs below $10k, 5.2% for AGIs $10k-25k, 7.8% for AGIs $25k-50k, 9.5% for AGIs $50k-75k, 10.3% for AGIs $75k-100k, 15.2% for AGIs over 100k)
Earned income credit: $1,451 (reported on 5.6% of returns)
Here:
$1,451
State:
$1,711
Percentage of individuals using paid preparers for their 2004 taxes: 56.7%
Here:
57%
State:
65%
(% for various income ranges: 44.0% for AGIs below $10k, 56.7% for AGIs $10k-25k, 56.7% for AGIs $25k-50k, 62.2% for AGIs $50k-75k, 60.9% for AGIs $75k-100k, 58.3% for AGIs over 100k)
Household received Food Stamps/SNAP in the past 12 months: 108 Household did not receive Food Stamps/SNAP in the past 12 months: 1,356
Women who had a birth in the past 12 months: 10 (11 now married, 0 unmarried) Women who did not have a birth in the past 12 months: 826 (373 now married, 452 unmarried)
Housing units in zip code 08829 with a mortgage: 866 (138 second mortgage, 75 both second mortgage and home equity loan) Houses without a mortgage: 11
Median monthly owner costs for units with a mortgage: $2,338 Median monthly owner costs for units without a mortgage: $1,171
Residents with income below the poverty level in 2022:
This zip code:
11.1%
Whole state:
9.7%
Residents with income below 50% of the poverty level in 2022:
This zip code:
8.8%
Whole state:
5.2%
Median number of rooms in houses and condos:
Here:
6.8
State:
6.8
Median number of rooms in apartments:
Here:
4.3
State:
3.9
Notable locations in this zip code not listed on our city pages
Churches in zip code 08829 include: High Bridge Reformed Church (A), High Bridge United Methodist Church (B), Saint Joseph's Church (C). Display/hide their locations on the map
Size of family households: 429 2-persons, 237 3-persons, 224 4-persons, 126 5-persons
Size of nonfamily households: 355 1-person, 96 2-persons
538 married couples with children.
221 single-parent households (12 men, 209 women).
77.4% of residents of 08829 zip code speak English at home.
8.8% of residents speak Spanish at home (55% very well, 20% well, 16% not well, 8% not at all).
2.2% of residents speak other Indo-European language at home (100% very well).
6.7% of residents speak Asian or Pacific Island language at home (76% very well, 15% well, 8% not well).
4.5% of residents speak other language at home (81% very well, 19% well).
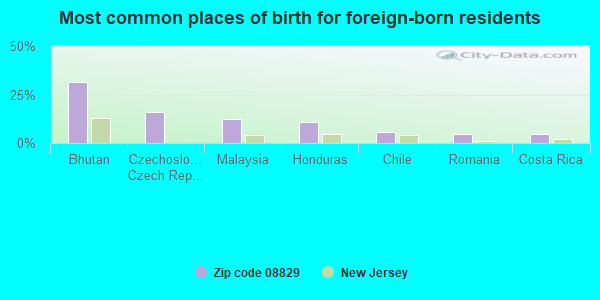
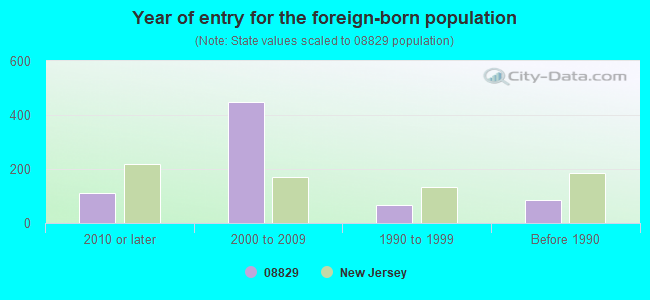
Foreign born population: 650 (18.2%) (48.2% of them are naturalized citizens)
This zip code:
18.2%
Whole state:
23.5%
32%Bhutan
16%Czechoslovakia (includes Czech Republic and Slovakia)
12%Malaysia
11%Honduras
6%Chile
5%Romania
4%Costa Rica
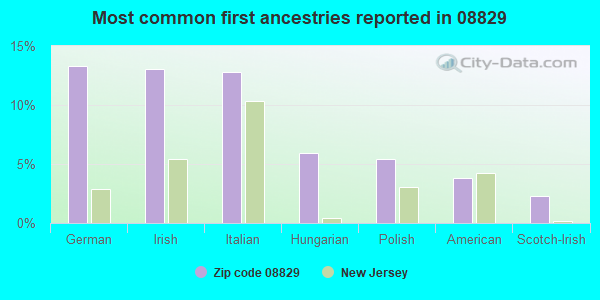
13%German
13%Irish
13%Italian
6%Hungarian
5%Polish
4%American
2%Scotch-Irish
Year of entry for the foreign-born population
1102010 or later
4472000 to 2009
681990 to 1999
84Before 1990
Facilities with environmental interests located in this zip code:
HIGH BRIDGE BORO BD OF ED HIGH BRIDGE MIDDLE SCHOOL (50 THOMAS ST in HIGH BRIDGE, NJ)
(National Center for Education Statistics) - STATE ID-055 STATE MASTER (New Jersey environmental info) - NJEMS-012866, STATE CLEANUP SITE, NJEMS-80352, AIR PROGRAM Small Quantity Generators, between 100 kg and 1000 kg of hazardous waste/month (Resource Conservation and Recovery Act (tracking hazardous waste)) - notification Business SIC classification: ELEMENTARY AND SECONDARY SCHOOLS Organizations: HIGH BRIDGE BD OF ED (CONTACT/OWNER)
Alternative names: HIGH BRIDGE BD OF ED MIDDLE SCHOOL
HIGH BRIDGE BORO DPW (71 MAIN ST in HIGH BRIDGE, NJ)
STATE MASTER (New Jersey environmental info) - NJEMS-202005, National Pollutant Discharge Elimination System Permit, NJEMS-211318, REFUSE DISPOSAL National Pollutant Discharge Elimination System NON-MAJOR (Tracking pollutant discharge elimination systems) - permit
GLASSMAN HIGH VOLTAGE OMC (124 W. MAIN ST. in HIGH BRIDGE, NJ)
STATE MASTER (New Jersey environmental info) - NJEMS-43399400000, EPCRA, RIGHT-TO-KNOW - RPPR & P2 PLANNING TRI REPORTER (Tracking of toxic chemicals releasing facilities) - ICIS-, ENFORCEMENT/COMPLIANCE ACTIVITY Business SIC classification: ELECTRONIC COMPONENTS Alternative names: GLASSMAN HIGH VOLTAGE INC.
HIGH BRIDGE BORO BD OF ED HIGH BRIDGE ELEMENTARY SCHOOL (40 FAIRVIEW AVENUE in HIGH BRIDGE, NJ)
COMPLIANCE ACTIVITY (Tracking inspections of insecticide, fungicide, and rodenticide, and toxic substances) STATE MASTER (New Jersey environmental info) - NJEMS-012867, STATE CLEANUP SITE, NJEMS-80344, AIR PROGRAM Business SIC classification: ELEMENTARY AND SECONDARY SCHOOLS Alternative names: HIGH BRIDGE SCHOOL DISTRICT
EXACT LEVEL & TOOL MFG CO (100 W MAIN ST in HIGH BRIDGE, NJ)
STATE MASTER (New Jersey environmental info) - NJEMS-35504, AIR PROGRAM, NJEMS-80220, NJEMS-G000001912, STATE CLEANUP SITE Small Quantity Generators, between 100 kg and 1000 kg of hazardous waste/month (Resource Conservation and Recovery Act (tracking hazardous waste)) Business NAICS classification: HAND AND EDGE TOOL MANUFACTURING. Organizations: ELAT INC
HIGH BRIDGE ELEM (50 THOMAS STREET in HIGH BRIDGE, NJ)
(National Center for Education Statistics) - STATE ID-060 Organizations: HIGH BRIDGE BORO (SCHOOL DISTRICT)
BORO OF HIGH BRIDGE MUN GARAGE (W MAIN ST in HIGH BRIDGE, NJ)
HIGH BRIDGE GARAGE HUNTERDON CO (COUNTY RTE 513 in HIGH BRIDGE, NJ)
(Resource Conservation and Recovery Act (tracking hazardous waste))
HOFFMAN CHATTLES (76 MAIN ST in HIGH BRIDGE, NJ)
Small Quantity Generators, between 100 kg and 1000 kg of hazardous waste/month (Resource Conservation and Recovery Act (tracking hazardous waste)) - notification Organizations: CHATTLES HOFFMAN (CONTACT/OWNER)
HIGH BRIDGE BOARD OF ED (40 ANNEX FAIRVIEW AVE in HIGH BRIDGE, NJ)
COMPLIANCE ACTIVITY (Tracking inspections of insecticide, fungicide, and rodenticide, and toxic substances)
Housing units lacking complete plumbing facilities: 0.3% Housing units lacking complete kitchen facilities: 1.6%
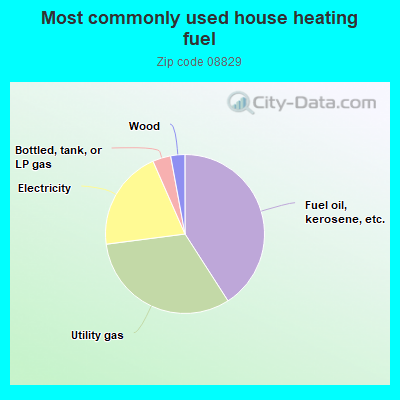
41.0%Fuel oil, kerosene, etc.
32.1%Utility gas
20.5%Electricity
3.7%Bottled, tank, or LP gas
2.9%Wood
Population in 1990: 3,886.
Place of birth for U.S.-born residents:
This state: 1,876
Northeast: 619
Midwest: 129
South: 163
West: 64
59% of the 08829 zip code residents lived in the same house 5 years ago. Out of people who lived in different houses, 43% lived in this county. Out of people who lived in different counties, 50% lived in New Jersey.
93% of the 08829 zip code residents lived in the same house 1 year ago. Out of people who lived in different houses, 7% moved from this county. Out of people who lived in different houses, 85% moved from different county within same state. Out of people who lived in different houses, 3% moved from different state.
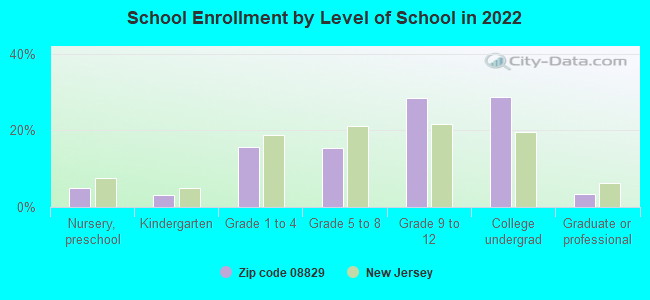
Private vs. public school enrollment:
Students in private schools in grades 1 to 8 (elementary and middle school): 44
Here:
15.7%
New Jersey:
12.3%
Students in private schools in grades 9 to 12 (high school): 17
Here:
6.8%
New Jersey:
13.1%
Students in private undergraduate colleges: 73
Here:
28.7%
New Jersey:
33.2%
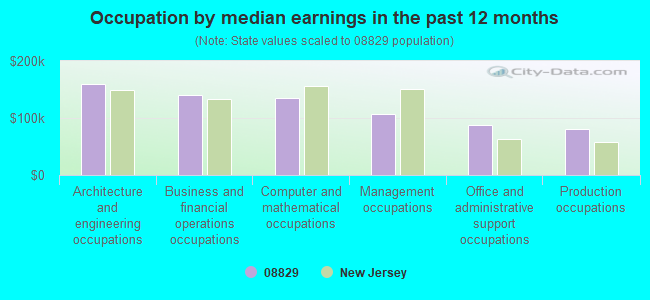
Occupation by median earnings in the past 12 months ($)
160,284Architecture and engineering occupations
139,498Business and financial operations occupations
135,787Computer and mathematical occupations
106,919Management occupations
87,981Office and administrative support occupations
80,759Production occupations
Companies with federal contracts located in this zip code:
PENN-BOWER INC (132 W MAIN STREET in HIGH BRIDGE, NJ; small business)
$70,000 with Army for Maintenance, Repair and Rebuilding of Equipment -- Instruments and Laboratory Equipment. Signed on 2004-08-31. Completion date: 2005-12-31.
CUSTOM ALLOY CORPORATION (3 WASHINGTON AVE STE 5 in HIGH BRIDGE, NJ; small business)
$31,749 with Navy for Torpedo Inert Components. Signed on 2006-02-08. Completion date: 2006-09-29.
Top industries in this zip code by the number of employees in 2005:
Finance and Insurance: Financial Transactions Processing, Reserve, and Clearinghouse Activities (50-99 employees: 1 establishment)
Other Services (except Public Administration): Religious Organizations (10-19: 1, 1-4: 3)
Construction: Siding Contractors (10-19: 1)
Construction: Commercial and Institutional Building Construction (10-19: 1)
Educational Services: Professional and Management Development Training (10-19: 1)
Fatal accident statistics in 2010:
Fatal accident count: 1
Vehicles involved in fatal accidents: 1
Fatal accidents caused by drunken drivers: 1
Fatalities: 1
Persons involved in fatal accidents: 1
Pedestrians involved in fatal accidents: 0
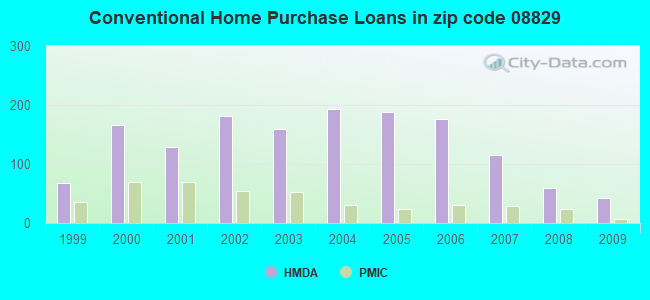
Home Mortgage Disclosure Act Aggregated Statistics For Year 2009 (Based on 2 full tracts)
A) FHA, FSA/RHS & VA Home Purchase Loans
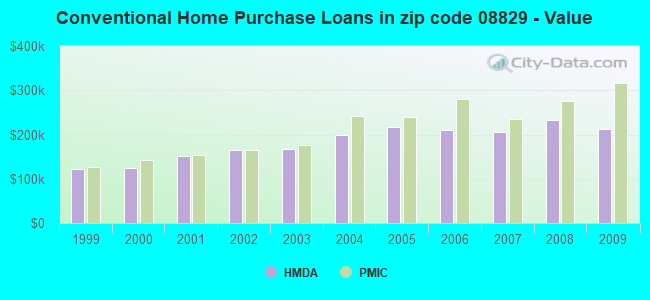
B) Conventional Home Purchase Loans
C) Refinancings
D) Home Improvement Loans
F) Non-occupant Loans on < 5 Family Dwellings (A B C & D)
G) Loans On Manufactured Home Dwelling (A B C & D)
Number
Average Value
Number
Average Value
Number
Average Value
Number
Average Value
Number
Average Value
Number
Average Value
LOANS ORIGINATED
28
$240,952
42
$211,624
230
$210,054
20
$90,982
4
$149,970
2
$111,980
APPLICATIONS APPROVED, NOT ACCEPTED
0
$0
4
$338,932
26
$201,883
0
$0
0
$0
0
$0
APPLICATIONS DENIED
4
$154,970
2
$124,975
104
$210,862
20
$58,588
2
$324,935
0
$0
APPLICATIONS WITHDRAWN
10
$215,157
10
$189,962
52
$234,415
2
$14,995
0
$0
0
$0
FILES CLOSED FOR INCOMPLETENESS
4
$138,472
2
$79,985
16
$199,585
2
$74,985
2
$79,985
0
$0
Aggregated Statistics For Year 2008 (Based on 2 full tracts)
A) FHA, FSA/RHS & VA Home Purchase Loans
B) Conventional Home Purchase Loans
C) Refinancings
D) Home Improvement Loans
E) Loans on Dwellings For 5+ Families
F) Non-occupant Loans on < 5 Family Dwellings (A B C & D)
G) Loans On Manufactured Home Dwelling (A B C & D)
Number
Average Value
Number
Average Value
Number
Average Value
Number
Average Value
Number
Average Value
Number
Average Value
Number
Average Value
LOANS ORIGINATED
12
$231,453
60
$233,187
130
$180,287
18
$90,315
2
$324,935
4
$206,458
0
$0
APPLICATIONS APPROVED, NOT ACCEPTED
2
$191,960
16
$213,708
26
$208,727
8
$46,741
0
$0
4
$123,475
0
$0
APPLICATIONS DENIED
2
$157,970
8
$203,959
74
$232,035
32
$55,364
0
$0
6
$151,970
2
$157,970
APPLICATIONS WITHDRAWN
2
$294,940
10
$217,157
28
$218,314
6
$51,657
0
$0
0
$0
0
$0
FILES CLOSED FOR INCOMPLETENESS
0
$0
4
$182,962
0
$0
2
$14,995
0
$0
0
$0
0
$0
Aggregated Statistics For Year 2007 (Based on 2 full tracts)
A) FHA, FSA/RHS & VA Home Purchase Loans
B) Conventional Home Purchase Loans
C) Refinancings
D) Home Improvement Loans
F) Non-occupant Loans on < 5 Family Dwellings (A B C & D)
G) Loans On Manufactured Home Dwelling (A B C & D)
Number
Average Value
Number
Average Value
Number
Average Value
Number
Average Value
Number
Average Value
Number
Average Value
LOANS ORIGINATED
8
$217,956
116
$204,528
148
$186,611
34
$51,519
8
$280,444
2
$130,975
APPLICATIONS APPROVED, NOT ACCEPTED
0
$0
24
$130,058
38
$209,379
6
$68,653
4
$74,985
2
$121,975
APPLICATIONS DENIED
0
$0
14
$178,964
118
$184,827
36
$31,105
6
$139,305
6
$108,312
APPLICATIONS WITHDRAWN
0
$0
20
$184,563
66
$203,202
4
$157,968
0
$0
2
$119,975
FILES CLOSED FOR INCOMPLETENESS
0
$0
2
$30,995
18
$209,958
0
$0
2
$399,920
0
$0
Aggregated Statistics For Year 2006 (Based on 2 full tracts)
A) FHA, FSA/RHS & VA Home Purchase Loans
B) Conventional Home Purchase Loans
C) Refinancings
D) Home Improvement Loans
E) Loans on Dwellings For 5+ Families
F) Non-occupant Loans on < 5 Family Dwellings (A B C & D)
G) Loans On Manufactured Home Dwelling (A B C & D)
Number
Average Value
Number
Average Value
Number
Average Value
Number
Average Value
Number
Average Value
Number
Average Value
Number
Average Value
LOANS ORIGINATED
6
$237,618
176
$211,196
194
$167,430
50
$46,511
2
$1,087,780
6
$212,623
2
$69,985
APPLICATIONS APPROVED, NOT ACCEPTED
2
$194,960
18
$248,839
54
$200,071
14
$63,416
0
$0
2
$256,950
0
$0
APPLICATIONS DENIED
2
$262,945
18
$178,076
66
$190,659
30
$61,321
0
$0
8
$85,982
4
$144,970
APPLICATIONS WITHDRAWN
2
$240,950
26
$224,647
62
$196,896
6
$39,992
0
$0
4
$248,950
0
$0
FILES CLOSED FOR INCOMPLETENESS
0
$0
8
$310,188
26
$175,119
2
$216,955
0
$0
0
$0
0
$0
Aggregated Statistics For Year 2005 (Based on 2 full tracts)
A) FHA, FSA/RHS & VA Home Purchase Loans
B) Conventional Home Purchase Loans
C) Refinancings
D) Home Improvement Loans
F) Non-occupant Loans on < 5 Family Dwellings (A B C & D)
G) Loans On Manufactured Home Dwelling (A B C & D)
Number
Average Value
Number
Average Value
Number
Average Value
Number
Average Value
Number
Average Value
Number
Average Value
LOANS ORIGINATED
6
$242,952
188
$217,222
268
$170,391
54
$44,028
14
$180,535
0
$0
APPLICATIONS APPROVED, NOT ACCEPTED
0
$0
24
$225,705
54
$154,784
8
$58,989
0
$0
0
$0
APPLICATIONS DENIED
0
$0
26
$215,649
124
$177,884
38
$37,519
6
$142,972
4
$124,975
APPLICATIONS WITHDRAWN
0
$0
30
$191,695
82
$199,424
26
$88,367
4
$268,448
0
$0
FILES CLOSED FOR INCOMPLETENESS
0
$0
8
$278,944
80
$209,058
6
$29,660
2
$313,935
0
$0
Aggregated Statistics For Year 2004 (Based on 2 full tracts)
A) FHA, FSA/RHS & VA Home Purchase Loans
B) Conventional Home Purchase Loans
C) Refinancings
D) Home Improvement Loans
F) Non-occupant Loans on < 5 Family Dwellings (A B C & D)
G) Loans On Manufactured Home Dwelling (A B C & D)
Number
Average Value
Number
Average Value
Number
Average Value
Number
Average Value
Number
Average Value
Number
Average Value
LOANS ORIGINATED
18
$218,956
194
$199,805
238
$166,168
64
$69,330
22
$182,327
0
$0
APPLICATIONS APPROVED, NOT ACCEPTED
0
$0
18
$236,842
46
$124,236
8
$45,241
2
$242,950
2
$10,000
APPLICATIONS DENIED
0
$0
16
$219,706
82
$160,870
50
$38,432
8
$132,224
6
$71,652
APPLICATIONS WITHDRAWN
4
$115,978
22
$227,136
74
$172,452
18
$53,656
4
$264,948
0
$0
FILES CLOSED FOR INCOMPLETENESS
0
$0
0
$0
24
$169,633
0
$0
4
$139,972
0
$0
Aggregated Statistics For Year 2003 (Based on 2 full tracts)
A) FHA, FSA/RHS & VA Home Purchase Loans
B) Conventional Home Purchase Loans
C) Refinancings
D) Home Improvement Loans
E) Loans on Dwellings For 5+ Families
F) Non-occupant Loans on < 5 Family Dwellings (A B C & D)
Number
Average Value
Number
Average Value
Number
Average Value
Number
Average Value
Number
Average Value
Number
Average Value
LOANS ORIGINATED
16
$190,462
160
$166,642
698
$152,729
24
$57,239
4
$264,948
26
$135,204
APPLICATIONS APPROVED, NOT ACCEPTED
0
$0
30
$184,763
102
$169,339
2
$24,995
0
$0
2
$149,970
APPLICATIONS DENIED
0
$0
14
$194,390
128
$156,203
16
$17,871
0
$0
6
$181,963
APPLICATIONS WITHDRAWN
2
$277,945
18
$154,858
104
$167,409
4
$69,985
0
$0
4
$164,968
FILES CLOSED FOR INCOMPLETENESS
0
$0
10
$163,967
16
$213,208
0
$0
0
$0
0
$0
Aggregated Statistics For Year 2002 (Based on 2 full tracts)
A) FHA, FSA/RHS & VA Home Purchase Loans
B) Conventional Home Purchase Loans
C) Refinancings
D) Home Improvement Loans
E) Loans on Dwellings For 5+ Families
F) Non-occupant Loans on < 5 Family Dwellings (A B C & D)
Number
Average Value
Number
Average Value
Number
Average Value
Number
Average Value
Number
Average Value
Number
Average Value
LOANS ORIGINATED
12
$153,802
182
$164,209
428
$137,449
34
$58,753
0
$0
18
$132,973
APPLICATIONS APPROVED, NOT ACCEPTED
2
$222,955
16
$181,839
42
$130,974
18
$47,435
0
$0
2
$203,960
APPLICATIONS DENIED
0
$0
16
$169,966
96
$126,350
20
$31,994
2
$39,990
6
$178,965
APPLICATIONS WITHDRAWN
2
$110,980
14
$140,258
86
$127,626
14
$19,710
0
$0
2
$127,975
FILES CLOSED FOR INCOMPLETENESS
0
$0
8
$131,474
14
$135,973
4
$29,995
0
$0
0
$0
Aggregated Statistics For Year 2001 (Based on 2 full tracts)
A) FHA, FSA/RHS & VA Home Purchase Loans
B) Conventional Home Purchase Loans
C) Refinancings
D) Home Improvement Loans
F) Non-occupant Loans on < 5 Family Dwellings (A B C & D)
Number
Average Value
Number
Average Value
Number
Average Value
Number
Average Value
Number
Average Value
LOANS ORIGINATED
28
$141,472
128
$150,907
244
$138,603
42
$25,852
10
$124,975
APPLICATIONS APPROVED, NOT ACCEPTED
2
$79,985
8
$162,468
46
$105,370
12
$26,328
0
$0
APPLICATIONS DENIED
6
$128,308
16
$159,718
98
$102,000
14
$50,847
2
$192,960
APPLICATIONS WITHDRAWN
4
$155,470
12
$145,304
56
$118,119
6
$41,992
4
$83,482
FILES CLOSED FOR INCOMPLETENESS
0
$0
0
$0
18
$80,651
2
$63,985
0
$0
Aggregated Statistics For Year 2000 (Based on 2 full tracts)
A) FHA, FSA/RHS & VA Home Purchase Loans
B) Conventional Home Purchase Loans
C) Refinancings
D) Home Improvement Loans
F) Non-occupant Loans on < 5 Family Dwellings (A B C & D)
Number
Average Value
Number
Average Value
Number
Average Value
Number
Average Value
Number
Average Value
LOANS ORIGINATED
28
$130,831
166
$124,710
58
$91,809
16
$27,744
6
$40,658
APPLICATIONS APPROVED, NOT ACCEPTED
2
$108,980
18
$113,199
20
$100,480
12
$20,496
0
$0
APPLICATIONS DENIED
12
$114,311
26
$111,747
42
$69,081
10
$32,593
0
$0
APPLICATIONS WITHDRAWN
4
$94,980
18
$134,751
26
$75,754
10
$29,994
2
$10,000
FILES CLOSED FOR INCOMPLETENESS
0
$0
6
$162,302
26
$130,435
0
$0
0
$0
Aggregated Statistics For Year 1999 (Based on 1 full tract)
A) FHA, FSA/RHS & VA Home Purchase Loans
B) Conventional Home Purchase Loans
C) Refinancings
D) Home Improvement Loans
F) Non-occupant Loans on < 5 Family Dwellings (A B C & D)
Detailed PMIC statistics for the following Tracts:0109.00
2002 - 2018 National Fire Incident Reporting System (NFIRS) incidents
According to the data from the years 2002 - 2018 the average number of fire incidents per year is 19. The highest number of reported fires - 39 took place in 2007, and the least - 0 in 2003. The data has a decreasing trend.
When looking into fire subcategories, the most incidents belonged to: Structure Fires (60.0%), and Outside Fires (19.4%).
Fire incident types reported to NFIRS in Zip Code 08829


 Nearest zip codes: 08801, 08809, 08826, 08827, 08833, 07830.


 According to the data from the years 2002 - 2018 the average number of fire incidents per year is 19. The highest number of reported fires - 39 took place in 2007, and the least - 0 in 2003. The data has a decreasing trend.
 When looking into fire subcategories, the most incidents belonged to: Structure Fires (60.0%), and Outside Fires (19.4%).