Estimated zip code population in 2022: 14,520 Zip code population in 2010: 14,096 Zip code population in 2000: 11,669
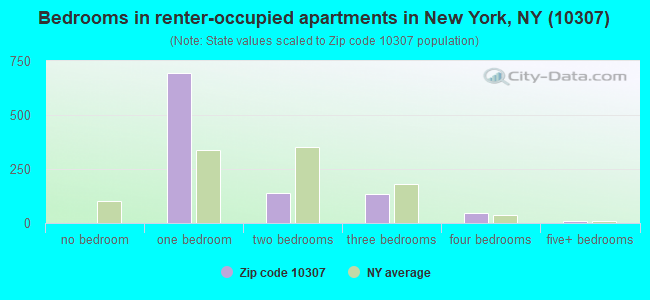
Houses and condos: 5,529 Renter-occupied apartments: 1,027
% of renters here:
19%
State:
46%
March 2022 cost of living index in zip code 10307: 146.3 (very high, U.S. average is 100)
Land area: 2.0 sq. mi. Water area: 0.0 sq. mi.
Population density: 7,400 people per square mile
(high).
OSM Map
General Map
Google Map
MSN Map
OSM Map
General Map
Google Map
MSN Map
OSM Map
General Map
Google Map
MSN Map
OSM Map
General Map
Google Map
MSN Map
Please wait while loading the map...
Real estate property taxes paid for housing units in 2022:
This zip code:
0.9% ($7,716)
New York:
1.5% ($6,180)
Median real estate property taxes paid for housing units with mortgages in 2022: $7,663 (0.9%) Median real estate property taxes paid for housing units with no mortgage in 2022: $7,882 (1.0%)
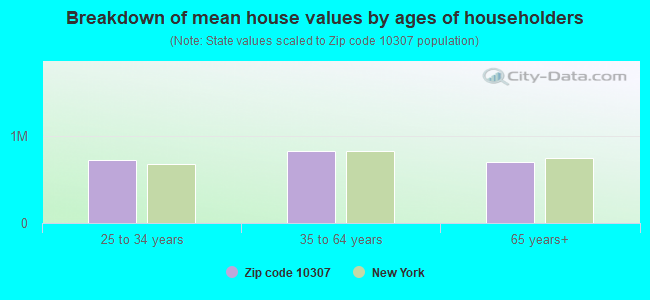
Estimated median house/condo value in 2022: $818,521
10307:
$818,521
New York:
$400,400
Median resident age:
This zip code:
43.4 years
New York median age:
40.0 years
Average household size:
This zip code:
2.7 people
New York:
2.5 people
Averages for the 2020 tax year for zip code 10307, filed in 2021:
Average Adjusted Gross Income (AGI) in 2020: $100,173 (Individual Income Tax Returns)
Here:
$100,173
State:
$90,930
Salary/wage: $86,340 (reported on 81.6% of returns)
Here:
$86,340
State:
$72,104
(% of AGI for various income ranges: 1094.3% for AGIs below $25k, 3590.0% for AGIs $25k-50k, 6206.1% for AGIs $50k-75k, 9528.4% for AGIs $75k-100k, 17559.4% for AGIs $100k-200k, 75412.8% for AGIs over 200k)
Taxable interest for individuals: $1,692 (reported on 45.7% of returns)
This zip code:
$1,692
New York:
$3,075
(% of AGI for various income ranges: 36.5% for AGIs below $25k, 50.1% for AGIs $25k-50k, 67.0% for AGIs $50k-75k, 108.8% for AGIs $75k-100k, 153.0% for AGIs $100k-200k, 830.0% for AGIs over 200k)
Ordinary dividends: $3,493 (reported on 27.9% of returns)
Here:
$3,493
State:
$11,095
(% of AGI for various income ranges: 31.8% for AGIs below $25k, 60.7% for AGIs $25k-50k, 87.7% for AGIs $50k-75k, 94.7% for AGIs $75k-100k, 208.1% for AGIs $100k-200k, 1132.8% for AGIs over 200k)
Net capital gain/loss in AGI: +$11,222 (reported on 26.6% of returns)
Here:
+$11,222
State:
+$44,925
(% of AGI for various income ranges: 18.1% for AGIs below $25k, 57.0% for AGIs $25k-50k, 90.5% for AGIs $50k-75k, 177.1% for AGIs $75k-100k, 336.9% for AGIs $100k-200k, 6024.4% for AGIs over 200k)
Profit/loss from business: +$27,293 (reported on 15.3% of returns)
Here:
+$27,293
State:
+$14,940
(% of AGI for various income ranges: 133.4% for AGIs below $25k, 164.6% for AGIs $25k-50k, 154.5% for AGIs $50k-75k, 302.2% for AGIs $75k-100k, 450.6% for AGIs $100k-200k, 7583.6% for AGIs over 200k)
Taxable individual retirement arrangement distribution: $18,687 (reported on 8.1% of returns)
10307:
$18,687
New York:
$19,609
(% of AGI for various income ranges: 53.0% for AGIs below $25k, 90.0% for AGIs $25k-50k, 164.5% for AGIs $50k-75k, 373.3% for AGIs $75k-100k, 401.7% for AGIs $100k-200k, 936.8% for AGIs over 200k)
Self-employed (Keogh) retirement plans: $41,200 (reported on 0.6% of returns)
10307:
$41,200
New York:
$32,497
(% of AGI for various income ranges: 659.2% for AGIs over 200k)
Total itemized deductions: $30,912 (reported on 22.5% of returns)
Here:
$30,912
State:
$39,326
(% of AGI for various income ranges: 118.9% for AGIs below $25k, 280.1% for AGIs $25k-50k, 588.5% for AGIs $50k-75k, 993.9% for AGIs $75k-100k, 1955.3% for AGIs $100k-200k, 6736.4% for AGIs over 200k)
Charity contributions: $4,444 (reported on 20.3% of returns)
Here:
$4,444
State:
$15,420
(% of AGI for various income ranges: 8.7% for AGIs below $25k, 21.6% for AGIs $25k-50k, 61.1% for AGIs $50k-75k, 102.4% for AGIs $75k-100k, 219.8% for AGIs $100k-200k, 1167.2% for AGIs over 200k)
Taxes paid: $9,376 (reported on 22.3% of returns)
10307:
$9,376
State:
$9,183
(% of AGI for various income ranges: 30.4% for AGIs below $25k, 90.5% for AGIs $25k-50k, 195.0% for AGIs $50k-75k, 362.0% for AGIs $75k-100k, 638.5% for AGIs $100k-200k, 1680.0% for AGIs over 200k)
Earned income credit: $1,775 (reported on 7.6% of returns)
Here:
$1,775
State:
$2,138
(% of AGI for various income ranges: 52.1% for AGIs below $25k, 46.4% for AGIs $25k-50k)
Percentage of individuals using paid preparers for their 2020 taxes: 95.2%
Here:
95%
State:
95%
(% for various income ranges: 94.4% for AGIs below $25k, 94.6% for AGIs $25k-50k, 95.7% for AGIs $50k-75k, 96.1% for AGIs $75k-100k, 94.8% for AGIs $100k-200k, 97.2% for AGIs over 200k)
Averages for the 2012 tax year for zip code 10307, filed in 2013:
Average Adjusted Gross Income (AGI) in 2012: $82,911 (Individual Income Tax Returns)
Here:
$82,911
State:
$77,088
Salary/wage: $74,381 (reported on 84.0% of returns)
Here:
$74,381
State:
$60,593
(% of AGI for various income ranges: 67.8% for AGIs below $25k, 75.9% for AGIs $25k-50k, 74.4% for AGIs $50k-75k, 76.8% for AGIs $75k-100k, 81.0% for AGIs $100k-200k, 69.4% for AGIs over 200k)
Taxable interest for individuals: $1,794 (reported on 50.5% of returns)
This zip code:
$1,794
New York:
$3,125
(% of AGI for various income ranges: 2.0% for AGIs below $25k, 0.8% for AGIs $25k-50k, 0.9% for AGIs $50k-75k, 0.8% for AGIs $75k-100k, 0.6% for AGIs $100k-200k, 1.8% for AGIs over 200k)
Ordinary dividends: $2,825 (reported on 28.0% of returns)
Here:
$2,825
State:
$10,299
(% of AGI for various income ranges: 2.1% for AGIs below $25k, 1.2% for AGIs $25k-50k, 0.9% for AGIs $50k-75k, 0.9% for AGIs $75k-100k, 0.7% for AGIs $100k-200k, 1.1% for AGIs over 200k)
Net capital gain/loss in AGI: +$6,532 (reported on 21.5% of returns)
Here:
+$6,532
State:
+$42,474
(% of AGI for various income ranges: 0.3% for AGIs $100k-200k, 5.3% for AGIs over 200k)
Profit/loss from business: +$24,091 (reported on 14.1% of returns)
Here:
+$24,091
State:
+$16,168
(% of AGI for various income ranges: 10.0% for AGIs below $25k, 3.9% for AGIs $25k-50k, 2.8% for AGIs $50k-75k, 1.9% for AGIs $75k-100k, 2.2% for AGIs $100k-200k, 6.8% for AGIs over 200k)
Taxable individual retirement arrangement distribution: $14,328 (reported on 8.1% of returns)
10307:
$14,328
New York:
$17,621
(% of AGI for various income ranges: 2.6% for AGIs below $25k, 1.9% for AGIs $25k-50k, 1.8% for AGIs $50k-75k, 1.8% for AGIs $75k-100k, 1.5% for AGIs $100k-200k, 0.8% for AGIs over 200k)
Self-employment retirement plans: $20,133 (reported on 1.0% of returns)
10307:
$20,133
New York:
$27,330
(% of AGI for various income ranges: 0.8% for AGIs $75k-100k, 0.4% for AGIs over 200k)
Total itemized deductions: $33,860 (26% of AGI, reported on 55.0% of returns)
Here:
$33,860
State:
$34,985
Here:
26.1% of AGI
State:
21.3% of AGI
(% of AGI for various income ranges: 21.3% for AGIs below $25k, 16.8% for AGIs $25k-50k, 23.0% for AGIs $50k-75k, 26.2% for AGIs $75k-100k, 24.9% for AGIs $100k-200k, 19.5% for AGIs over 200k)
Charity contributions: $2,631 (reported on 49.4% of returns)
Here:
$2,631
State:
$5,572
(% of AGI for various income ranges: 0.8% for AGIs below $25k, 1.4% for AGIs $25k-50k, 1.9% for AGIs $50k-75k, 2.0% for AGIs $75k-100k, 1.9% for AGIs $100k-200k, 1.1% for AGIs over 200k)
Taxes paid: $16,122 (reported on 55.0% of returns)
10307:
$16,122
State:
$18,656
(% of AGI for various income ranges: 4.4% for AGIs below $25k, 5.4% for AGIs $25k-50k, 8.8% for AGIs $50k-75k, 10.6% for AGIs $75k-100k, 11.4% for AGIs $100k-200k, 12.6% for AGIs over 200k)
Earned income credit: $1,983 (reported on 9.5% of returns)
Here:
$1,983
State:
$2,230
(% of AGI for various income ranges: 4.5% for AGIs below $25k, 0.7% for AGIs $25k-50k)
Percentage of individuals using paid preparers for their 2012 taxes: 79.6%
Here:
80%
State:
66%
(% for various income ranges: 74.5% for AGIs below $25k, 76.8% for AGIs $25k-50k, 80.0% for AGIs $50k-75k, 80.6% for AGIs $75k-100k, 85.6% for AGIs $100k-200k, 89.5% for AGIs over 200k)
Averages for the 2004 tax year for zip code 10307, filed in 2005:
Average Adjusted Gross Income (AGI) in 2004: $66,835 (Individual Income Tax Returns)
Here:
$66,835
State:
$59,519
Salary/wage: $63,055 (reported on 84.7% of returns)
Here:
$63,055
State:
$50,673
(% of AGI for various income ranges: 162.5% for AGIs below $10k, 69.2% for AGIs $10k-25k, 82.1% for AGIs $25k-50k, 83.7% for AGIs $50k-75k, 85.9% for AGIs $75k-100k, 76.2% for AGIs over 100k)
Taxable interest for individuals: $1,572 (reported on 64.3% of returns)
This zip code:
$1,572
New York:
$2,377
(% of AGI for various income ranges: 11.3% for AGIs below $10k, 2.5% for AGIs $10k-25k, 1.6% for AGIs $25k-50k, 1.3% for AGIs $50k-75k, 0.7% for AGIs $75k-100k, 1.6% for AGIs over 100k)
Taxable dividends: $1,606 (reported on 34.9% of returns)
Here:
$1,606
State:
$5,394
(% of AGI for various income ranges: 6.8% for AGIs below $10k, 1.5% for AGIs $10k-25k, 0.9% for AGIs $25k-50k, 0.7% for AGIs $50k-75k, 0.7% for AGIs $75k-100k, 0.8% for AGIs over 100k)
Net capital gain/loss: +$6,409 (reported on 28.3% of returns)
Here:
+$6,409
State:
+$23,581
(% of AGI for various income ranges: -8.2% for AGIs below $10k, -0.7% for AGIs $10k-25k, -0.5% for AGIs $25k-50k, 0.4% for AGIs $50k-75k, 1.7% for AGIs $75k-100k, 4.8% for AGIs over 100k)
Profit/loss from business: +$20,251 (reported on 13.1% of returns)
Here:
+$20,251
State:
+$13,809
(% of AGI for various income ranges: 11.1% for AGIs below $10k, 7.7% for AGIs $10k-25k, 3.4% for AGIs $25k-50k, 1.3% for AGIs $50k-75k, 1.4% for AGIs $75k-100k, 5.4% for AGIs over 100k)
IRA payment deduction: $3,611 (reported on 2.9% of returns)
10307:
$3,611
New York:
$3,115
(% of AGI for various income ranges: 0.2% for AGIs $10k-25k, 0.3% for AGIs $25k-50k, 0.2% for AGIs $50k-75k, 0.2% for AGIs $75k-100k, 0.1% for AGIs over 100k)
Self-employed pension: $20,884 (reported on 0.8% of returns)
Here:
$20,884
New York:
$19,016
Total itemized deductions: $27,263 (27% of AGI, reported on 58.7% of returns)
Here:
$27,263
State:
$25,864
Here:
27.4% of AGI
State:
21.9% of AGI
(% of AGI for various income ranges: 26.7% for AGIs below $10k, 16.8% for AGIs $10k-25k, 23.6% for AGIs $25k-50k, 26.8% for AGIs $50k-75k, 27.6% for AGIs $75k-100k, 22.5% for AGIs over 100k)
Charity contributions deductions: $2,895 (3% of AGI, reported on 55.9% of returns)
Here:
$2,895
State:
$4,439
Here:
2.8% of AGI
State:
3.6% of AGI
(% of AGI for various income ranges: 1.4% for AGIs below $10k, 1.4% for AGIs $10k-25k, 2.8% for AGIs $25k-50k, 2.9% for AGIs $50k-75k, 3.0% for AGIs $75k-100k, 2.1% for AGIs over 100k)
Total tax: $10,475 (reported on 81.2% of returns)
10307:
$10,475
State:
$11,730
(% of AGI for various income ranges: 4.8% for AGIs below $10k, 4.9% for AGIs $10k-25k, 7.0% for AGIs $25k-50k, 7.9% for AGIs $50k-75k, 8.6% for AGIs $75k-100k, 17.4% for AGIs over 100k)
Earned income credit: $1,510 (reported on 6.8% of returns)
Here:
$1,510
State:
$1,757
Percentage of individuals using paid preparers for their 2004 taxes: 77.8%
Here:
78%
State:
67%
(% for various income ranges: 69.4% for AGIs below $10k, 76.0% for AGIs $10k-25k, 75.9% for AGIs $25k-50k, 80.7% for AGIs $50k-75k, 82.4% for AGIs $75k-100k, 83.1% for AGIs over 100k)
Household received Food Stamps/SNAP in the past 12 months: 293 Household did not receive Food Stamps/SNAP in the past 12 months: 4,973
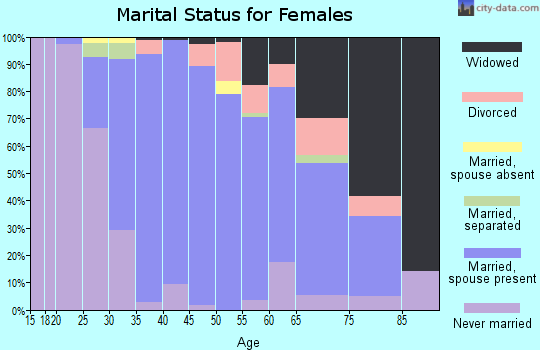
Women who had a birth in the past 12 months: 185 (159 now married, 24 unmarried) Women who did not have a birth in the past 12 months: 2,779 (1,279 now married, 1,486 unmarried)
Housing units in zip code 10307 with a mortgage: 2,864 (381 second mortgage, 280 both second mortgage and home equity loan) Houses without a mortgage: 39
Median monthly owner costs for units with a mortgage: $3,555 Median monthly owner costs for units without a mortgage: $1,154
Residents with income below the poverty level in 2022:
This zip code:
4.8%
Whole state:
14.3%
Residents with income below 50% of the poverty level in 2022:
This zip code:
2.5%
Whole state:
6.8%
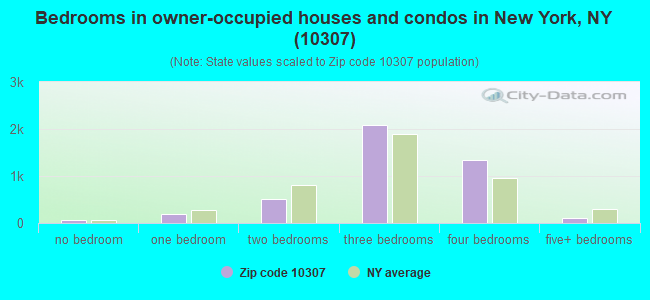
Median number of rooms in houses and condos:
Here:
6.8
State:
6.3
Median number of rooms in apartments:
Here:
3.1
State:
3.8
Notable locations in this zip code not listed on our city pages
Notable locations in zip code 10307: Port Atlantic Marina (A), Tottenville Branch New York Public Library (B), Fire Department New York Engine 151 Ladder 76 (C), New York Ladder Company 76 (D), Volunteers of America Childrens Home (E). Display/hide their locations on the map
Churches in zip code 10307 include: Saint Paul's Methodist Church (A), Church of Our Lady Help of Christians (B), South Baptist Church (C), Evangelical Free Church (D), Faith Assembly of God Church (E), Bethel United Methodist Church (F), Congregation Ahavath Israel (G). Display/hide their locations on the map
Parks in zip code 10307 include: Larry De Young Field (1), Hybrid Oaks Woods Park (2), Joline Pool Playground (3), Conference House Park (4). Display/hide their locations on the map
In group quarters: 55 (-1 institutionalized population)
Size of family households: 1,277 2-persons, 905 3-persons, 1,124 4-persons, 425 5-persons, 40 6-persons, 107 7-or-more-persons
Size of nonfamily households: 1,263 1-person, 131 2-persons
2,518 married couples with children.
373 single-parent households (160 men, 213 women).
81.1% of residents of 10307 zip code speak English at home.
1.4% of residents speak Spanish at home (61% very well, 25% well, 3% not well, 11% not at all).
14.0% of residents speak other Indo-European language at home (73% very well, 15% well, 10% not well, 2% not at all).
1.2% of residents speak Asian or Pacific Island language at home (53% very well, 24% well, 16% not well, 7% not at all).
1.9% of residents speak other language at home (80% very well, 20% well).
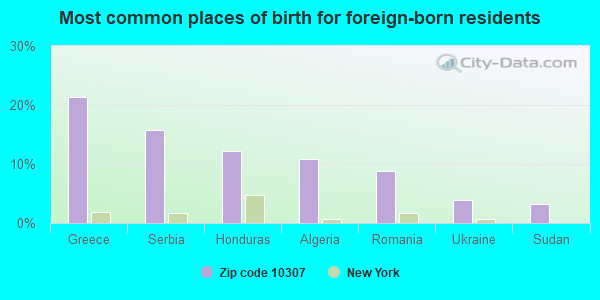
Foreign born population: 1,770 (12.2%) (72.7% of them are naturalized citizens)
This zip code:
12.2%
Whole state:
22.7%
21%Greece
16%Serbia
12%Honduras
11%Algeria
9%Romania
4%Ukraine
3%Sudan
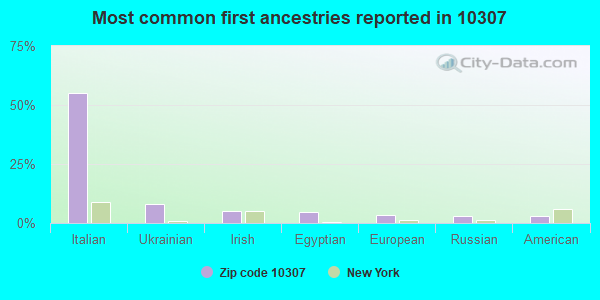
55%Italian
8%Ukrainian
5%Irish
5%Egyptian
3%European
3%Russian
3%American
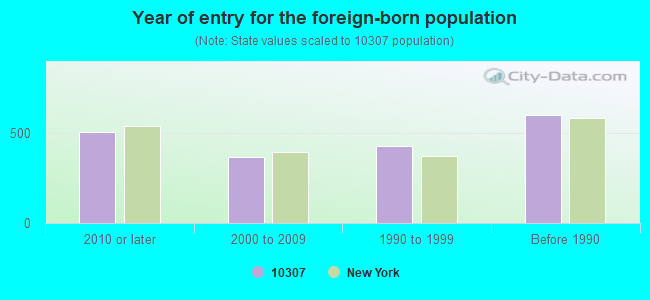
Year of entry for the foreign-born population
5072010 or later
3692000 to 2009
4281990 to 1999
603Before 1990
Facilities with environmental interests located in this zip code:
AT&T NASSAU METALS-286 RICHMOND VALLEY (286 RICHMOND VALLEY ROAD in STATEN ISLAND, NY)
AIR MINOR (AIRS/AFS) SUPERFUND (Superfund database) STATE MASTER (New York facility tracking) - SECTION 404 PERMITTING, HAZARDOUS WASTE PROGRAM (Integrated Compliance Information System) - ICIS-02-1988-0706, FORMAL ENFORCEMENT ACTION COMPLIANCE ACTIVITY (Tracking inspections of insecticide, fungicide, and rodenticide, and toxic substances) Large Quantity Generators, more that 1000 kg of hazardous waste/month (Resource Conservation and Recovery Act (tracking hazardous waste)) - notification TRI REPORTER (Tracking of toxic chemicals releasing facilities) Business SIC classification: CHEMICALS AND CHEMICAL PREPARATIONS; SECONDARY SMELTING AND REFINING OF NONFERROUS METALS; INDUSTRIAL PROCESS FURNACES AND OVENS Business NAICS classification: INDUSTRIAL PROCESS FURNACE AND OVEN MANUFACTURING. Organizations: LUCENT TECHNOLOGIES (CONTACT/OWNER)
, A T & T NASSAU METALS (LEGALLY RESPONSIBLE PARTY)
, NASSAU METALS CORP (LEGALLY RESPONSIBLE PARTY)
Alternative names: NASAU RECYCLE CORP, AT & T NASSAU METALS, LUCENT TECH-ELECTROPLATING CHEM & SVCS, LUCENT TECHNOLOGIES NASSAU METALS CORPORATION, NASAU RECYCLE CORP, NASSAU METALS-AT&T, NASSAU RECYCLE CORP
A & M CLEANERS & TAILORING (7339 AMBOY RD. in STATEN ISLAND, NY)
AIR MINOR (AIRS/AFS) STATE MASTER (New York facility tracking) - AIR PROGRAM (Resource Conservation and Recovery Act (tracking hazardous waste)) Business SIC classification: DRYCLEANING PLANTS, EXCEPT RUG CLEANING Organizations: A & M CLEANERS & TAILORING INC (LEGALLY RESPONSIBLE PARTY)
Alternative names: A & M CLEANERS TAILORING
IS 34 TOTTEN IS ( in STATEN ISLAND, NY)
(National Center for Education Statistics) - STATE ID-353100010034 Organizations: NEW YORK CITY PUBLIC SCHOOLS (SCHOOL DISTRICT)
BETTY BRITE CLEANERS (7505 AMBOY RD in STATEN ISLAND, NY)
(Resource Conservation and Recovery Act (tracking hazardous waste))
A STRIP QUIK LLC (101 ELLIS ST in STATEN ISLAND, NY)
Conditionally Exempt Small Quantity Generators, less than 100 kg/month of hazardous waste (Resource Conservation and Recovery Act (tracking hazardous waste)) - notification Organizations: NOLAN & LANDGRAF ENTERPRISES (CONTACT/OWNER)
ISLAND TANK CLEANING CORP (2 WOOD AVE - PO BOX 294 in STATEN ISLAND, NY)
TRANSPORTER (Resource Conservation and Recovery Act (tracking hazardous waste)) Organizations: EDDIE TAGLSTTLE (CONTACT/OWNER)
Housing units lacking complete kitchen facilities: 1.1%
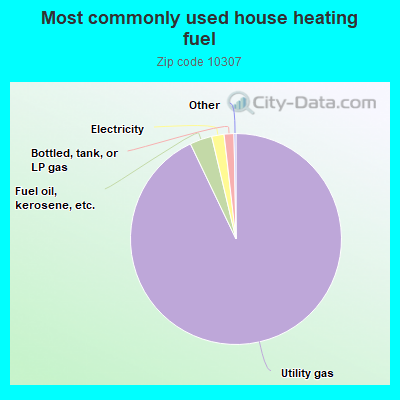
92.8%Utility gas
3.4%Fuel oil, kerosene, etc.
1.9%Electricity
1.5%Bottled, tank, or LP gas
Population in 1990: 7,627. Population change in the 1990s: +4,042 (+53.0%).
Place of birth for U.S.-born residents:
This state: 11,921
Northeast: 304
Midwest: 176
South: 142
West: 13
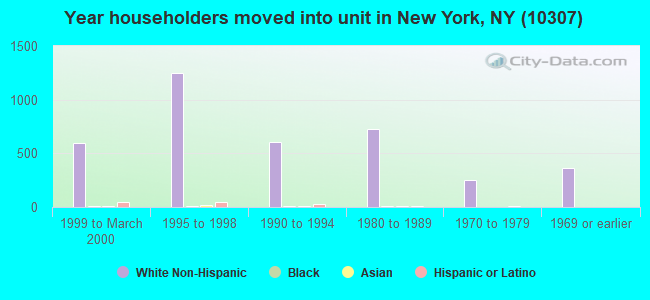
62% of the 10307 zip code residents lived in the same house 5 years ago. Out of people who lived in different houses, 62% lived in this county. Out of people who lived in different counties, 50% lived in New York.
95% of the 10307 zip code residents lived in the same house 1 year ago. Out of people who lived in different houses, 69% moved from this county. Out of people who lived in different houses, 25% moved from different county within same state. Out of people who lived in different houses, 3% moved from abroad.
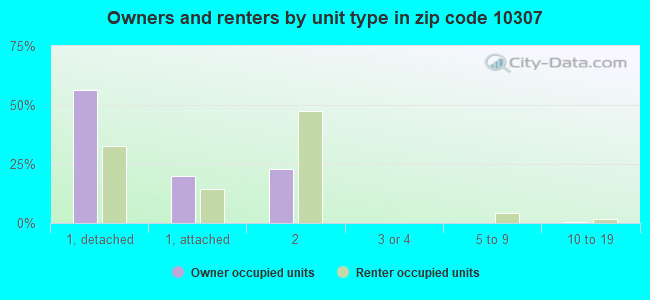
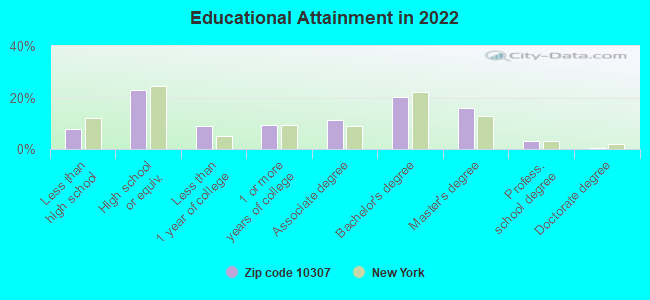
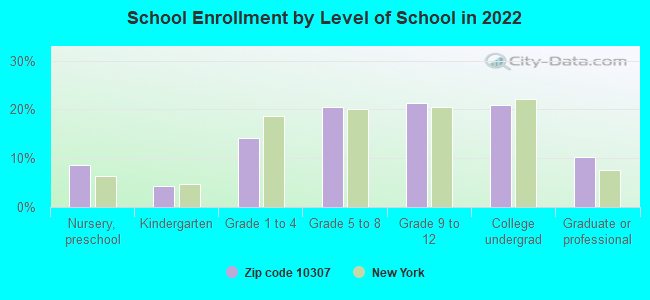
Private vs. public school enrollment:
Students in private schools in grades 1 to 8 (elementary and middle school): 248
Here:
19.5%
New York:
15.6%
Students in private schools in grades 9 to 12 (high school): 347
Here:
45.4%
New York:
15.0%
Students in private undergraduate colleges: 294
Here:
38.7%
New York:
39.2%
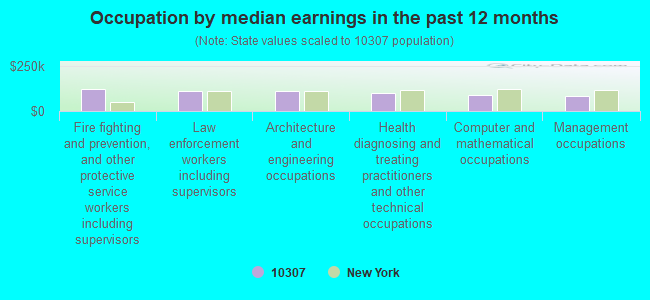
Occupation by median earnings in the past 12 months ($)
123,326Fire fighting and prevention, and other protective service workers including supervisors
113,537Law enforcement workers including supervisors
112,801Architecture and engineering occupations
102,259Health diagnosing and treating practitioners and other technical occupations
90,635Computer and mathematical occupations
84,957Management occupations
Companies with federal contracts located in this zip code:
G.M.E.S. INC. (445 BRIGHTON STREET in STATEN ISLAND, NY; small business) : $123,883 in 2 contractsin 2000
$84,871 with U.S. Army Corps of Engineers - civil program financing only for Deck Machinery. Taking place in NJ. Signed on 2000-01-05. Completion date: 1998-10-29.
$39,012, same as above.Signed on 2000-03-20. Completion date: 1998-10-29.
LINCO ELECTRICAL CONTRACTING, (5442 ARTHUR KILL RD in STATEN ISLAND, NY; small business)
$12,516 with Navy for Maintenance, Repair and Rebuilding of Equipment -- Electrical and Electronic Equipment Components. Signed on 2005-05-20. Completion date: 2005-06-02.
Top industries in this zip code by the number of employees in 2005:
Administrative and Support and Waste Management and Remediation Services: Landscaping Services (50-99 employees: 1 establishment, 5-9 employees: 4 establishments, 1-4 employees: 8 establishments)
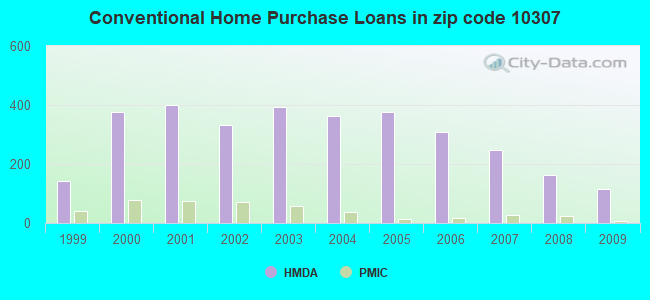
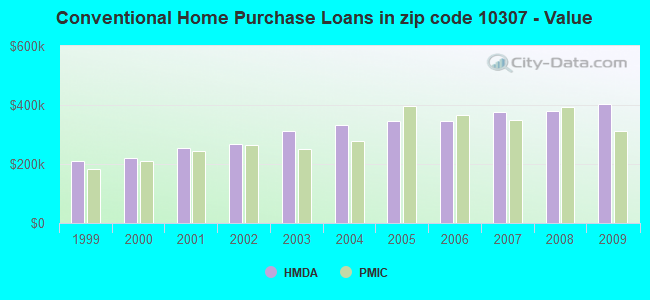
Detailed PMIC statistics for the following Tracts:0244.00
, 0248.00
2003 - 2018 National Fire Incident Reporting System (NFIRS) incidents
Based on the data from the years 2003 - 2018 the average number of fire incidents per year is 39. The highest number of fires - 72 took place in 2016, and the least - 0 in 2005. The data has a rising trend.
When looking into fire subcategories, the most incidents belonged to: Structure Fires (59.7%), and Outside Fires (31.1%).
Fire incident types reported to NFIRS in Zip Code 10307

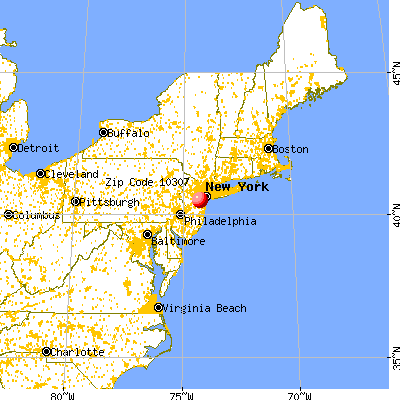


 Nearest zip codes: 10309, 08861, 07077, 08879, 07064, 07095.


 Based on the data from the years 2003 - 2018 the average number of fire incidents per year is 39. The highest number of fires - 72 took place in 2016, and the least - 0 in 2005. The data has a rising trend.
 When looking into fire subcategories, the most incidents belonged to: Structure Fires (59.7%), and Outside Fires (31.1%).