Estimated zip code population in 2022: 4,374 Zip code population in 2010: 4,540 Zip code population in 2000: 4,070
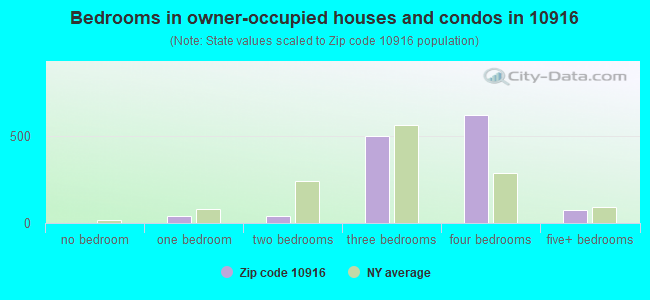
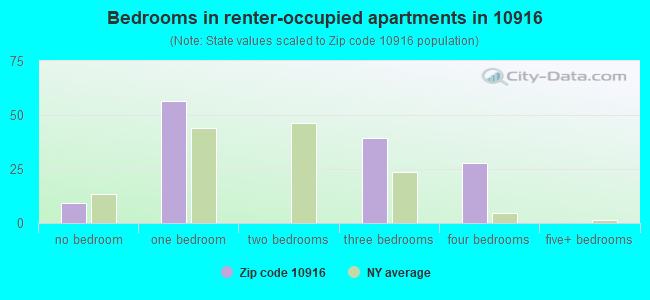
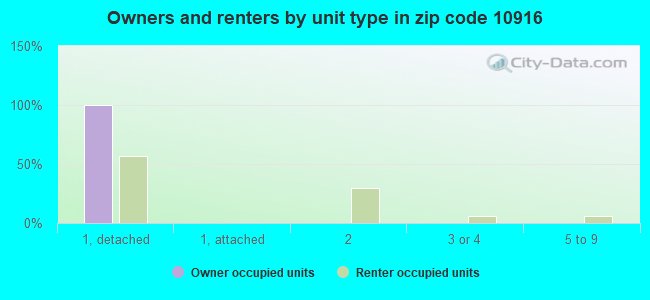
Houses and condos: 1,486 Renter-occupied apartments: 132
% of renters here:
9%
State:
46%
March 2022 cost of living index in zip code 10916: 116.6 (more than average, U.S. average is 100)
Land area: 20.2 sq. mi. Water area: 0.1 sq. mi.
Population density: 217 people per square mile
(very low).
OSM Map
General Map
Google Map
MSN Map
OSM Map
General Map
Google Map
MSN Map
OSM Map
General Map
Google Map
MSN Map
OSM Map
General Map
Google Map
MSN Map
Please wait while loading the map...
Real estate property taxes paid for housing units in 2022:
This zip code:
2.2% ($9,805)
New York:
1.5% ($6,180)
Median real estate property taxes paid for housing units with mortgages in 2022: $9,858 (2.1%) Median real estate property taxes paid for housing units with no mortgage in 2022: $9,108 (2.2%)
Business Search- 14 Million verified businesses
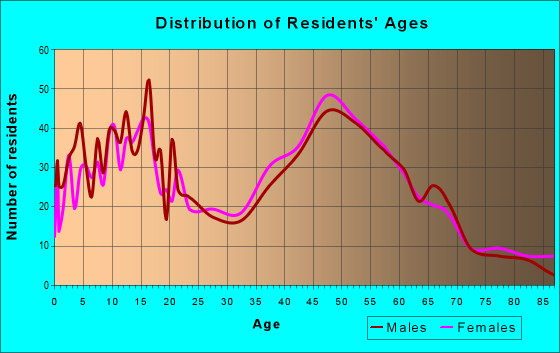
Males: 2,319
(53.0%)
Females: 2,055
(47.0%)
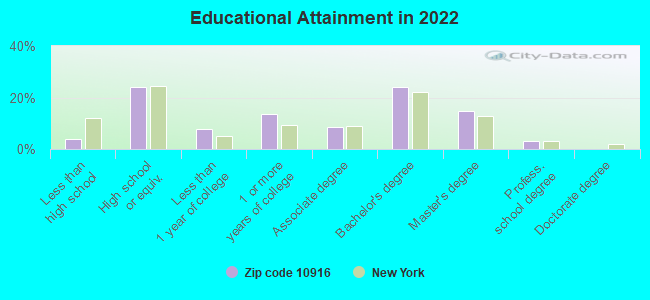
For population 25 years and over in 10916:
High school or higher: 96.2%
Bachelor's degree or higher: 42.1%
Graduate or professional degree: 18.1%
Unemployed: 2.5%
Mean travel time to work (commute): 40.7 minutes
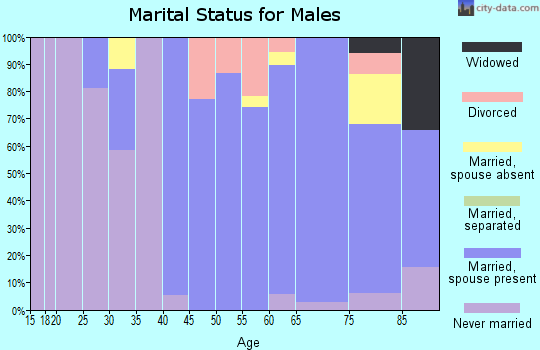
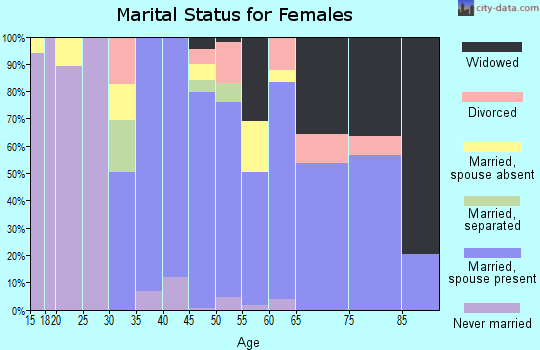
For population 15 years and over in 10916:
Never married: 31.4%
Now married: 56.0%
Separated: 1.8%
Widowed: 4.3%
Divorced: 6.4%
Zip code 10916 compared to state average:
Unemployed percentage below state average.
Black race population percentage significantly below state average.
Foreign-born population percentage significantly below state average.
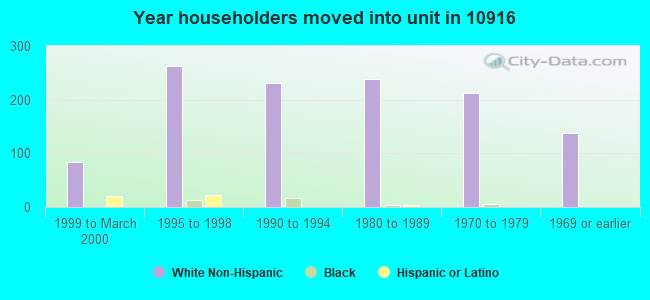
Renting percentage significantly below state average.
Length of stay since moving in significantly above state average.
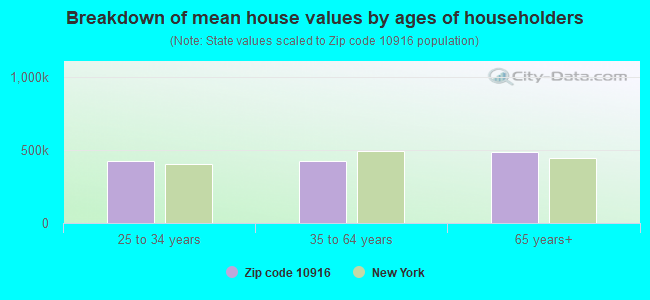
Estimated median house/condo value in 2022: $452,418
10916:
$452,418
New York:
$400,400
According to our research of New York and other state lists, there were 2 registered sex offenders living in 10916 zip code as of April 26, 2024. The ratio of all residents to sex offenders in zip code 10916 is 2,163 to 1. The ratio of registered sex offenders to all residents in this zip code is lower than the state average.
Median resident age:
This zip code:
43.3 years
New York median age:
40.0 years
Average household size:
This zip code:
3.0 people
New York:
2.5 people
Averages for the 2020 tax year for zip code 10916, filed in 2021:
Average Adjusted Gross Income (AGI) in 2020: $104,851 (Individual Income Tax Returns)
Here:
$104,851
State:
$90,930
Salary/wage: $92,604 (reported on 82.0% of returns)
Here:
$92,604
State:
$72,104
(% of AGI for various income ranges: 1116.6% for AGIs below $25k, 3640.4% for AGIs $25k-50k, 6377.5% for AGIs $50k-75k, 9252.0% for AGIs $75k-100k, 17613.1% for AGIs $100k-200k, 81217.8% for AGIs over 200k)
Taxable interest for individuals: $1,174 (reported on 47.6% of returns)
This zip code:
$1,174
New York:
$3,075
(% of AGI for various income ranges: 21.4% for AGIs below $25k, 23.3% for AGIs $25k-50k, 32.0% for AGIs $50k-75k, 124.0% for AGIs $75k-100k, 108.6% for AGIs $100k-200k, 582.2% for AGIs over 200k)
Ordinary dividends: $4,717 (reported on 29.6% of returns)
Here:
$4,717
State:
$11,095
(% of AGI for various income ranges: 40.3% for AGIs below $25k, 39.6% for AGIs $25k-50k, 63.0% for AGIs $50k-75k, 124.7% for AGIs $75k-100k, 266.1% for AGIs $100k-200k, 1928.9% for AGIs over 200k)
Net capital gain/loss in AGI: +$11,993 (reported on 24.9% of returns)
Here:
+$11,993
State:
+$44,925
(% of AGI for various income ranges: 17.7% for AGIs below $25k, 31.5% for AGIs $25k-50k, 52.5% for AGIs $50k-75k, 252.7% for AGIs $75k-100k, 269.4% for AGIs $100k-200k, 5950.0% for AGIs over 200k)
Profit/loss from business: +$19,206 (reported on 15.0% of returns)
Here:
+$19,206
State:
+$14,940
(% of AGI for various income ranges: 52.9% for AGIs below $25k, 281.1% for AGIs $25k-50k, 363.0% for AGIs $50k-75k, 372.7% for AGIs $75k-100k, 535.3% for AGIs $100k-200k, 2851.1% for AGIs over 200k)
Taxable individual retirement arrangement distribution: $22,552 (reported on 9.9% of returns)
10916:
$22,552
New York:
$19,609
(% of AGI for various income ranges: 38.3% for AGIs below $25k, 120.0% for AGIs $25k-50k, 265.0% for AGIs $50k-75k, 416.0% for AGIs $75k-100k, 557.5% for AGIs $100k-200k, 1742.2% for AGIs over 200k)
Self-employed (Keogh) retirement plans: $24,433 (reported on 1.3% of returns)
10916:
$24,433
New York:
$32,497
(% of AGI for various income ranges: 203.6% for AGIs $100k-200k)
Total itemized deductions: $31,089 (reported on 15.5% of returns)
Here:
$31,089
State:
$39,326
(% of AGI for various income ranges: 448.1% for AGIs $25k-50k, 481.0% for AGIs $50k-75k, 762.7% for AGIs $75k-100k, 1023.1% for AGIs $100k-200k, 4658.9% for AGIs over 200k)
Charity contributions: $6,121 (reported on 12.4% of returns)
Here:
$6,121
State:
$15,420
(% of AGI for various income ranges: 20.4% for AGIs $25k-50k, 40.5% for AGIs $50k-75k, 89.3% for AGIs $75k-100k, 128.9% for AGIs $100k-200k, 1156.7% for AGIs over 200k)
Taxes paid: $9,669 (reported on 15.5% of returns)
10916:
$9,669
State:
$9,183
(% of AGI for various income ranges: 144.4% for AGIs $25k-50k, 182.5% for AGIs $50k-75k, 340.7% for AGIs $75k-100k, 385.3% for AGIs $100k-200k, 920.0% for AGIs over 200k)
Earned income credit: $1,979 (reported on 6.0% of returns)
Here:
$1,979
State:
$2,138
(% of AGI for various income ranges: 42.9% for AGIs below $25k, 47.0% for AGIs $25k-50k)
Percentage of individuals using paid preparers for their 2020 taxes: 95.3%
Here:
95%
State:
95%
(% for various income ranges: 94.6% for AGIs below $25k, 94.6% for AGIs $25k-50k, 96.6% for AGIs $50k-75k, 95.8% for AGIs $75k-100k, 95.1% for AGIs $100k-200k, 96.2% for AGIs over 200k)
Averages for the 2012 tax year for zip code 10916, filed in 2013:
Average Adjusted Gross Income (AGI) in 2012: $90,102 (Individual Income Tax Returns)
Here:
$90,102
State:
$77,088
Salary/wage: $79,867 (reported on 85.0% of returns)
Here:
$79,867
State:
$60,593
(% of AGI for various income ranges: 69.6% for AGIs below $25k, 73.3% for AGIs $25k-50k, 68.8% for AGIs $50k-75k, 74.0% for AGIs $75k-100k, 82.1% for AGIs $100k-200k, 71.1% for AGIs over 200k)
Taxable interest for individuals: $1,260 (reported on 51.2% of returns)
This zip code:
$1,260
New York:
$3,125
(% of AGI for various income ranges: 1.0% for AGIs below $25k, 0.9% for AGIs $25k-50k, 1.3% for AGIs $50k-75k, 0.4% for AGIs $75k-100k, 0.3% for AGIs $100k-200k, 1.0% for AGIs over 200k)
Ordinary dividends: $3,627 (reported on 31.0% of returns)
Here:
$3,627
State:
$10,299
(% of AGI for various income ranges: 2.3% for AGIs below $25k, 1.4% for AGIs $25k-50k, 1.6% for AGIs $50k-75k, 0.9% for AGIs $75k-100k, 0.9% for AGIs $100k-200k, 1.5% for AGIs over 200k)
Net capital gain/loss in AGI: +$8,692 (reported on 22.5% of returns)
Here:
+$8,692
State:
+$42,474
(% of AGI for various income ranges: 0.5% for AGIs $50k-75k, 0.2% for AGIs $75k-100k, 0.9% for AGIs $100k-200k, 5.2% for AGIs over 200k)
Profit/loss from business: +$20,756 (reported on 16.0% of returns)
Here:
+$20,756
State:
+$16,168
(% of AGI for various income ranges: 9.0% for AGIs below $25k, 3.7% for AGIs $25k-50k, 4.6% for AGIs $50k-75k, 3.5% for AGIs $75k-100k, 2.2% for AGIs $100k-200k, 4.6% for AGIs over 200k)
Taxable individual retirement arrangement distribution: $17,057 (reported on 10.8% of returns)
10916:
$17,057
New York:
$17,621
(% of AGI for various income ranges: 3.0% for AGIs below $25k, 3.4% for AGIs $25k-50k, 3.3% for AGIs $50k-75k, 3.7% for AGIs $75k-100k, 2.9% for AGIs $100k-200k)
Self-employment retirement plans: $20,967 (reported on 1.4% of returns)
10916:
$20,967
New York:
$27,330
Total itemized deductions: $31,635 (22% of AGI, reported on 54.5% of returns)
Here:
$31,635
State:
$34,985
Here:
22.4% of AGI
State:
21.3% of AGI
(% of AGI for various income ranges: 20.0% for AGIs below $25k, 20.5% for AGIs $25k-50k, 21.3% for AGIs $50k-75k, 20.2% for AGIs $75k-100k, 21.8% for AGIs $100k-200k, 15.2% for AGIs over 200k)
Charity contributions: $2,717 (reported on 46.9% of returns)
Here:
$2,717
State:
$5,572
(% of AGI for various income ranges: 1.0% for AGIs below $25k, 1.2% for AGIs $25k-50k, 1.4% for AGIs $50k-75k, 1.5% for AGIs $75k-100k, 1.7% for AGIs $100k-200k, 1.2% for AGIs over 200k)
Taxes paid: $17,840 (reported on 54.0% of returns)
10916:
$17,840
State:
$18,656
(% of AGI for various income ranges: 8.7% for AGIs below $25k, 9.1% for AGIs $25k-50k, 10.2% for AGIs $50k-75k, 10.4% for AGIs $75k-100k, 11.6% for AGIs $100k-200k, 10.5% for AGIs over 200k)
Earned income credit: $1,500 (reported on 8.5% of returns)
Here:
$1,500
State:
$2,230
(% of AGI for various income ranges: 2.7% for AGIs below $25k, 0.7% for AGIs $25k-50k)
Percentage of individuals using paid preparers for their 2012 taxes: 67.6%
Here:
68%
State:
66%
(% for various income ranges: 57.1% for AGIs below $25k, 66.7% for AGIs $25k-50k, 66.7% for AGIs $50k-75k, 73.9% for AGIs $75k-100k, 74.5% for AGIs $100k-200k, 81.2% for AGIs over 200k)
Averages for the 2004 tax year for zip code 10916, filed in 2005:
Average Adjusted Gross Income (AGI) in 2004: $67,252 (Individual Income Tax Returns)
Here:
$67,252
State:
$59,519
Salary/wage: $63,544 (reported on 84.4% of returns)
Here:
$63,544
State:
$50,673
(% of AGI for various income ranges: 110.9% for AGIs below $10k, 68.1% for AGIs $10k-25k, 76.1% for AGIs $25k-50k, 82.4% for AGIs $50k-75k, 79.6% for AGIs $75k-100k, 80.0% for AGIs over 100k)
Taxable interest for individuals: $1,087 (reported on 65.5% of returns)
This zip code:
$1,087
New York:
$2,377
(% of AGI for various income ranges: 7.7% for AGIs below $10k, 2.7% for AGIs $10k-25k, 1.5% for AGIs $25k-50k, 1.6% for AGIs $50k-75k, 0.8% for AGIs $75k-100k, 0.7% for AGIs over 100k)
Taxable dividends: $1,946 (reported on 36.8% of returns)
Here:
$1,946
State:
$5,394
(% of AGI for various income ranges: 7.7% for AGIs below $10k, 2.4% for AGIs $10k-25k, 1.2% for AGIs $25k-50k, 1.1% for AGIs $50k-75k, 1.2% for AGIs $75k-100k, 0.8% for AGIs over 100k)
Net capital gain/loss: +$6,504 (reported on 29.6% of returns)
Here:
+$6,504
State:
+$23,581
(% of AGI for various income ranges: -3.8% for AGIs below $10k, 0.7% for AGIs $10k-25k, -0.4% for AGIs $25k-50k, 0.4% for AGIs $50k-75k, 1.1% for AGIs $75k-100k, 4.7% for AGIs over 100k)
Profit/loss from business: +$12,062 (reported on 16.0% of returns)
Here:
+$12,062
State:
+$13,809
(% of AGI for various income ranges: 9.2% for AGIs below $10k, 8.0% for AGIs $10k-25k, 5.4% for AGIs $25k-50k, 1.9% for AGIs $50k-75k, 3.4% for AGIs $75k-100k, 2.1% for AGIs over 100k)
IRA payment deduction: $3,438 (reported on 3.8% of returns)
10916:
$3,438
New York:
$3,115
(% of AGI for various income ranges: 2.6% for AGIs below $10k, 0.4% for AGIs $25k-50k, 0.4% for AGIs $50k-75k, 0.2% for AGIs $75k-100k, 0.1% for AGIs over 100k)
Self-employed pension: $18,810 (reported on 1.1% of returns)
Here:
$18,810
New York:
$19,016
Total itemized deductions: $25,848 (25% of AGI, reported on 55.5% of returns)
Here:
$25,848
State:
$25,864
Here:
24.8% of AGI
State:
21.9% of AGI
(% of AGI for various income ranges: 19.6% for AGIs below $10k, 15.9% for AGIs $10k-25k, 18.2% for AGIs $25k-50k, 27.3% for AGIs $50k-75k, 25.0% for AGIs $75k-100k, 19.9% for AGIs over 100k)
Charity contributions deductions: $2,899 (3% of AGI, reported on 51.5% of returns)
Here:
$2,899
State:
$4,439
Here:
2.7% of AGI
State:
3.6% of AGI
(% of AGI for various income ranges: 0.6% for AGIs below $10k, 1.3% for AGIs $10k-25k, 1.6% for AGIs $25k-50k, 2.5% for AGIs $50k-75k, 2.3% for AGIs $75k-100k, 2.3% for AGIs over 100k)
Total tax: $10,657 (reported on 80.2% of returns)
10916:
$10,657
State:
$11,730
(% of AGI for various income ranges: 3.3% for AGIs below $10k, 5.2% for AGIs $10k-25k, 7.7% for AGIs $25k-50k, 7.3% for AGIs $50k-75k, 8.5% for AGIs $75k-100k, 16.5% for AGIs over 100k)
Earned income credit: $1,368 (reported on 6.1% of returns)
Here:
$1,368
State:
$1,757
Percentage of individuals using paid preparers for their 2004 taxes: 70.4%
Here:
70%
State:
67%
(% for various income ranges: 59.0% for AGIs below $10k, 64.7% for AGIs $10k-25k, 72.4% for AGIs $25k-50k, 77.2% for AGIs $50k-75k, 72.2% for AGIs $75k-100k, 77.2% for AGIs over 100k)
Household received Food Stamps/SNAP in the past 12 months: 28 Household did not receive Food Stamps/SNAP in the past 12 months: 1,379
Women who had a birth in the past 12 months: 43 (43 now married, 0 unmarried) Women who did not have a birth in the past 12 months: 989 (364 now married, 623 unmarried)
Housing units in zip code 10916 with a mortgage: 868 (91 second mortgage, 92 both second mortgage and home equity loan) Houses without a mortgage: 124
Median monthly owner costs for units with a mortgage: $2,789 Median monthly owner costs for units without a mortgage: $1,283
Residents with income below the poverty level in 2022:
This zip code:
6.0%
Whole state:
14.3%
Residents with income below 50% of the poverty level in 2022:
This zip code:
0.4%
Whole state:
6.8%
Median number of rooms in houses and condos:
Here:
7.3
State:
6.3
Median number of rooms in apartments:
Here:
5.5
State:
3.8
Notable locations in this zip code not listed on our city pages
Notable locations in zip code 10916: Metro-North Campbell Hall Station (A), Stony Ford Ranch (B), Krisco Farms Dairy (C), Otter Kill Golf and Country Club (D), Route 207 Professional Building (E), Campbell Hall Rehabilitation Center (F), Hamptonburgh Town Hall (G), Hamptonburgh Fire District (H). Display/hide their locations on the map
In group quarters: 131 (-1 institutionalized population)
Size of family households: 395 2-persons, 328 3-persons, 345 4-persons, 47 5-persons, 34 6-persons, 35 7-or-more-persons
Size of nonfamily households: 192 1-person, 29 2-persons
562 married couples with children.
382 single-parent households (96 men, 286 women).
85.5% of residents of 10916 zip code speak English at home.
6.6% of residents speak Spanish at home (83% very well, 11% well, 5% not well, 1% not at all).
2.1% of residents speak other Indo-European language at home (74% very well, 20% well, 7% not well).
2.1% of residents speak Asian or Pacific Island language at home (83% very well, 13% well, 5% not well).
3.3% of residents speak other language at home (76% very well, 24% not well).
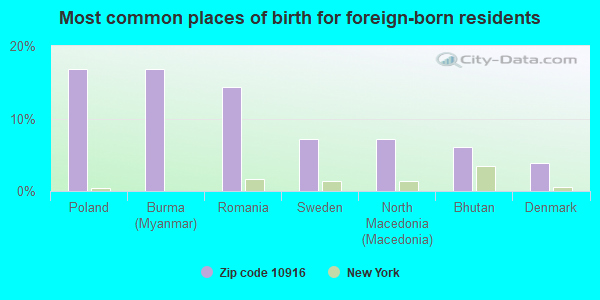
Foreign born population: 284 (6.5%) (88.2% of them are naturalized citizens)
This zip code:
6.5%
Whole state:
22.7%
17%Poland
17%Burma (Myanmar)
14%Romania
7%Sweden
7%North Macedonia (Macedonia)
6%Bhutan
4%Denmark
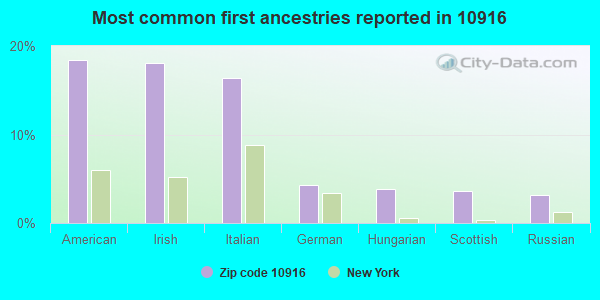
18%American
18%Irish
16%Italian
4%German
4%Hungarian
4%Scottish
3%Russian
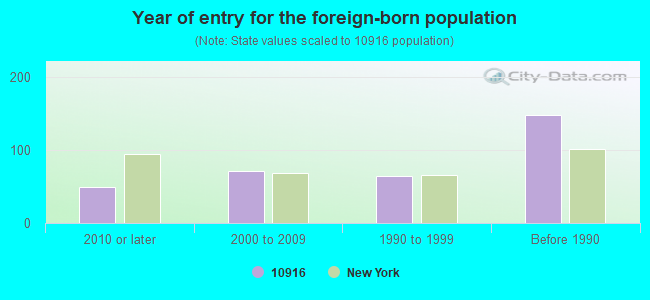
Year of entry for the foreign-born population
492010 or later
712000 to 2009
641990 to 1999
148Before 1990
Facilities with environmental interests located in this zip code:
A T & T CORP (1 RIDGE RD in CAMPBELL HALL, NY)
(Resource Conservation and Recovery Act (tracking hazardous waste))
HAMPTONBURGH TOWN OF (RIDGE RD BRIDGE OVER CONRAIL in HAMPTONBURGH, NY)
Small Quantity Generators, between 100 kg and 1000 kg of hazardous waste/month (Resource Conservation and Recovery Act (tracking hazardous waste)) - notification Organizations: TOWN OF HAMPTONBURGH (CONTACT/OWNER)
Housing units lacking complete plumbing facilities: 3.0% Housing units lacking complete kitchen facilities: 1.7%
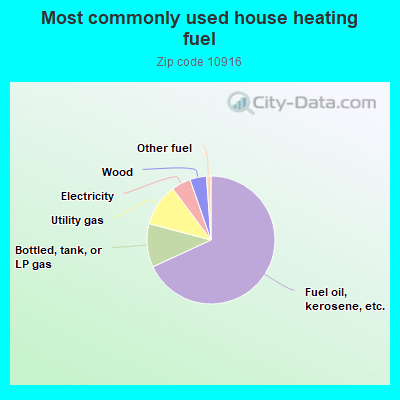
68.2%Fuel oil, kerosene, etc.
11.0%Bottled, tank, or LP gas
10.7%Utility gas
4.9%Electricity
4.2%Wood
1.1%Other fuel
Population in 1990: 3,065. Population change in the 1990s: +1,005 (+32.8%).
Place of birth for U.S.-born residents:
This state: 3,296
Northeast: 513
Midwest: 97
South: 55
West: 62
68% of the 10916 zip code residents lived in the same house 5 years ago. Out of people who lived in different houses, 56% lived in this county. Out of people who lived in different counties, 50% lived in New York.
91% of the 10916 zip code residents lived in the same house 1 year ago. Out of people who lived in different houses, 71% moved from this county. Out of people who lived in different houses, 20% moved from different county within same state. Out of people who lived in different houses, 6% moved from abroad.
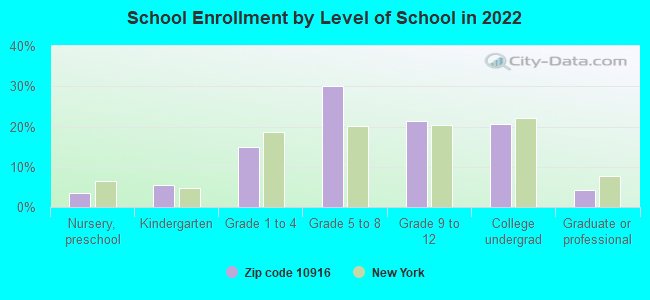
Private vs. public school enrollment:
Students in private schools in grades 1 to 8 (elementary and middle school):
Here:
0.0%
New York:
15.6%
Students in private schools in grades 9 to 12 (high school):
Here:
0.0%
New York:
15.0%
Students in private undergraduate colleges: 99
Here:
38.9%
New York:
39.2%
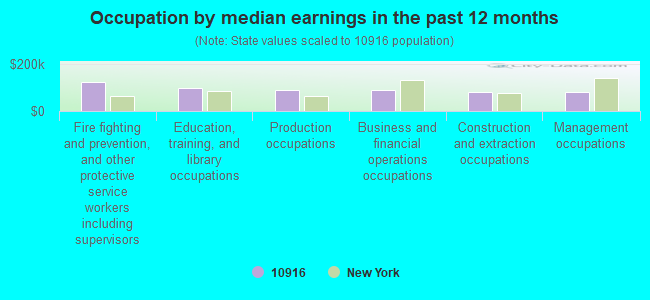
Occupation by median earnings in the past 12 months ($)
121,222Fire fighting and prevention, and other protective service workers including supervisors
95,981Education, training, and library occupations
89,549Production occupations
88,544Business and financial operations occupations
81,802Construction and extraction occupations
81,488Management occupations
Companies with federal contracts located in this zip code:
ADVANCE TESTING CO INC (3348 ROUTE 208 in CAMPBELL HALL, NY; small business) : $3,000 in 2 contractsin 2005
$1,500 with Army for Maintenance, Repair or Alteration of Real Property -- Other Non-Building Facilities. Taking place in PA. Signed on 2005-05-20. Completion date: 2005-05-18.
$1,500 with U.S. Army Corps of Engineers - civil program financing only for Maintenance, Repair or Alteration of Real Property -- Other Non-Building Facilities. Taking place in PA. Signed on 2005-05-20. Completion date: 2005-05-18.
Top industries in this zip code by the number of employees in 2005:
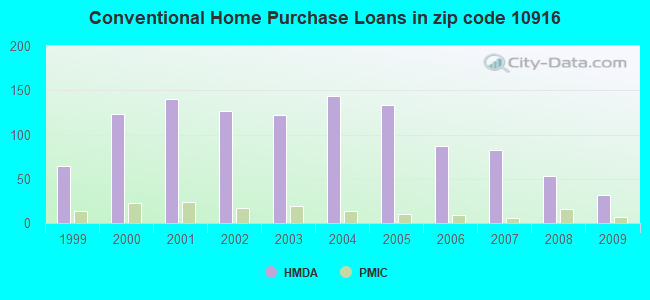
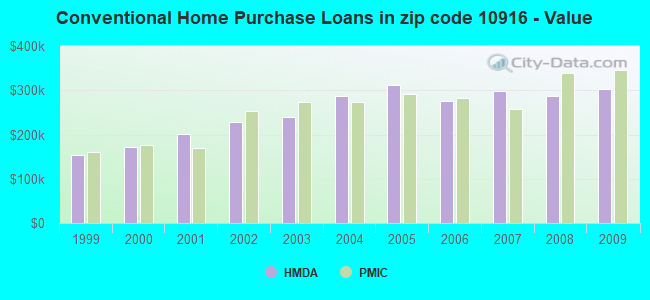
Detailed PMIC statistics for the following Tracts:0123.00
2002 - 2018 National Fire Incident Reporting System (NFIRS) incidents
According to the data from the years 2002 - 2018 the average number of fires per year is 13. The highest number of reported fire incidents - 33 took place in 2006, and the least - 1 in 2003. The data has a constant trend.
When looking into fire subcategories, the most reports belonged to: Structure Fires (33.9%), and Outside Fires (25.8%).
Fire incident types reported to NFIRS in Zip Code 10916
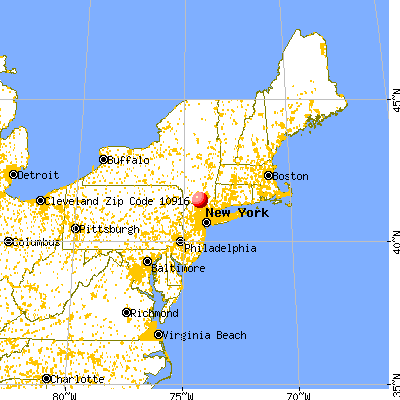


 Nearest zip codes: 10914, 12575, 12549, 10992, 12543, 10918.


 According to the data from the years 2002 - 2018 the average number of fires per year is 13. The highest number of reported fire incidents - 33 took place in 2006, and the least - 1 in 2003. The data has a constant trend.
 When looking into fire subcategories, the most reports belonged to: Structure Fires (33.9%), and Outside Fires (25.8%).