Estimated zip code population in 2022: 62,011 Zip code population in 2010: 47,226 Zip code population in 2000: 38,791
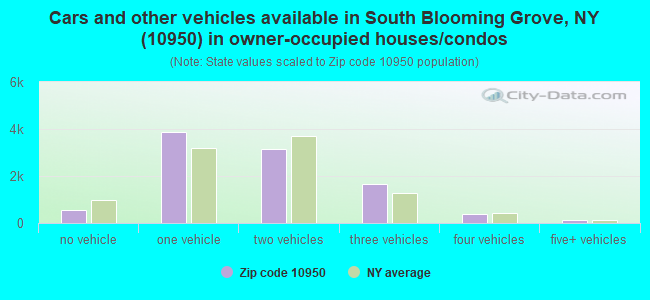
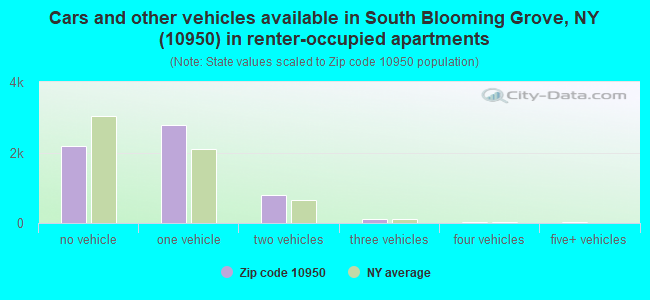
Houses and condos: 16,903 Renter-occupied apartments: 5,917
% of renters here:
38%
State:
46%
March 2022 cost of living index in zip code 10950: 136.9 (high, U.S. average is 100)
Land area: 36.4 sq. mi. Water area: 1.5 sq. mi.
Population density: 1,704 people per square mile
(low).
OSM Map
General Map
Google Map
MSN Map
OSM Map
General Map
Google Map
MSN Map
OSM Map
General Map
Google Map
MSN Map
OSM Map
General Map
Google Map
MSN Map
Please wait while loading the map...
Real estate property taxes paid for housing units in 2022:
This zip code:
2.0% ($8,580)
New York:
1.5% ($6,180)
Median real estate property taxes paid for housing units with mortgages in 2022: $8,470 (1.8%) Median real estate property taxes paid for housing units with no mortgage in 2022: $8,780 (2.2%)
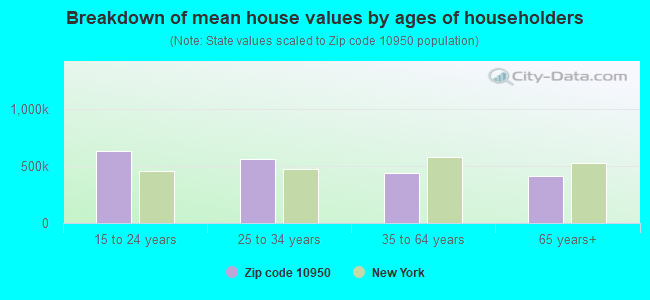
Estimated median house/condo value in 2022: $436,364
10950:
$436,364
New York:
$400,400
According to our research of New York and other state lists, there were 9 registered sex offenders living in 10950 zip code as of April 27, 2024. The ratio of all residents to sex offenders in zip code 10950 is 5,603 to 1. The ratio of registered sex offenders to all residents in this zip code is much lower than the state average.
Median resident age:
This zip code:
21.7 years
New York median age:
40.0 years
Average household size:
This zip code:
3.9 people
New York:
2.5 people
Averages for the 2020 tax year for zip code 10950, filed in 2021:
Average Adjusted Gross Income (AGI) in 2020: $79,187 (Individual Income Tax Returns)
Here:
$79,187
State:
$90,930
Salary/wage: $63,308 (reported on 86.6% of returns)
Here:
$63,308
State:
$72,104
(% of AGI for various income ranges: 1457.7% for AGIs below $25k, 3373.2% for AGIs $25k-50k, 6340.3% for AGIs $50k-75k, 9253.9% for AGIs $75k-100k, 17349.2% for AGIs $100k-200k, 66311.6% for AGIs over 200k)
Taxable interest for individuals: $1,084 (reported on 33.6% of returns)
This zip code:
$1,084
New York:
$3,075
(% of AGI for various income ranges: 9.8% for AGIs below $25k, 15.4% for AGIs $25k-50k, 28.7% for AGIs $50k-75k, 39.1% for AGIs $75k-100k, 59.0% for AGIs $100k-200k, 884.9% for AGIs over 200k)
Ordinary dividends: $4,419 (reported on 16.4% of returns)
Here:
$4,419
State:
$11,095
(% of AGI for various income ranges: 12.6% for AGIs below $25k, 20.2% for AGIs $25k-50k, 52.4% for AGIs $50k-75k, 92.1% for AGIs $75k-100k, 165.7% for AGIs $100k-200k, 1662.3% for AGIs over 200k)
Net capital gain/loss in AGI: +$14,516 (reported on 15.2% of returns)
Here:
+$14,516
State:
+$44,925
(% of AGI for various income ranges: 11.0% for AGIs below $25k, 20.2% for AGIs $25k-50k, 68.0% for AGIs $50k-75k, 118.0% for AGIs $75k-100k, 315.5% for AGIs $100k-200k, 7374.0% for AGIs over 200k)
Profit/loss from business: +$14,653 (reported on 16.3% of returns)
Here:
+$14,653
State:
+$14,940
(% of AGI for various income ranges: 142.6% for AGIs below $25k, 197.3% for AGIs $25k-50k, 300.0% for AGIs $50k-75k, 239.0% for AGIs $75k-100k, 463.8% for AGIs $100k-200k, 3445.3% for AGIs over 200k)
Taxable individual retirement arrangement distribution: $18,314 (reported on 5.1% of returns)
10950:
$18,314
New York:
$19,609
(% of AGI for various income ranges: 20.1% for AGIs below $25k, 40.2% for AGIs $25k-50k, 103.7% for AGIs $50k-75k, 214.2% for AGIs $75k-100k, 379.2% for AGIs $100k-200k, 745.1% for AGIs over 200k)
Self-employed (Keogh) retirement plans: $31,788 (reported on 0.4% of returns)
10950:
$31,788
New York:
$32,497
(% of AGI for various income ranges: 30.8% for AGIs $100k-200k, 443.7% for AGIs over 200k)
Total itemized deductions: $51,738 (reported on 15.2% of returns)
Here:
$51,738
State:
$39,326
(% of AGI for various income ranges: 34.6% for AGIs below $25k, 127.8% for AGIs $25k-50k, 523.3% for AGIs $50k-75k, 940.2% for AGIs $75k-100k, 1852.6% for AGIs $100k-200k, 19698.1% for AGIs over 200k)
Charity contributions: $33,411 (reported on 13.0% of returns)
Here:
$33,411
State:
$15,420
(% of AGI for various income ranges: 3.1% for AGIs below $25k, 17.7% for AGIs $25k-50k, 96.6% for AGIs $50k-75k, 227.7% for AGIs $75k-100k, 619.0% for AGIs $100k-200k, 14960.7% for AGIs over 200k)
Taxes paid: $9,145 (reported on 15.2% of returns)
10950:
$9,145
State:
$9,183
(% of AGI for various income ranges: 14.1% for AGIs below $25k, 45.0% for AGIs $25k-50k, 172.4% for AGIs $50k-75k, 312.3% for AGIs $75k-100k, 533.0% for AGIs $100k-200k, 1513.0% for AGIs over 200k)
Earned income credit: $4,075 (reported on 24.0% of returns)
Here:
$4,075
State:
$2,138
(% of AGI for various income ranges: 273.6% for AGIs below $25k, 205.6% for AGIs $25k-50k, 5.6% for AGIs $50k-75k)
Percentage of individuals using paid preparers for their 2020 taxes: 95.3%
Here:
95%
State:
95%
(% for various income ranges: 94.4% for AGIs below $25k, 96.0% for AGIs $25k-50k, 95.4% for AGIs $50k-75k, 95.0% for AGIs $75k-100k, 95.6% for AGIs $100k-200k, 96.9% for AGIs over 200k)
Averages for the 2012 tax year for zip code 10950, filed in 2013:
Average Adjusted Gross Income (AGI) in 2012: $66,057 (Individual Income Tax Returns)
Here:
$66,057
State:
$77,088
Salary/wage: $58,341 (reported on 88.9% of returns)
Here:
$58,341
State:
$60,593
(% of AGI for various income ranges: 83.4% for AGIs below $25k, 81.7% for AGIs $25k-50k, 79.6% for AGIs $50k-75k, 77.8% for AGIs $75k-100k, 82.3% for AGIs $100k-200k, 69.6% for AGIs over 200k)
Taxable interest for individuals: $878 (reported on 38.6% of returns)
This zip code:
$878
New York:
$3,125
(% of AGI for various income ranges: 0.8% for AGIs below $25k, 0.8% for AGIs $25k-50k, 0.6% for AGIs $50k-75k, 0.4% for AGIs $75k-100k, 0.3% for AGIs $100k-200k, 0.6% for AGIs over 200k)
Ordinary dividends: $2,950 (reported on 21.0% of returns)
Here:
$2,950
State:
$10,299
(% of AGI for various income ranges: 1.0% for AGIs below $25k, 0.9% for AGIs $25k-50k, 1.0% for AGIs $50k-75k, 0.6% for AGIs $75k-100k, 0.7% for AGIs $100k-200k, 1.5% for AGIs over 200k)
Net capital gain/loss in AGI: +$6,705 (reported on 15.6% of returns)
Here:
+$6,705
State:
+$42,474
(% of AGI for various income ranges: 0.2% for AGIs $50k-75k, 0.2% for AGIs $75k-100k, 0.5% for AGIs $100k-200k, 5.8% for AGIs over 200k)
Profit/loss from business: +$13,797 (reported on 14.4% of returns)
Here:
+$13,797
State:
+$16,168
(% of AGI for various income ranges: 8.5% for AGIs below $25k, 4.2% for AGIs $25k-50k, 2.6% for AGIs $50k-75k, 1.7% for AGIs $75k-100k, 1.9% for AGIs $100k-200k, 3.4% for AGIs over 200k)
Taxable individual retirement arrangement distribution: $14,974 (reported on 7.0% of returns)
10950:
$14,974
New York:
$17,621
(% of AGI for various income ranges: 1.5% for AGIs below $25k, 1.9% for AGIs $25k-50k, 1.8% for AGIs $50k-75k, 2.0% for AGIs $75k-100k, 1.8% for AGIs $100k-200k, 0.8% for AGIs over 200k)
Self-employment retirement plans: $18,744 (reported on 0.5% of returns)
10950:
$18,744
New York:
$27,330
(% of AGI for various income ranges: 0.2% for AGIs below $25k, 0.1% for AGIs $100k-200k, 0.4% for AGIs over 200k)
Total itemized deductions: $30,460 (25% of AGI, reported on 43.2% of returns)
Here:
$30,460
State:
$34,985
Here:
25.2% of AGI
State:
21.3% of AGI
(% of AGI for various income ranges: 7.9% for AGIs below $25k, 15.4% for AGIs $25k-50k, 20.7% for AGIs $50k-75k, 22.3% for AGIs $75k-100k, 22.2% for AGIs $100k-200k, 20.3% for AGIs over 200k)
Charity contributions: $5,169 (reported on 38.3% of returns)
Here:
$5,169
State:
$5,572
(% of AGI for various income ranges: 0.4% for AGIs below $25k, 1.3% for AGIs $25k-50k, 2.5% for AGIs $50k-75k, 2.8% for AGIs $75k-100k, 2.5% for AGIs $100k-200k, 5.6% for AGIs over 200k)
Taxes paid: $14,743 (reported on 43.2% of returns)
10950:
$14,743
State:
$18,656
(% of AGI for various income ranges: 3.3% for AGIs below $25k, 5.9% for AGIs $25k-50k, 9.1% for AGIs $50k-75k, 10.4% for AGIs $75k-100k, 11.4% for AGIs $100k-200k, 10.1% for AGIs over 200k)
Earned income credit: $3,932 (reported on 23.8% of returns)
Here:
$3,932
State:
$2,230
(% of AGI for various income ranges: 16.3% for AGIs below $25k, 2.2% for AGIs $25k-50k)
Percentage of individuals using paid preparers for their 2012 taxes: 63.8%
Here:
64%
State:
66%
(% for various income ranges: 49.9% for AGIs below $25k, 69.5% for AGIs $25k-50k, 74.3% for AGIs $50k-75k, 74.4% for AGIs $75k-100k, 74.9% for AGIs $100k-200k, 77.9% for AGIs over 200k)
Averages for the 2004 tax year for zip code 10950, filed in 2005:
Average Adjusted Gross Income (AGI) in 2004: $56,654 (Individual Income Tax Returns)
Here:
$56,654
State:
$59,519
Salary/wage: $52,459 (reported on 87.7% of returns)
Here:
$52,459
State:
$50,673
(% of AGI for various income ranges: 146.3% for AGIs below $10k, 77.8% for AGIs $10k-25k, 79.7% for AGIs $25k-50k, 83.0% for AGIs $50k-75k, 85.6% for AGIs $75k-100k, 78.5% for AGIs over 100k)
Taxable interest for individuals: $1,015 (reported on 56.0% of returns)
This zip code:
$1,015
New York:
$2,377
(% of AGI for various income ranges: 6.0% for AGIs below $10k, 1.7% for AGIs $10k-25k, 1.4% for AGIs $25k-50k, 0.8% for AGIs $50k-75k, 0.8% for AGIs $75k-100k, 0.8% for AGIs over 100k)
Taxable dividends: $1,784 (reported on 28.1% of returns)
Here:
$1,784
State:
$5,394
(% of AGI for various income ranges: 6.0% for AGIs below $10k, 1.2% for AGIs $10k-25k, 0.9% for AGIs $25k-50k, 0.8% for AGIs $50k-75k, 0.6% for AGIs $75k-100k, 0.9% for AGIs over 100k)
Net capital gain/loss: +$7,156 (reported on 21.7% of returns)
Here:
+$7,156
State:
+$23,581
(% of AGI for various income ranges: -2.2% for AGIs below $10k, 0.2% for AGIs $10k-25k, -0.1% for AGIs $25k-50k, 0.5% for AGIs $50k-75k, 0.6% for AGIs $75k-100k, 5.2% for AGIs over 100k)
Profit/loss from business: +$14,302 (reported on 14.9% of returns)
Here:
+$14,302
State:
+$13,809
(% of AGI for various income ranges: 17.1% for AGIs below $10k, 9.2% for AGIs $10k-25k, 4.9% for AGIs $25k-50k, 3.0% for AGIs $50k-75k, 2.1% for AGIs $75k-100k, 3.4% for AGIs over 100k)
IRA payment deduction: $3,500 (reported on 2.7% of returns)
10950:
$3,500
New York:
$3,115
(% of AGI for various income ranges: 0.2% for AGIs $10k-25k, 0.3% for AGIs $25k-50k, 0.2% for AGIs $50k-75k, 0.2% for AGIs $75k-100k, 0.1% for AGIs over 100k)
Self-employed pension: $14,919 (reported on 0.7% of returns)
Here:
$14,919
New York:
$19,016
(% of AGI for various income ranges: 0.1% for AGIs $10k-25k, 0.1% for AGIs $50k-75k, 0.1% for AGIs $75k-100k, 0.3% for AGIs over 100k)
Total itemized deductions: $24,913 (26% of AGI, reported on 48.8% of returns)
Here:
$24,913
State:
$25,864
Here:
25.7% of AGI
State:
21.9% of AGI
(% of AGI for various income ranges: 15.4% for AGIs below $10k, 11.1% for AGIs $10k-25k, 19.1% for AGIs $25k-50k, 25.0% for AGIs $50k-75k, 25.7% for AGIs $75k-100k, 20.8% for AGIs over 100k)
Charity contributions deductions: $3,847 (4% of AGI, reported on 46.0% of returns)
Here:
$3,847
State:
$4,439
Here:
3.9% of AGI
State:
3.6% of AGI
(% of AGI for various income ranges: 0.7% for AGIs below $10k, 1.0% for AGIs $10k-25k, 2.3% for AGIs $25k-50k, 2.9% for AGIs $50k-75k, 3.0% for AGIs $75k-100k, 3.7% for AGIs over 100k)
Total tax: $9,085 (reported on 71.4% of returns)
10950:
$9,085
State:
$11,730
(% of AGI for various income ranges: 4.2% for AGIs below $10k, 3.6% for AGIs $10k-25k, 6.5% for AGIs $25k-50k, 7.8% for AGIs $50k-75k, 8.4% for AGIs $75k-100k, 15.8% for AGIs over 100k)
Earned income credit: $2,880 (reported on 18.3% of returns)
Here:
$2,880
State:
$1,757
Percentage of individuals using paid preparers for their 2004 taxes: 57.5%
Here:
57%
State:
67%
(% for various income ranges: 41.9% for AGIs below $10k, 38.9% for AGIs $10k-25k, 61.7% for AGIs $25k-50k, 71.6% for AGIs $50k-75k, 72.0% for AGIs $75k-100k, 73.8% for AGIs over 100k)
Likely homosexual households (counted as self-reported same-sex unmarried-partner households)
Lesbian couples: 0.0% of all households
Gay men: 0.0% of all households
Household received Food Stamps/SNAP in the past 12 months: 3,711 Household did not receive Food Stamps/SNAP in the past 12 months: 12,060
Women who had a birth in the past 12 months: 2,078 (1,980 now married, 68 unmarried) Women who did not have a birth in the past 12 months: 11,783 (5,831 now married, 5,877 unmarried)
Housing units in zip code 10950 with a mortgage: 6,644 (760 second mortgage, 43 home equity loan, 684 both second mortgage and home equity loan) Houses without a mortgage: 173
Median monthly owner costs for units with a mortgage: $2,735 Median monthly owner costs for units without a mortgage: $1,212
Residents with income below the poverty level in 2022:
This zip code:
29.5%
Whole state:
14.3%
Residents with income below 50% of the poverty level in 2022:
This zip code:
15.8%
Whole state:
6.8%
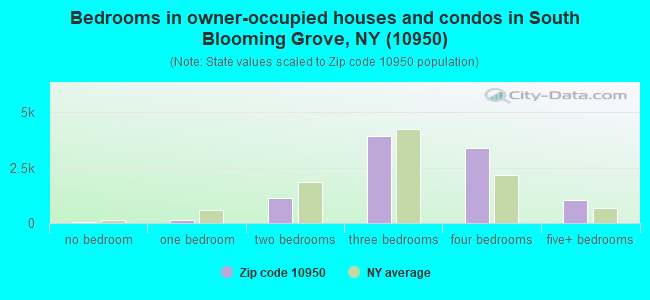
Median number of rooms in houses and condos:
Here:
6.6
State:
6.3
Median number of rooms in apartments:
Here:
5.0
State:
3.8
Notable locations in this zip code not listed on our city pages
Notable locations in zip code 10950: Lake Anne Golf Course (A), Cassidy's Driving Range (B), Monroe Country Club (C), Mansion Ridge Golf Club (D), Ace Farm (E), Camp Monroe (F), Monroe Free Library (G), Monroe Village Hall (H), Eitz Chaim Jewish Community Center (I), Monroe Town Hall (J), Mountain Lodge Park Fire Company (K), Lakeside Fire and Rescue Company (L), Monroe Fire District Station 1 (M). Display/hide their locations on the map
Shopping Centers: Blooming Grove Plaza Shopping Center (1), Goose Pond Plaza Shopping Center (2), Shop Rite Plaza Shopping Center (3), Monroe Plaza Shopping Center (4), Liberty Plaza Shopping Center (5), Super Stop And Shop Plaza Shopping Center (6), Monroe Federal Plaza Shopping Center (7), Gateway Plaza Shopping Center (8). Display/hide their locations on the map
Churches in zip code 10950 include: Saint Paul Lutheran Church (A), Sacred Heart Church (B), Presbyterian Church of Monroe (C), Monroe United Methodist Church (D), Grace Episcopal Church (E), Calvary Assembly of God (F), Congregation Chaim Barucha (G), Congregation Hayushor Vehatov (H), Congregation Yetev Lev (I). Display/hide their locations on the map
Lakes and reservoirs: Merriewold Lake (A), Monroe Ponds (B), Mountain Lakes (C), Orange-Rockland Lake (D), Placid Pond (E), Round Lake (F), Lake Sapphire (G), Shadow Lake (H). Display/hide their locations on the map
In group quarters: 481 (-1 institutionalized population)
Size of family households: 2,899 2-persons, 2,799 3-persons, 2,580 4-persons, 1,417 5-persons, 961 6-persons, 2,614 7-or-more-persons
Size of nonfamily households: 1,779 1-person, 254 2-persons, 64 3-persons
23,710 married couples with children.
1,330 single-parent households (367 men, 963 women).
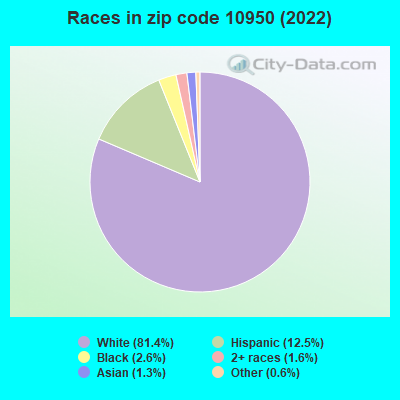
36.1% of residents of 10950 zip code speak English at home.
8.8% of residents speak Spanish at home (65% very well, 22% well, 9% not well, 4% not at all).
54.3% of residents speak other Indo-European language at home (29% very well, 36% well, 21% not well, 15% not at all).
0.7% of residents speak Asian or Pacific Island language at home (63% very well, 10% well, 27% not well).
2.1% of residents speak other language at home (57% very well, 24% well, 15% not well, 3% not at all).
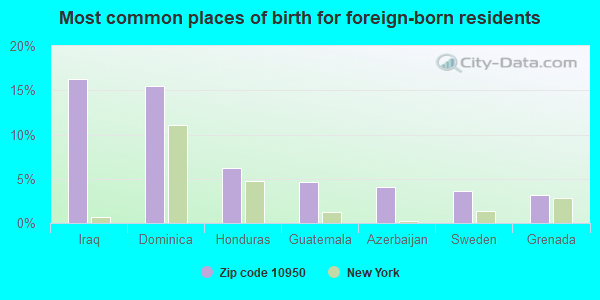
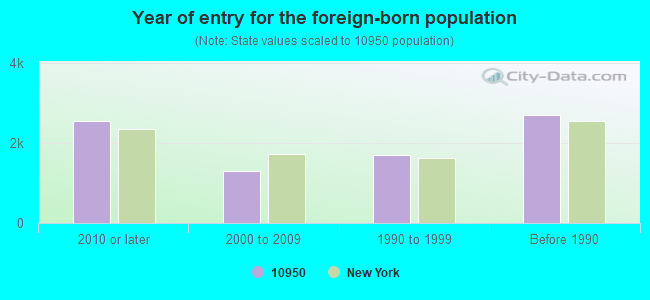
Foreign born population: 6,580 (10.6%) (67.0% of them are naturalized citizens)
Facilities with environmental interests located in this zip code:
ARROW PARK INC. (465 MAIN ST in MONROE, NY)
(Integrated Compliance Information System) - ICIS-02-2001-8068, FORMAL ENFORCEMENT ACTION COMMUNITY WATER SYSTEM (SDWIS) - SDWIS-NY3503536 21928, WATER TREATMENT PLANT Business SIC classification: WATER SUPPLY
ACE FARM (COUNTY ROUTE 105, PO BOX 447 in MONROE, NY)
STATE MASTER (New York facility tracking) - National Pollutant Discharge Elimination System Permit National Pollutant Discharge Elimination System NON-MAJOR (Tracking pollutant discharge elimination systems) - permit Business SIC classification: GENERAL FARMS, PRIMARILY LIVESTOCK AND ANIMAL SPECIALTIES Alternative names: TYLER ETZEL, JR.
HIGH QUALITY CLEANERS (785 ROUTE 17M in MONROE, NY)
AIR MINOR (AIRS/AFS) STATE MASTER (New York facility tracking) - AIR PROGRAM, HAZARDOUS WASTE PROGRAM Business SIC classification: DRYCLEANING PLANTS, EXCEPT RUG CLEANING Business NAICS classification: DRYCLEANING AND LAUNDRY SERVICES (EXCEPT COIN-OPERATED). Organizations: PET-RITE INC (LEGALLY RESPONSIBLE PARTY)
APPLE AUTO BODY (231 RT 17M LIBERTY PLAZA in MONROE, NY)
STATE MASTER (New York facility tracking) - AIR PROGRAM, Small Quantity Generators, between 100 kg and 1000 kg of hazardous waste/month (Resource Conservation and Recovery Act (tracking hazardous waste)) - notification Organizations: MICHAEL HAGOPIAN (CONTACT/OWNER)
Alternative names: APPLE AUTOMOTIVE INC DBA APPLE AUTO BODY
ACRES RD ( in MONROE, NY)
National Pollutant Discharge Elimination System NON-MAJOR (Tracking pollutant discharge elimination systems) - permit Organizations: MYM MANAGEMENT (CONTACT/OWNER)
Alternative names: ACRES DEVELOPMENT
A T & T CORP (NEPTUNE RD - 2 MI S OF MONROE in MONROE, NY)
(Resource Conservation and Recovery Act (tracking hazardous waste))
ALL-MATIC TRANSMISSIONS INC. (228 ELM ST in MONROE, NY)
(Resource Conservation and Recovery Act (tracking hazardous waste))
GENOVESE DRUG STORES INC (ROUTE 17M in MONROE, NY)
(Resource Conservation and Recovery Act (tracking hazardous waste))
GILLEN REAL ESTATE (371 ORCHARD DR in MONROE, NY)
ENFORCEMENT/COMPLIANCE ACTIVITY (Integrated Compliance Information System) COMPLIANCE ACTIVITY (Tracking inspections of insecticide, fungicide, and rodenticide, and toxic substances)
HOME DEPOT USA INC HD1284 (254 LARKIN DR in MONROE, NY)
Conditionally Exempt Small Quantity Generators, less than 100 kg/month of hazardous waste (Resource Conservation and Recovery Act (tracking hazardous waste)) Alternative names: HOME DEPOT THE 1284
HUMMELS COIN LAUNDRY (RTE 17M in MONROE, NY)
(Resource Conservation and Recovery Act (tracking hazardous waste))
ALAN BURTON CONSTRUCTION (BROOKSIDE RD in MONROE, NY)
COMPLIANCE ACTIVITY (Tracking inspections of insecticide, fungicide, and rodenticide, and toxic substances)
HIGH QUALITY (RTE 17M JAMESWAY PLZ in MONROE, NY)
Small Quantity Generators, between 100 kg and 1000 kg of hazardous waste/month (Resource Conservation and Recovery Act (tracking hazardous waste))
Housing units lacking complete plumbing facilities: 1.4% Housing units lacking complete kitchen facilities: 2.1%
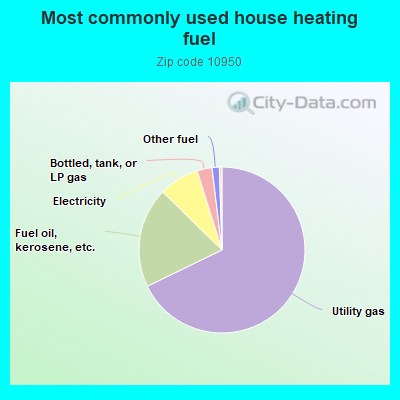
67.4%Utility gas
19.4%Fuel oil, kerosene, etc.
7.8%Electricity
2.9%Bottled, tank, or LP gas
1.4%Other fuel
0.5%Wood
Population in 1990: 30,829. Population change in the 1990s: +7,962 (+25.8%).
Place of birth for U.S.-born residents:
This state: 48,329
Northeast: 3,566
Midwest: 591
South: 798
West: 351
68% of the 10950 zip code residents lived in the same house 5 years ago. Out of people who lived in different houses, 52% lived in this county. Out of people who lived in different counties, 50% lived in New York.
93% of the 10950 zip code residents lived in the same house 1 year ago. Out of people who lived in different houses, 42% moved from this county. Out of people who lived in different houses, 52% moved from different county within same state. Out of people who lived in different houses, 4% moved from different state. Out of people who lived in different houses, 3% moved from abroad.
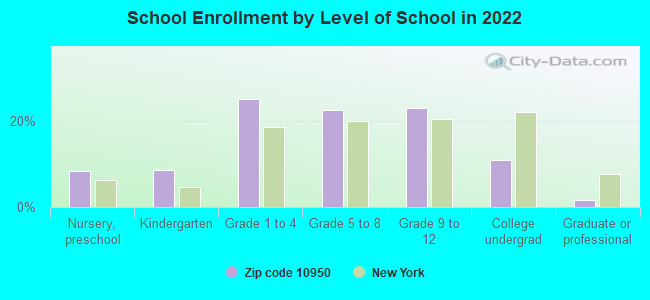
Private vs. public school enrollment:
Students in private schools in grades 1 to 8 (elementary and middle school): 9,529
Here:
80.2%
New York:
15.6%
Students in private schools in grades 9 to 12 (high school): 3,554
Here:
63.1%
New York:
15.0%
Students in private undergraduate colleges: 1,612
Here:
59.7%
New York:
39.2%
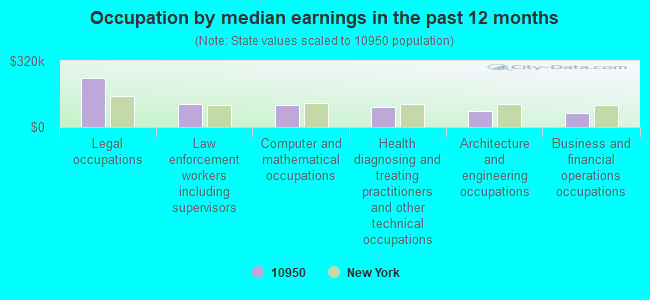
Occupation by median earnings in the past 12 months ($)
237,766Legal occupations
111,741Law enforcement workers including supervisors
108,988Computer and mathematical occupations
96,459Health diagnosing and treating practitioners and other technical occupations
79,388Architecture and engineering occupations
69,840Business and financial operations occupations
Companies with federal contracts located in this zip code (MONROE, NY):
AMERICAN AUTO LOGISTICS, INC (671 ROUTE 17M) : $650,099,587 in 6 contractsfrom 2000 to 2003
Contracts for Other Cargo and Freight Services by Army Signed by year:2000: $203,662,467; 2001: $204,318,592; 2002: $217,118,528; 2003: $25,000,000; 2004: $0; 2005: $0; 2006: $0.
Biggest contracts:
$207,118,528 with Army for Other Cargo and Freight Services. Signed on 2002-11-01. Completion date: 2003-10-31.
$204,318,592, same as above.Signed on 2001-10-31. Completion date: 2002-10-31.
$203,662,467, same as above.Signed on 2000-10-30. Completion date: 2001-10-31.
$15,000,000, same as above.Signed on 2003-12-31. Completion date: 2003-10-31.
ACQIRIS, LLC (234 CROMWELL HILL ROAD; small business) : $2,124,141 in 22 contractsfrom 2000 to 2006
Contracts for Electrical and Electronic Properties Measuring and Testing Instruments, ADP Software, Other Defense -- Applied Research and Exploratory Development (R&D), Pressure, Temperature, and Humidity Measuring and Controlling Instruments, and moreby Department of Defense, Navy, NASA, Air Force, and others Signed by year:2000: $54,796; 2001: $310,097; 2002: $926,660; 2003: $555,314; 2004: $137,269; 2005: $119,207; 2006: $20,798.
Biggest contracts:
$881,293 with Department of Defense for Electrical and Electronic Properties Measuring and Testing Instruments. Signed on 2002-09-20. Completion date: 2002-11-18.
$323,572 with Navy for Electrical and Electronic Properties Measuring and Testing Instruments. Signed on 2003-02-14. Completion date: 2003-05-14.
$222,000 with NASA for ADP Software. Signed on 2001-04-15. Completion date: 2001-04-15.
$144,982 with Navy for Electrical and Electronic Properties Measuring and Testing Instruments. Signed on 2003-03-19. Completion date: 2003-06-20.
AZAR DECORATING CORP (TWO KAHAN DRIVE; small business) : $1,535,673 in 12 contractsfrom 2000 to 2004
Contracts for Household Furniture, Office Furniture, Miscellaneous Furniture and Fixtures, Cabinets, Lockers, Bins, and Shelving by Navy, Army Signed by year:2000: $772,475; 2001: $274,478; 2002: $482,108; 2003: $2,812; 2004: $3,800; 2005: $0; 2006: $0.
Biggest contracts:
$380,024 with Navy for Household Furniture. Signed on 2002-06-18. Completion date: 2002-08-16.
$248,113, same as above.Signed on 2000-07-05. Completion date: 2000-09-22.
$248,113, same as above.Signed on 2000-07-05. Completion date: 2000-08-18.
$246,012 with Army for Office Furniture. Signed on 2000-07-24. Completion date: 2000-11-10.
ALL AMERICAN DOOR HARDWARE INC (154 ACRES RD; small business) : $35,591 in 6 contractsfrom 2003 to 2005
Contracts for Hardware, Commercial, Miscellaneous Alarm, Signal and Security Detection Systems, Hardware, Weapon System by Uniformed Services University of the Health Sciences, Army, Navy Signed by year:2000: $0; 2001: $0; 2002: $0; 2003: $6,514; 2004: $0; 2005: $29,077; 2006: $0.
Biggest contracts:
$7,693 with Uniformed Services University of the Health Sciences for Hardware, Commercial. Taking place in MD. Signed on 2005-07-12. Completion date: 2005-06-07.
$7,110 with Army for Hardware, Commercial. Taking place in AZ. Signed on 2005-01-04. Completion date: 2005-02-04.
$6,514 with Navy for Hardware, Commercial. Signed on 2003-09-25. Completion date: 2003-10-06.
$6,408 with Army for Hardware, Commercial. Signed on 2005-09-09. Completion date: 2005-09-30.
HORSESHOE ACRES (76 PEDDLER HILL RD; small business) : $11,097 in 6 contractsfrom 2003 to 2005
Contracts for Forage and Feed, Grazing/Range Studies, Veterinary/Animal Care Services by Army Signed by year:2000: $0; 2001: $0; 2002: $0; 2003: $3,188; 2004: $3,625; 2005: $4,284; 2006: $0.
Biggest contracts:
$4,288 with Army for Forage and Feed. Signed on 2005-11-16. Completion date: 2006-09-30.
$3,625 with Army for Grazing/Range Studies. Signed on 2004-12-06. Completion date: 2005-09-30.
$3,188 with Army for Veterinary/Animal Care Services. Signed on 2003-11-28. Completion date: 2004-09-30.
$0 with Army for Forage and Feed. Signed on 2005-11-16. Completion date: 2006-09-30.
Top industries in this zip code by the number of employees in 2005:
Other Services (except Public Administration): Religious Organizations (50-99 employees: 2 establishments, 20-49 employees: 3 establishments, 10-19 employees: 4 establishments, 5-9 employees: 5 establishments, 1-4 employees: 5 establishments)
2002 - 2018 National Fire Incident Reporting System (NFIRS) incidents
Based on the data from the years 2002 - 2018 the average number of fires per year is 183. The highest number of fire incidents - 349 took place in 2017, and the least - 51 in 2018. The data has a declining trend.
When looking into fire subcategories, the most reports belonged to: Outside Fires (44.8%), and Structure Fires (42.3%).
Fire incident types reported to NFIRS in Zip Code 10950


 Nearest zip codes: 10975, 10918, 10910, 10926, 10917, 10930.
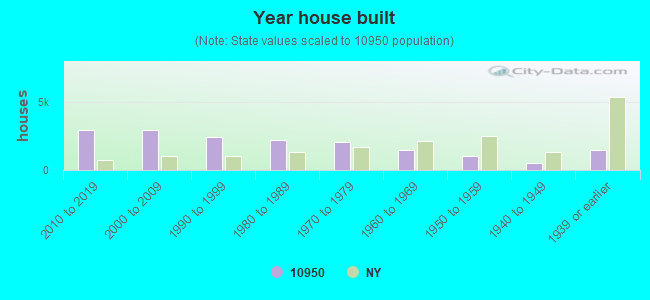


 Based on the data from the years 2002 - 2018 the average number of fires per year is 183. The highest number of fire incidents - 349 took place in 2017, and the least - 51 in 2018. The data has a declining trend.
 When looking into fire subcategories, the most reports belonged to: Outside Fires (44.8%), and Structure Fires (42.3%).