Estimated zip code population in 2022: 9,545 Zip code population in 2010: 9,027 Zip code population in 2000: 8,501
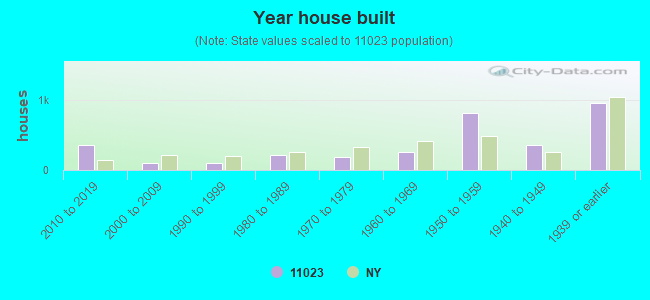
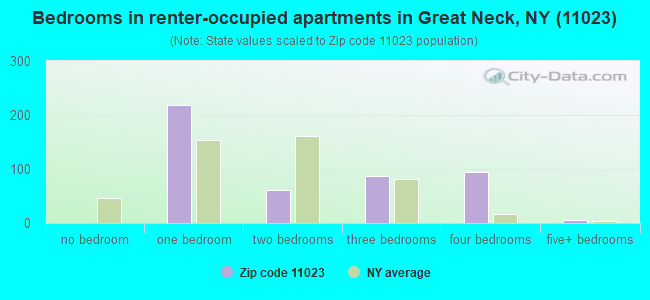
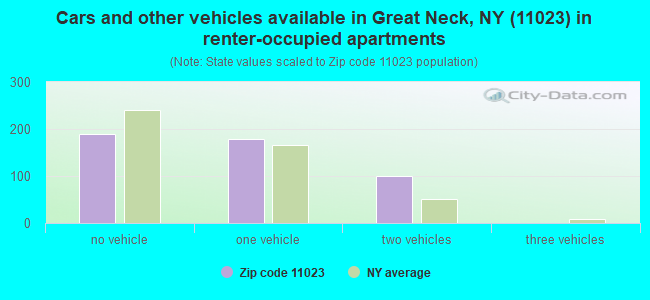
Houses and condos: 3,343 Renter-occupied apartments: 469
% of renters here:
15%
State:
46%
March 2022 cost of living index in zip code 11023: 148.3 (very high, U.S. average is 100)
Land area: 1.7 sq. mi. Water area: 0.1 sq. mi.
Population density: 5,764 people per square mile
(average).
OSM Map
General Map
Google Map
MSN Map
OSM Map
General Map
Google Map
MSN Map
OSM Map
General Map
Google Map
MSN Map
OSM Map
General Map
Google Map
MSN Map
Please wait while loading the map...
Real estate property taxes paid for housing units in 2022:
This zip code:
0.9% ($9,805)
New York:
1.5% ($6,180)
Median real estate property taxes paid for housing units with mortgages in 2022: $9,858 (0.8%) Median real estate property taxes paid for housing units with no mortgage in 2022: $9,755 (1.0%)
Business Search- 14 Million verified businesses
Males: 5,010
(52.5%)
Females: 4,534
(47.5%)
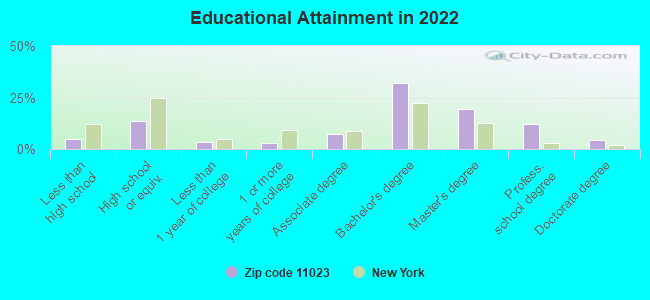
For population 25 years and over in 11023:
High school or higher: 96.2%
Bachelor's degree or higher: 68.5%
Graduate or professional degree: 36.1%
Unemployed: 1.7%
Mean travel time to work (commute): 36.5 minutes
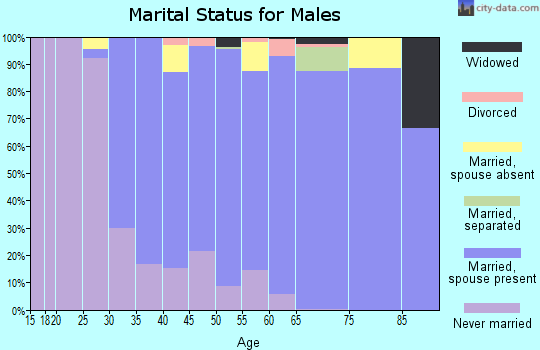
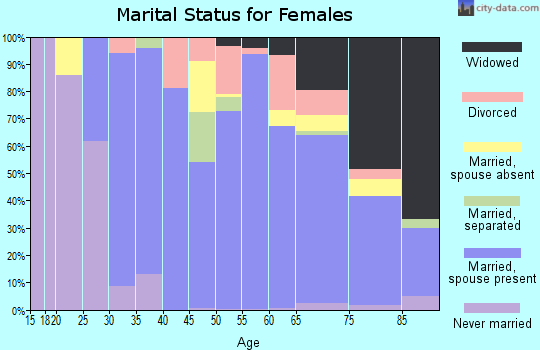
For population 15 years and over in 11023:
Never married: 21.0%
Now married: 67.2%
Separated: 0.3%
Widowed: 7.3%
Divorced: 4.2%
Zip code 11023 compared to state average:
Median household income above state average.
Median house value significantly above state average.
Unemployed percentage significantly below state average.
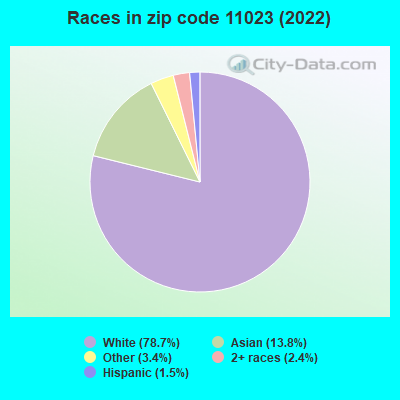
Black race population percentage significantly below state average.
Hispanic race population percentage significantly below state average.
Renting percentage significantly below state average.
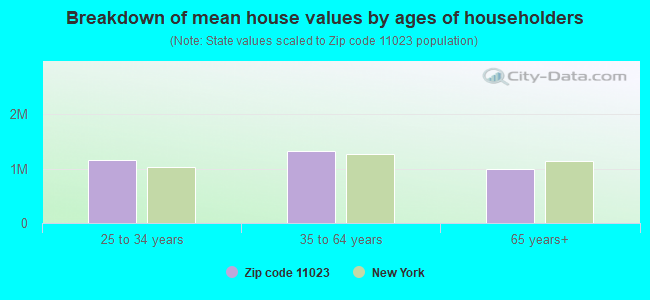
Estimated median house/condo value in 2022: $1,133,337
11023:
$1,133,337
New York:
$400,400
Median resident age:
This zip code:
39.3 years
New York median age:
40.0 years
Average household size:
This zip code:
3.1 people
New York:
2.5 people
Averages for the 2020 tax year for zip code 11023, filed in 2021:
Average Adjusted Gross Income (AGI) in 2020: $188,129 (Individual Income Tax Returns)
Here:
$188,129
State:
$90,930
Salary/wage: $135,682 (reported on 71.6% of returns)
Here:
$135,682
State:
$72,104
(% of AGI for various income ranges: 1280.9% for AGIs below $25k, 4065.0% for AGIs $25k-50k, 7299.1% for AGIs $50k-75k, 10698.1% for AGIs $75k-100k, 22743.5% for AGIs $100k-200k, 118368.4% for AGIs over 200k)
Taxable interest for individuals: $6,891 (reported on 58.9% of returns)
This zip code:
$6,891
New York:
$3,075
(% of AGI for various income ranges: 96.7% for AGIs below $25k, 143.3% for AGIs $25k-50k, 276.5% for AGIs $50k-75k, 473.1% for AGIs $75k-100k, 1205.8% for AGIs $100k-200k, 4647.2% for AGIs over 200k)
Ordinary dividends: $16,186 (reported on 45.6% of returns)
Here:
$16,186
State:
$11,095
(% of AGI for various income ranges: 122.4% for AGIs below $25k, 228.0% for AGIs $25k-50k, 351.3% for AGIs $50k-75k, 488.1% for AGIs $75k-100k, 1638.5% for AGIs $100k-200k, 9527.6% for AGIs over 200k)
Net capital gain/loss in AGI: +$56,911 (reported on 46.8% of returns)
Here:
+$56,911
State:
+$44,925
(% of AGI for various income ranges: 186.5% for AGIs below $25k, 271.0% for AGIs $25k-50k, 442.2% for AGIs $50k-75k, 525.6% for AGIs $75k-100k, 2350.4% for AGIs $100k-200k, 40762.4% for AGIs over 200k)
Profit/loss from business: +$41,799 (reported on 26.0% of returns)
Here:
+$41,799
State:
+$14,940
(% of AGI for various income ranges: 457.2% for AGIs below $25k, 553.3% for AGIs $25k-50k, 862.2% for AGIs $50k-75k, 974.4% for AGIs $75k-100k, 2368.1% for AGIs $100k-200k, 12839.6% for AGIs over 200k)
Taxable individual retirement arrangement distribution: $31,106 (reported on 8.6% of returns)
11023:
$31,106
New York:
$19,609
(% of AGI for various income ranges: 32.0% for AGIs below $25k, 116.3% for AGIs $25k-50k, 310.0% for AGIs $50k-75k, 414.4% for AGIs $75k-100k, 1175.4% for AGIs $100k-200k, 2508.0% for AGIs over 200k)
Self-employed (Keogh) retirement plans: $39,620 (reported on 3.6% of returns)
11023:
$39,620
New York:
$32,497
(% of AGI for various income ranges: 195.4% for AGIs $100k-200k, 2174.0% for AGIs over 200k)
Total itemized deductions: $45,229 (reported on 27.2% of returns)
Here:
$45,229
State:
$39,326
(% of AGI for various income ranges: 261.1% for AGIs below $25k, 522.0% for AGIs $25k-50k, 923.0% for AGIs $50k-75k, 2066.9% for AGIs $75k-100k, 3645.0% for AGIs $100k-200k, 13554.8% for AGIs over 200k)
Charity contributions: $16,023 (reported on 24.1% of returns)
Here:
$16,023
State:
$15,420
(% of AGI for various income ranges: 8.0% for AGIs below $25k, 70.7% for AGIs $25k-50k, 164.3% for AGIs $50k-75k, 300.6% for AGIs $75k-100k, 728.8% for AGIs $100k-200k, 5272.0% for AGIs over 200k)
Taxes paid: $9,690 (reported on 27.2% of returns)
11023:
$9,690
State:
$9,183
(% of AGI for various income ranges: 82.0% for AGIs below $25k, 168.3% for AGIs $25k-50k, 287.4% for AGIs $50k-75k, 589.4% for AGIs $75k-100k, 964.6% for AGIs $100k-200k, 2421.2% for AGIs over 200k)
Earned income credit: $1,858 (reported on 7.4% of returns)
Here:
$1,858
State:
$2,138
(% of AGI for various income ranges: 75.9% for AGIs below $25k, 75.7% for AGIs $25k-50k)
Percentage of individuals using paid preparers for their 2020 taxes: 94.3%
Here:
94%
State:
95%
(% for various income ranges: 93.0% for AGIs below $25k, 92.6% for AGIs $25k-50k, 95.3% for AGIs $50k-75k, 97.0% for AGIs $75k-100k, 93.2% for AGIs $100k-200k, 96.0% for AGIs over 200k)
Averages for the 2012 tax year for zip code 11023, filed in 2013:
Average Adjusted Gross Income (AGI) in 2012: $168,321 (Individual Income Tax Returns)
Here:
$168,321
State:
$77,088
Salary/wage: $108,322 (reported on 71.0% of returns)
Here:
$108,322
State:
$60,593
(% of AGI for various income ranges: 59.7% for AGIs below $25k, 66.3% for AGIs $25k-50k, 59.3% for AGIs $50k-75k, 56.8% for AGIs $75k-100k, 56.1% for AGIs $100k-200k, 40.7% for AGIs over 200k)
Taxable interest for individuals: $7,028 (reported on 68.2% of returns)
This zip code:
$7,028
New York:
$3,125
(% of AGI for various income ranges: 6.4% for AGIs below $25k, 2.7% for AGIs $25k-50k, 3.4% for AGIs $50k-75k, 2.8% for AGIs $75k-100k, 2.8% for AGIs $100k-200k, 2.8% for AGIs over 200k)
Ordinary dividends: $18,353 (reported on 47.4% of returns)
Here:
$18,353
State:
$10,299
(% of AGI for various income ranges: 6.5% for AGIs below $25k, 3.7% for AGIs $25k-50k, 4.8% for AGIs $50k-75k, 4.0% for AGIs $75k-100k, 3.7% for AGIs $100k-200k, 5.6% for AGIs over 200k)
Net capital gain/loss in AGI: +$40,564 (reported on 46.2% of returns)
Here:
+$40,564
State:
+$42,474
(% of AGI for various income ranges: 1.1% for AGIs $25k-50k, 0.6% for AGIs $50k-75k, 2.6% for AGIs $75k-100k, 2.3% for AGIs $100k-200k, 14.9% for AGIs over 200k)
Profit/loss from business: +$49,746 (reported on 25.9% of returns)
Here:
+$49,746
State:
+$16,168
(% of AGI for various income ranges: 23.6% for AGIs below $25k, 14.5% for AGIs $25k-50k, 10.4% for AGIs $50k-75k, 8.5% for AGIs $75k-100k, 6.9% for AGIs $100k-200k, 7.0% for AGIs over 200k)
Taxable individual retirement arrangement distribution: $47,755 (reported on 14.1% of returns)
11023:
$47,755
New York:
$17,621
(% of AGI for various income ranges: 3.7% for AGIs below $25k, 2.1% for AGIs $25k-50k, 4.1% for AGIs $50k-75k, 4.3% for AGIs $75k-100k, 5.4% for AGIs $100k-200k, 3.8% for AGIs over 200k)
Self-employment retirement plans: $33,388 (reported on 4.1% of returns)
11023:
$33,388
New York:
$27,330
(% of AGI for various income ranges: 1.0% for AGIs $100k-200k, 0.9% for AGIs over 200k)
Total itemized deductions: $55,068 (21% of AGI, reported on 61.0% of returns)
Here:
$55,068
State:
$34,985
Here:
21.3% of AGI
State:
21.3% of AGI
(% of AGI for various income ranges: 30.5% for AGIs below $25k, 31.5% for AGIs $25k-50k, 29.6% for AGIs $50k-75k, 29.6% for AGIs $75k-100k, 26.7% for AGIs $100k-200k, 16.6% for AGIs over 200k)
Charity contributions: $7,747 (reported on 54.4% of returns)
Here:
$7,747
State:
$5,572
(% of AGI for various income ranges: 1.4% for AGIs below $25k, 2.0% for AGIs $25k-50k, 2.5% for AGIs $50k-75k, 2.6% for AGIs $75k-100k, 3.0% for AGIs $100k-200k, 2.4% for AGIs over 200k)
Taxes paid: $33,008 (reported on 60.8% of returns)
11023:
$33,008
State:
$18,656
(% of AGI for various income ranges: 13.8% for AGIs below $25k, 16.5% for AGIs $25k-50k, 14.4% for AGIs $50k-75k, 14.9% for AGIs $75k-100k, 13.7% for AGIs $100k-200k, 11.0% for AGIs over 200k)
Earned income credit: $1,797 (reported on 8.2% of returns)
Here:
$1,797
State:
$2,230
(% of AGI for various income ranges: 3.9% for AGIs below $25k, 0.8% for AGIs $25k-50k)
Percentage of individuals using paid preparers for their 2012 taxes: 82.1%
Here:
82%
State:
66%
(% for various income ranges: 79.1% for AGIs below $25k, 82.1% for AGIs $25k-50k, 80.5% for AGIs $50k-75k, 78.8% for AGIs $75k-100k, 85.1% for AGIs $100k-200k, 85.5% for AGIs over 200k)
Averages for the 2004 tax year for zip code 11023, filed in 2005:
Average Adjusted Gross Income (AGI) in 2004: $137,101 (Individual Income Tax Returns)
Here:
$137,101
State:
$59,519
Salary/wage: $90,683 (reported on 66.8% of returns)
Here:
$90,683
State:
$50,673
(% of AGI for various income ranges: 57.0% for AGIs $10k-25k, 62.1% for AGIs $25k-50k, 57.8% for AGIs $50k-75k, 48.6% for AGIs $75k-100k, 40.4% for AGIs over 100k)
Taxable interest for individuals: $6,510 (reported on 79.3% of returns)
This zip code:
$6,510
New York:
$2,377
(% of AGI for various income ranges: 10.6% for AGIs $10k-25k, 5.6% for AGIs $25k-50k, 5.8% for AGIs $50k-75k, 4.8% for AGIs $75k-100k, 3.1% for AGIs over 100k)
Taxable dividends: $11,886 (reported on 59.0% of returns)
Here:
$11,886
State:
$5,394
(% of AGI for various income ranges: 8.4% for AGIs $10k-25k, 5.6% for AGIs $25k-50k, 3.9% for AGIs $50k-75k, 3.8% for AGIs $75k-100k, 4.9% for AGIs over 100k)
Net capital gain/loss: +$47,424 (reported on 55.9% of returns)
Here:
+$47,424
State:
+$23,581
(% of AGI for various income ranges: 0.9% for AGIs $10k-25k, 1.1% for AGIs $25k-50k, 1.8% for AGIs $50k-75k, 3.7% for AGIs $75k-100k, 21.9% for AGIs over 100k)
Profit/loss from business: +$40,545 (reported on 23.8% of returns)
Here:
+$40,545
State:
+$13,809
(% of AGI for various income ranges: 15.3% for AGIs $10k-25k, 12.0% for AGIs $25k-50k, 9.3% for AGIs $50k-75k, 9.1% for AGIs $75k-100k, 6.3% for AGIs over 100k)
IRA payment deduction: $4,225 (reported on 5.0% of returns)
11023:
$4,225
New York:
$3,115
(% of AGI for various income ranges: 0.6% for AGIs $10k-25k, 0.5% for AGIs $25k-50k, 0.5% for AGIs $50k-75k, 0.4% for AGIs $75k-100k, 0.1% for AGIs over 100k)
Self-employed pension: $27,840 (reported on 5.4% of returns)
Here:
$27,840
New York:
$19,016
(% of AGI for various income ranges: 0.5% for AGIs $50k-75k, 0.6% for AGIs $75k-100k, 1.2% for AGIs over 100k)
Total itemized deductions: $44,829 (20% of AGI, reported on 60.9% of returns)
Here:
$44,829
State:
$25,864
Here:
20.4% of AGI
State:
21.9% of AGI
(% of AGI for various income ranges: 33.9% for AGIs $10k-25k, 30.3% for AGIs $25k-50k, 32.3% for AGIs $50k-75k, 31.1% for AGIs $75k-100k, 17.0% for AGIs over 100k)
Charity contributions deductions: $7,385 (3% of AGI, reported on 56.6% of returns)
Here:
$7,385
State:
$4,439
Here:
3.3% of AGI
State:
3.6% of AGI
(% of AGI for various income ranges: 2.8% for AGIs $10k-25k, 2.9% for AGIs $25k-50k, 3.5% for AGIs $50k-75k, 3.9% for AGIs $75k-100k, 2.9% for AGIs over 100k)
Total tax: $35,104 (reported on 78.5% of returns)
11023:
$35,104
State:
$11,730
(% of AGI for various income ranges: 5.8% for AGIs $10k-25k, 7.8% for AGIs $25k-50k, 8.9% for AGIs $50k-75k, 9.9% for AGIs $75k-100k, 21.5% for AGIs over 100k)
Earned income credit: $1,336 (reported on 5.7% of returns)
Here:
$1,336
State:
$1,757
Percentage of individuals using paid preparers for their 2004 taxes: 81.1%
Here:
81%
State:
67%
(% for various income ranges: 78.1% for AGIs below $10k, 81.7% for AGIs $10k-25k, 77.2% for AGIs $25k-50k, 81.0% for AGIs $50k-75k, 83.5% for AGIs $75k-100k, 84.2% for AGIs over 100k)
Household received Food Stamps/SNAP in the past 12 months: 277 Household did not receive Food Stamps/SNAP in the past 12 months: 2,774
Women who had a birth in the past 12 months: 136 (134 now married, 0 unmarried) Women who did not have a birth in the past 12 months: 1,642 (864 now married, 765 unmarried)
Housing units in zip code 11023 with a mortgage: 1,514 (198 second mortgage, 200 both second mortgage and home equity loan) Houses without a mortgage: 23
Median monthly owner costs for units with a mortgage: $3,860 Median monthly owner costs for units without a mortgage: $1,487
Residents with income below the poverty level in 2022:
This zip code:
6.1%
Whole state:
14.3%
Residents with income below 50% of the poverty level in 2022:
This zip code:
5.3%
Whole state:
6.8%
Median number of rooms in houses and condos:
Here:
7.6
State:
6.3
Median number of rooms in apartments:
Here:
3.9
State:
3.8
Notable locations in this zip code not listed on our city pages
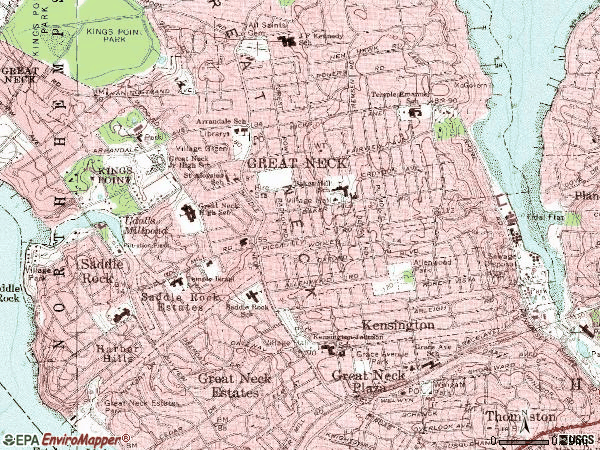
Notable locations in zip code 11023: Village Green (A), Great Neck Village Hall (B), Great Neck Library (C), Alert Engine Hook Ladder and Hose (D), Manhasset - Lakeville Fire Department (E). Display/hide their locations on the map
Churches in zip code 11023 include: Temple Beth-El of Great Neck (A), Saint Alaoysius Korean Community Catholic Church (B), Temple Israel of Great Neck (C). Display/hide their locations on the map
In group quarters: 40 (-1 institutionalized population)
Size of family households: 716 2-persons, 437 3-persons, 494 4-persons, 431 5-persons, 79 6-persons, 180 7-or-more-persons
Size of nonfamily households: 687 1-person, 11 2-persons
2,799 married couples with children.
152 single-parent households (34 men, 118 women).
57.6% of residents of 11023 zip code speak English at home.
3.2% of residents speak Spanish at home (97% very well, 3% well).
19.9% of residents speak other Indo-European language at home (62% very well, 24% well, 13% not well, 1% not at all).
13.3% of residents speak Asian or Pacific Island language at home (68% very well, 17% well, 12% not well, 3% not at all).
6.3% of residents speak other language at home (83% very well, 7% well, 10% not well).
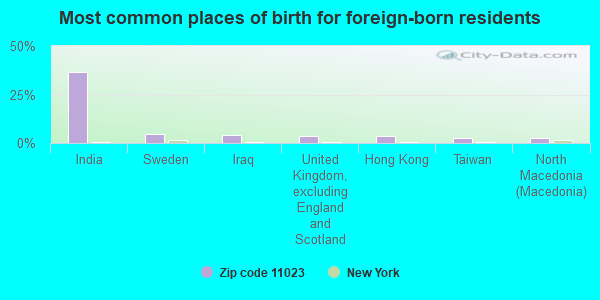
Foreign born population: 2,852 (29.9%) (80.1% of them are naturalized citizens)
This zip code:
29.9%
Whole state:
22.7%
36%India
5%Sweden
4%Iraq
4%United Kingdom, excluding England and Scotland
4%Hong Kong
2%Taiwan
2%North Macedonia (Macedonia)
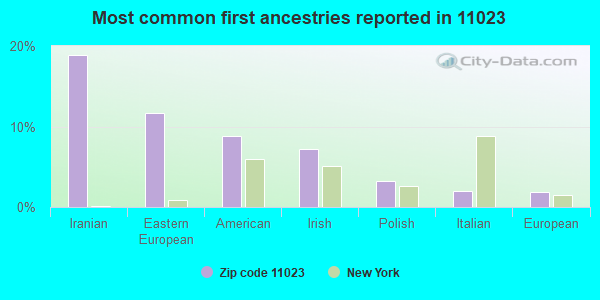
19%Iranian
12%Eastern European
9%American
7%Irish
3%Polish
2%Italian
2%European
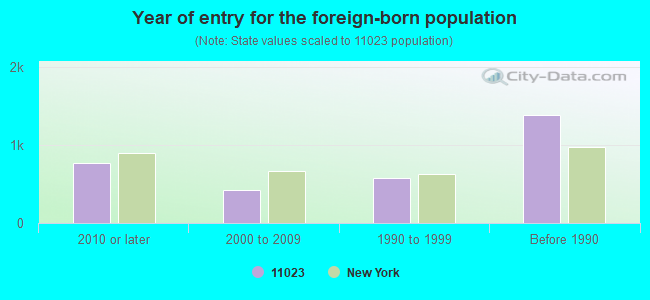
Year of entry for the foreign-born population
7742010 or later
4192000 to 2009
5821990 to 1999
1,385Before 1990
Facilities with environmental interests located in this zip code:
GREAT NECK (V) WPCP (265 EAST SHORE ROAD in GREAT NECK, NY)
(Integrated Compliance Information System) - ICIS-02-2002-3092, FORMAL ENFORCEMENT ACTION National Pollutant Discharge Elimination System MAJOR (Tracking pollutant discharge elimination systems) - permit - ICIS-02-2005-3199, ENFORCEMENT/COMPLIANCE ACTIVITY, ICIS-02-2005-3309, Business SIC classification: SEWERAGE SYSTEMS
GREAT NECK NORTH HS ( in GREAT NECK, NY)
(National Center for Education Statistics) - STATE ID-280407030015 Organizations: GREAT NECK UFSD (SCHOOL DISTRICT)
GREAT NECK NORTH MS ( in GREAT NECK, NY)
(National Center for Education Statistics) - STATE ID-280407030012 Organizations: GREAT NECK UFSD (SCHOOL DISTRICT)
GREAT NECK WPC DISTRICT (236 EAST SHORE ROAD in GREAT NECK, NY)
National Pollutant Discharge Elimination System MAJOR (Tracking pollutant discharge elimination systems) - permit - ICIS-02-2004-3067, FORMAL ENFORCEMENT ACTION Business SIC classification: SEWERAGE SYSTEMS
GETTY SERVICE STATION 58027 (120 CUTTER MILL RD in GREAT NECK, NY)
Conditionally Exempt Small Quantity Generators, less than 100 kg/month of hazardous waste (Resource Conservation and Recovery Act (tracking hazardous waste)) - notification TRANSPORTER (Resource Conservation and Recovery Act (tracking hazardous waste)) - notification Organizations: GETTY PETROLEUM CORP (CONTACT/OWNER)
GREAT NECK NORTH HIGH SCHOOL (35 POLO RD in GREAT NECK, NY)
(Resource Conservation and Recovery Act (tracking hazardous waste))
GREAT NECK CLEANERS (595 MIDDLE NECK RD in GREAT NECK, NY)
Conditionally Exempt Small Quantity Generators, less than 100 kg/month of hazardous waste (Resource Conservation and Recovery Act (tracking hazardous waste)) - notification Organizations: PROSPECT LAUNDROMAT INC (CONTACT/OWNER)
Housing units lacking complete plumbing facilities: 1.1% Housing units lacking complete kitchen facilities: 1.7%
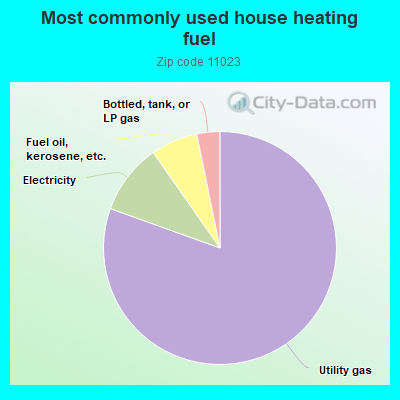
80.5%Utility gas
9.8%Electricity
6.5%Fuel oil, kerosene, etc.
3.2%Bottled, tank, or LP gas
Population in 1990: 7,981. Population change in the 1990s: +520 (+6.5%).
Place of birth for U.S.-born residents:
This state: 5,747
Northeast: 219
Midwest: 194
South: 113
West: 84
72% of the 11023 zip code residents lived in the same house 5 years ago. Out of people who lived in different houses, 61% lived in this county. Out of people who lived in different counties, 50% lived in New York.
93% of the 11023 zip code residents lived in the same house 1 year ago. Out of people who lived in different houses, 58% moved from this county. Out of people who lived in different houses, 26% moved from different county within same state. Out of people who lived in different houses, 9% moved from different state. Out of people who lived in different houses, 5% moved from abroad.
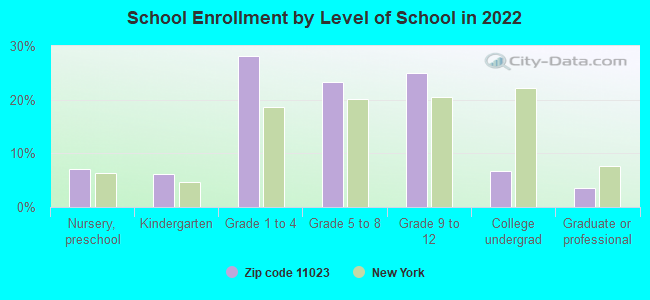
Private vs. public school enrollment:
Students in private schools in grades 1 to 8 (elementary and middle school): 626
Here:
44.6%
New York:
15.6%
Students in private schools in grades 9 to 12 (high school): 198
Here:
29.5%
New York:
15.0%
Students in private undergraduate colleges: 75
Here:
41.6%
New York:
39.2%
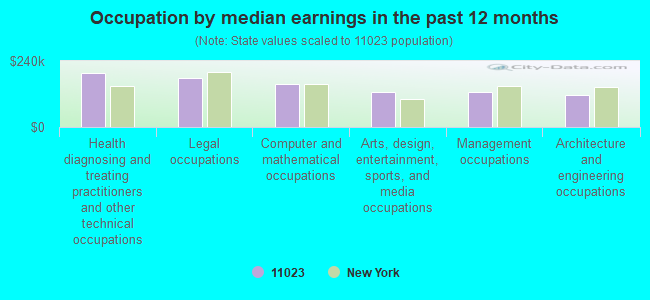
Occupation by median earnings in the past 12 months ($)
196,694Health diagnosing and treating practitioners and other technical occupations
177,671Legal occupations
156,946Computer and mathematical occupations
127,960Arts, design, entertainment, sports, and media occupations
126,404Management occupations
116,537Architecture and engineering occupations
Companies with federal contracts located in this zip code:
IMREX MICROELECTRONICS, LLC (307 EAST SHORE ROAD in GREAT NECK, NY) : $84,059 in 2 contractsfrom 2000 to 2001
$55,000 with Defense Logistics Agency for Microcircuits, Electronic. Signed on 2000-05-04. Completion date: 2001-05-04.
$29,059, same as above.Signed on 2001-06-01. Completion date: 2002-02-26.
H S ASSOCIATES CORP. (20 HAWTHORNE LN in GREAT NECK, NY; small business)
$33,646 with Defense Logistics Agency for Headsets, Handsets, Microphones and Speakers. Signed on 2001-10-19. Completion date: 2002-04-17.
Top industries in this zip code by the number of employees in 2005:
Health Care and Social Assistance: Offices of Physicians (except Mental Health Specialists) (20-49 employees: 6 establishments, 10-19 employees: 3 establishments, 5-9 employees: 6 establishments, 1-4 employees: 15 establishments)
Other Services (except Public Administration): Religious Organizations (100-249: 1, 50-99: 1, 10-19: 1, 1-4: 3)
Educational Services: Elementary and Secondary Schools (100-249: 1, 20-49: 1)
Health Care and Social Assistance: Offices of Dentists (20-49: 1, 10-19: 1, 5-9: 1, 1-4: 6)
Finance and Insurance: Commercial Banking (10-19: 3, 5-9: 2)


 Nearest zip codes: 11021, 11024, 11363, 11020, 11362, 11359.