Estimated zip code population in 2022: 12,202 Zip code population in 2010: 12,337 Zip code population in 2000: 12,176
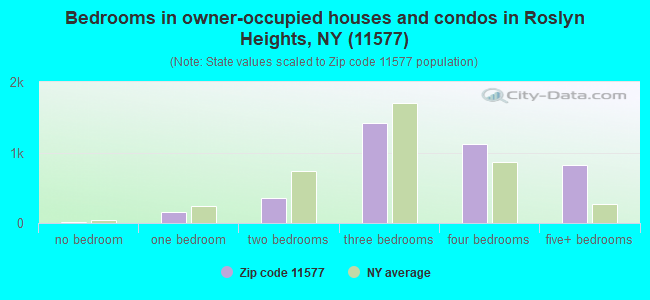
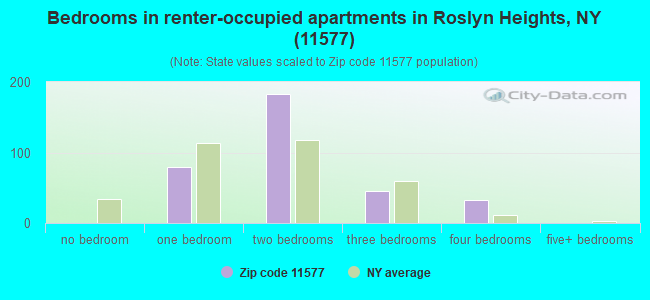
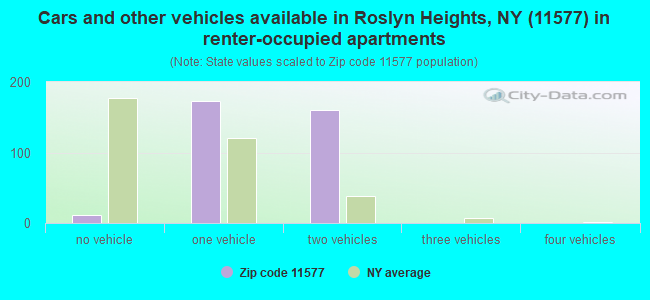
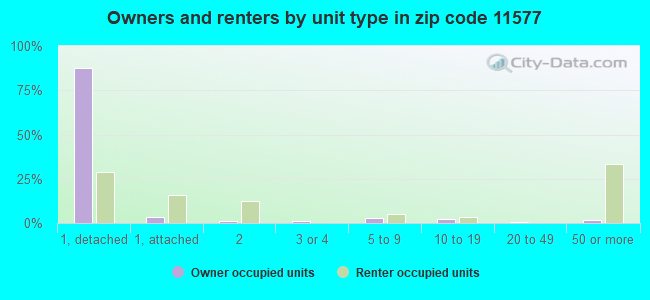
Houses and condos: 4,430 Renter-occupied apartments: 346
% of renters here:
8%
State:
46%
March 2022 cost of living index in zip code 11577: 149.4 (very high, U.S. average is 100)
Land area: 3.0 sq. mi. Water area: 0.0 sq. mi.
Population density: 4,003 people per square mile
(average).
OSM Map
General Map
Google Map
MSN Map
OSM Map
General Map
Google Map
MSN Map
OSM Map
General Map
Google Map
MSN Map
OSM Map
General Map
Google Map
MSN Map
Please wait while loading the map...
Real estate property taxes paid for housing units in 2022:
This zip code:
1.0% ($9,805)
New York:
1.5% ($6,180)
Median real estate property taxes paid for housing units with mortgages in 2022: $9,858 (1.0%) Median real estate property taxes paid for housing units with no mortgage in 2022: $9,755 (1.1%)
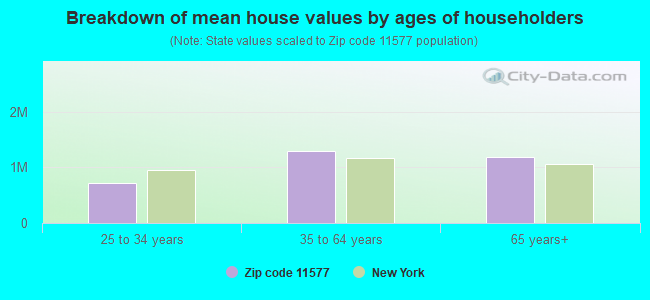
Estimated median house/condo value in 2022: $973,219
11577:
$973,219
New York:
$400,400
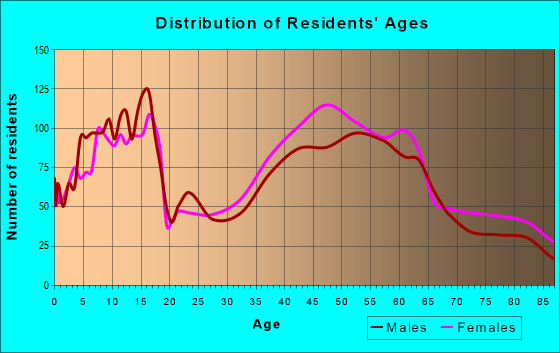
Median resident age:
This zip code:
44.7 years
New York median age:
40.0 years
Average household size:
This zip code:
2.8 people
New York:
2.5 people
Averages for the 2020 tax year for zip code 11577, filed in 2021:
Average Adjusted Gross Income (AGI) in 2020: $193,262 (Individual Income Tax Returns)
Here:
$193,262
State:
$90,930
Salary/wage: $136,723 (reported on 77.5% of returns)
Here:
$136,723
State:
$72,104
(% of AGI for various income ranges: 1322.6% for AGIs below $25k, 4120.0% for AGIs $25k-50k, 7601.5% for AGIs $50k-75k, 10843.9% for AGIs $75k-100k, 21790.8% for AGIs $100k-200k, 118090.0% for AGIs over 200k)
Taxable interest for individuals: $4,506 (reported on 58.9% of returns)
This zip code:
$4,506
New York:
$3,075
(% of AGI for various income ranges: 40.4% for AGIs below $25k, 116.6% for AGIs $25k-50k, 168.0% for AGIs $50k-75k, 257.9% for AGIs $75k-100k, 511.5% for AGIs $100k-200k, 3004.2% for AGIs over 200k)
Ordinary dividends: $11,864 (reported on 48.0% of returns)
Here:
$11,864
State:
$11,095
(% of AGI for various income ranges: 110.4% for AGIs below $25k, 132.2% for AGIs $25k-50k, 316.8% for AGIs $50k-75k, 494.6% for AGIs $75k-100k, 1166.0% for AGIs $100k-200k, 6568.2% for AGIs over 200k)
Net capital gain/loss in AGI: +$59,941 (reported on 46.4% of returns)
Here:
+$59,941
State:
+$44,925
(% of AGI for various income ranges: 70.7% for AGIs below $25k, 123.6% for AGIs $25k-50k, 255.3% for AGIs $50k-75k, 413.6% for AGIs $75k-100k, 1564.6% for AGIs $100k-200k, 41639.7% for AGIs over 200k)
Profit/loss from business: +$48,161 (reported on 22.0% of returns)
Here:
+$48,161
State:
+$14,940
(% of AGI for various income ranges: 245.6% for AGIs below $25k, 370.6% for AGIs $25k-50k, 743.5% for AGIs $50k-75k, 540.7% for AGIs $75k-100k, 1857.7% for AGIs $100k-200k, 12515.5% for AGIs over 200k)
Taxable individual retirement arrangement distribution: $27,263 (reported on 10.2% of returns)
11577:
$27,263
New York:
$19,609
(% of AGI for various income ranges: 34.4% for AGIs below $25k, 97.8% for AGIs $25k-50k, 225.7% for AGIs $50k-75k, 382.1% for AGIs $75k-100k, 1048.3% for AGIs $100k-200k, 2412.6% for AGIs over 200k)
Self-employed (Keogh) retirement plans: $38,087 (reported on 3.8% of returns)
11577:
$38,087
New York:
$32,497
(% of AGI for various income ranges: 52.0% for AGIs $25k-50k, 164.6% for AGIs $100k-200k, 2028.9% for AGIs over 200k)
Total itemized deductions: $38,297 (reported on 28.6% of returns)
Here:
$38,297
State:
$39,326
(% of AGI for various income ranges: 225.6% for AGIs below $25k, 547.4% for AGIs $25k-50k, 1012.0% for AGIs $50k-75k, 1305.4% for AGIs $75k-100k, 2953.8% for AGIs $100k-200k, 10642.1% for AGIs over 200k)
Charity contributions: $9,117 (reported on 25.0% of returns)
Here:
$9,117
State:
$15,420
(% of AGI for various income ranges: 11.6% for AGIs below $25k, 40.6% for AGIs $25k-50k, 100.5% for AGIs $50k-75k, 139.3% for AGIs $75k-100k, 424.4% for AGIs $100k-200k, 2827.6% for AGIs over 200k)
Taxes paid: $9,606 (reported on 28.6% of returns)
11577:
$9,606
State:
$9,183
(% of AGI for various income ranges: 72.7% for AGIs below $25k, 171.2% for AGIs $25k-50k, 311.8% for AGIs $50k-75k, 391.1% for AGIs $75k-100k, 884.8% for AGIs $100k-200k, 2305.5% for AGIs over 200k)
Earned income credit: $2,005 (reported on 6.4% of returns)
Here:
$2,005
State:
$2,138
(% of AGI for various income ranges: 66.1% for AGIs below $25k, 63.8% for AGIs $25k-50k)
Percentage of individuals using paid preparers for their 2020 taxes: 95.1%
Here:
95%
State:
95%
(% for various income ranges: 94.3% for AGIs below $25k, 93.7% for AGIs $25k-50k, 95.7% for AGIs $50k-75k, 94.1% for AGIs $75k-100k, 94.9% for AGIs $100k-200k, 96.7% for AGIs over 200k)
Averages for the 2012 tax year for zip code 11577, filed in 2013:
Average Adjusted Gross Income (AGI) in 2012: $161,023 (Individual Income Tax Returns)
Here:
$161,023
State:
$77,088
Salary/wage: $114,237 (reported on 78.2% of returns)
Here:
$114,237
State:
$60,593
(% of AGI for various income ranges: 65.6% for AGIs below $25k, 74.7% for AGIs $25k-50k, 71.0% for AGIs $50k-75k, 65.4% for AGIs $75k-100k, 64.4% for AGIs $100k-200k, 50.6% for AGIs over 200k)
Taxable interest for individuals: $4,833 (reported on 63.9% of returns)
This zip code:
$4,833
New York:
$3,125
(% of AGI for various income ranges: 4.5% for AGIs below $25k, 2.1% for AGIs $25k-50k, 1.8% for AGIs $50k-75k, 2.8% for AGIs $75k-100k, 2.0% for AGIs $100k-200k, 1.8% for AGIs over 200k)
Ordinary dividends: $9,484 (reported on 48.6% of returns)
Here:
$9,484
State:
$10,299
(% of AGI for various income ranges: 6.6% for AGIs below $25k, 2.8% for AGIs $25k-50k, 3.5% for AGIs $50k-75k, 3.4% for AGIs $75k-100k, 3.4% for AGIs $100k-200k, 2.6% for AGIs over 200k)
Net capital gain/loss in AGI: +$33,738 (reported on 45.3% of returns)
Here:
+$33,738
State:
+$42,474
(% of AGI for various income ranges: 0.6% for AGIs below $25k, 0.2% for AGIs $25k-50k, 0.8% for AGIs $75k-100k, 1.7% for AGIs $100k-200k, 13.2% for AGIs over 200k)
Profit/loss from business: +$45,978 (reported on 21.5% of returns)
Here:
+$45,978
State:
+$16,168
(% of AGI for various income ranges: 11.6% for AGIs below $25k, 7.9% for AGIs $25k-50k, 8.4% for AGIs $50k-75k, 4.7% for AGIs $75k-100k, 6.0% for AGIs $100k-200k, 5.9% for AGIs over 200k)
Taxable individual retirement arrangement distribution: $26,605 (reported on 14.0% of returns)
11577:
$26,605
New York:
$17,621
(% of AGI for various income ranges: 3.6% for AGIs below $25k, 2.5% for AGIs $25k-50k, 3.6% for AGIs $50k-75k, 4.6% for AGIs $75k-100k, 4.6% for AGIs $100k-200k, 1.5% for AGIs over 200k)
Self-employment retirement plans: $29,441 (reported on 3.7% of returns)
11577:
$29,441
New York:
$27,330
(% of AGI for various income ranges: 1.3% for AGIs $25k-50k, 0.7% for AGIs $100k-200k, 0.8% for AGIs over 200k)
Total itemized deductions: $50,970 (21% of AGI, reported on 61.8% of returns)
Here:
$50,970
State:
$34,985
Here:
20.9% of AGI
State:
21.3% of AGI
(% of AGI for various income ranges: 34.3% for AGIs below $25k, 24.3% for AGIs $25k-50k, 26.2% for AGIs $50k-75k, 25.7% for AGIs $75k-100k, 25.7% for AGIs $100k-200k, 16.7% for AGIs over 200k)
Charity contributions: $5,305 (reported on 55.0% of returns)
Here:
$5,305
State:
$5,572
(% of AGI for various income ranges: 1.1% for AGIs below $25k, 1.5% for AGIs $25k-50k, 1.8% for AGIs $50k-75k, 1.9% for AGIs $75k-100k, 2.1% for AGIs $100k-200k, 1.8% for AGIs over 200k)
Taxes paid: $30,636 (reported on 61.7% of returns)
11577:
$30,636
State:
$18,656
(% of AGI for various income ranges: 13.4% for AGIs below $25k, 11.0% for AGIs $25k-50k, 13.5% for AGIs $50k-75k, 12.9% for AGIs $75k-100k, 13.8% for AGIs $100k-200k, 11.0% for AGIs over 200k)
Earned income credit: $1,950 (reported on 6.5% of returns)
Here:
$1,950
State:
$2,230
(% of AGI for various income ranges: 3.2% for AGIs below $25k, 0.8% for AGIs $25k-50k)
Percentage of individuals using paid preparers for their 2012 taxes: 80.7%
Here:
81%
State:
66%
(% for various income ranges: 76.9% for AGIs below $25k, 72.7% for AGIs $25k-50k, 82.5% for AGIs $50k-75k, 81.8% for AGIs $75k-100k, 84.1% for AGIs $100k-200k, 86.6% for AGIs over 200k)
Averages for the 2004 tax year for zip code 11577, filed in 2005:
Average Adjusted Gross Income (AGI) in 2004: $123,957 (Individual Income Tax Returns)
Here:
$123,957
State:
$59,519
Salary/wage: $93,015 (reported on 73.4% of returns)
Here:
$93,015
State:
$50,673
(% of AGI for various income ranges: 63.2% for AGIs $10k-25k, 72.3% for AGIs $25k-50k, 63.3% for AGIs $50k-75k, 65.7% for AGIs $75k-100k, 50.9% for AGIs over 100k)
Taxable interest for individuals: $4,399 (reported on 77.2% of returns)
This zip code:
$4,399
New York:
$2,377
(% of AGI for various income ranges: 7.3% for AGIs $10k-25k, 3.9% for AGIs $25k-50k, 3.7% for AGIs $50k-75k, 2.4% for AGIs $75k-100k, 2.3% for AGIs over 100k)
Taxable dividends: $6,232 (reported on 58.6% of returns)
Here:
$6,232
State:
$5,394
(% of AGI for various income ranges: 6.0% for AGIs $10k-25k, 3.0% for AGIs $25k-50k, 4.0% for AGIs $50k-75k, 2.8% for AGIs $75k-100k, 2.6% for AGIs over 100k)
Net capital gain/loss: +$19,624 (reported on 53.4% of returns)
Here:
+$19,624
State:
+$23,581
(% of AGI for various income ranges: 1.6% for AGIs $10k-25k, -0.2% for AGIs $25k-50k, 0.4% for AGIs $50k-75k, 1.1% for AGIs $75k-100k, 9.9% for AGIs over 100k)
Profit/loss from business: +$43,811 (reported on 20.9% of returns)
Here:
+$43,811
State:
+$13,809
(% of AGI for various income ranges: 12.0% for AGIs $10k-25k, 7.3% for AGIs $25k-50k, 8.6% for AGIs $50k-75k, 6.7% for AGIs $75k-100k, 7.0% for AGIs over 100k)
IRA payment deduction: $4,202 (reported on 4.6% of returns)
11577:
$4,202
New York:
$3,115
(% of AGI for various income ranges: 0.4% for AGIs $10k-25k, 0.5% for AGIs $25k-50k, 0.4% for AGIs $50k-75k, 0.3% for AGIs $75k-100k, 0.1% for AGIs over 100k)
Self-employed pension: $23,875 (reported on 4.9% of returns)
Here:
$23,875
New York:
$19,016
(% of AGI for various income ranges: 0.7% for AGIs $50k-75k, 0.5% for AGIs $75k-100k, 1.0% for AGIs over 100k)
Total itemized deductions: $38,015 (19% of AGI, reported on 61.4% of returns)
Here:
$38,015
State:
$25,864
Here:
19.5% of AGI
State:
21.9% of AGI
(% of AGI for various income ranges: 32.6% for AGIs $10k-25k, 27.9% for AGIs $25k-50k, 29.4% for AGIs $50k-75k, 29.5% for AGIs $75k-100k, 16.1% for AGIs over 100k)
Charity contributions deductions: $4,856 (2% of AGI, reported on 56.5% of returns)
Here:
$4,856
State:
$4,439
Here:
2.4% of AGI
State:
3.6% of AGI
(% of AGI for various income ranges: 2.1% for AGIs $10k-25k, 2.0% for AGIs $25k-50k, 2.8% for AGIs $50k-75k, 2.9% for AGIs $75k-100k, 2.1% for AGIs over 100k)
Total tax: $30,910 (reported on 79.4% of returns)
11577:
$30,910
State:
$11,730
(% of AGI for various income ranges: 4.6% for AGIs $10k-25k, 7.1% for AGIs $25k-50k, 9.5% for AGIs $50k-75k, 10.4% for AGIs $75k-100k, 21.7% for AGIs over 100k)
Earned income credit: $1,429 (reported on 5.6% of returns)
Here:
$1,429
State:
$1,757
Percentage of individuals using paid preparers for their 2004 taxes: 80.6%
Here:
81%
State:
67%
(% for various income ranges: 79.4% for AGIs below $10k, 76.6% for AGIs $10k-25k, 76.8% for AGIs $25k-50k, 80.5% for AGIs $50k-75k, 81.0% for AGIs $75k-100k, 84.5% for AGIs over 100k)
Likely homosexual households (counted as self-reported same-sex unmarried-partner households)
Lesbian couples: 0.4% of all households
Gay men: 0.0% of all households
Household received Food Stamps/SNAP in the past 12 months: 99 Household did not receive Food Stamps/SNAP in the past 12 months: 4,100
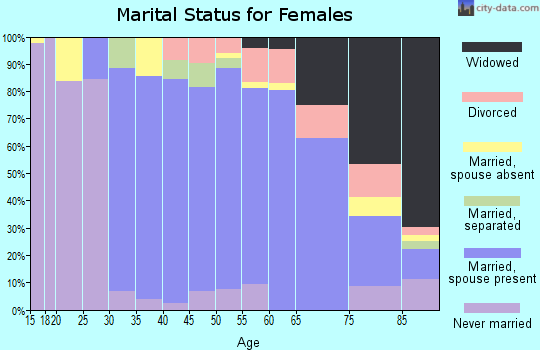
Women who had a birth in the past 12 months: 146 (144 now married, 0 unmarried) Women who did not have a birth in the past 12 months: 2,476 (1,286 now married, 1,171 unmarried)
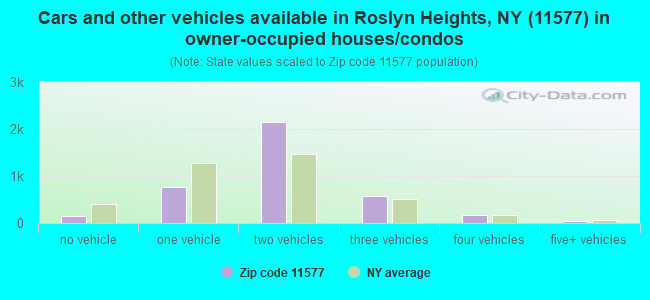
Housing units in zip code 11577 with a mortgage: 2,356 (407 second mortgage, 378 both second mortgage and home equity loan) Houses without a mortgage: 98
Median monthly owner costs for units with a mortgage: $3,860 Median monthly owner costs for units without a mortgage: $1,487
Residents with income below the poverty level in 2022:
This zip code:
3.5%
Whole state:
14.3%
Residents with income below 50% of the poverty level in 2022:
This zip code:
1.7%
Whole state:
6.8%
Median number of rooms in houses and condos:
Here:
7.2
State:
6.3
Median number of rooms in apartments:
Here:
4.8
State:
3.8
Notable locations in this zip code not listed on our city pages
Notable locations in zip code 11577: Renaissance Country Club (A), Morley Park Golf Course (B), Roslyn Country Club (C), Roslyn Station (D), Roslyn Volunteer Rescue Hook and Ladder Station 2 (E), Roslyn Highlands Hook Ladder Engine and Hose Company (F), Sunharbor Manor Nursing Home (G). Display/hide their locations on the map
Churches in zip code 11577 include: New Church of New York (A), Roslyn Synagogue Orthodox (B), Salem African Methodist Episcopal Church (C), Friendship Baptist Church (D), Assembly of Prayer Baptist Church (E), Temple Sinai of Rosyln (F), Roslyn Heights Methodist Church (G). Display/hide their locations on the map
In group quarters: 251 (-1 institutionalized population)
Size of family households: 1,170 2-persons, 708 3-persons, 877 4-persons, 442 5-persons, 52 6-persons, 62 7-or-more-persons
Size of nonfamily households: 685 1-person, 220 2-persons
2,520 married couples with children.
168 single-parent households (48 men, 120 women).
67.9% of residents of 11577 zip code speak English at home.
5.4% of residents speak Spanish at home (87% very well, 13% well).
11.8% of residents speak other Indo-European language at home (89% very well, 6% well, 4% not well, 1% not at all).
13.2% of residents speak Asian or Pacific Island language at home (50% very well, 30% well, 15% not well, 6% not at all).
1.9% of residents speak other language at home (82% very well, 18% well).
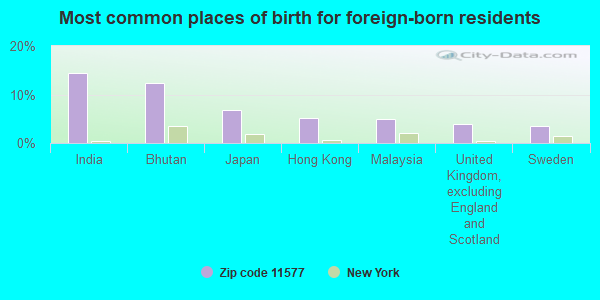
Foreign born population: 2,731 (22.4%) (85.7% of them are naturalized citizens)
This zip code:
22.4%
Whole state:
22.7%
14%India
12%Bhutan
7%Japan
5%Hong Kong
5%Malaysia
4%United Kingdom, excluding England and Scotland
4%Sweden
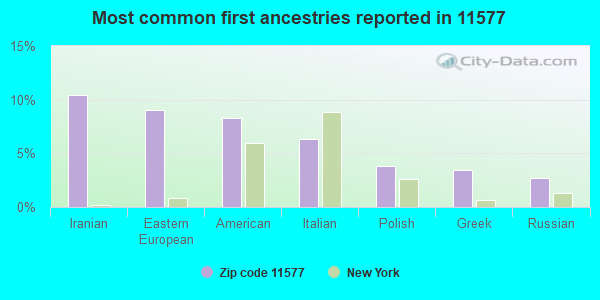
10%Iranian
9%Eastern European
8%American
6%Italian
4%Polish
3%Greek
3%Russian
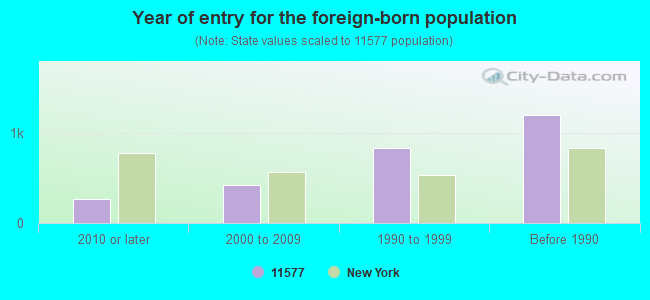
Year of entry for the foreign-born population
2682010 or later
4232000 to 2009
8291990 to 1999
1,200Before 1990
Facilities with environmental interests located in this zip code:
GILRON CLEANERS (199 MINEOLA AVENUE in ROSLYN HEIGHTS, NY)
AIR MINOR (AIRS/AFS) STATE MASTER (New York facility tracking) - AIR PROGRAM, HAZARDOUS WASTE PROGRAM Conditionally Exempt Small Quantity Generators, less than 100 kg/month of hazardous waste (Resource Conservation and Recovery Act (tracking hazardous waste)) - notification Business SIC classification: DRYCLEANING PLANTS, EXCEPT RUG CLEANING Business NAICS classification: DRYCLEANING AND LAUNDRY SERVICES (EXCEPT COIN-OPERATED). Organizations: EUN CHA (CONTACT/OWNER)
, YOUNG KYU CHUN (LEGALLY RESPONSIBLE PARTY)
, ENC DRY CLEANERS INC (LEGALLY RESPONSIBLE PARTY)
Alternative names: GILRON CLEANERS DBA ENC CLNRS, Y K CLEANERS
HARBOUR HILL CLEANERS (26 LINCOLN AVENUE in ROSLYN HEIGHTS, NY)
AIR MINOR (AIRS/AFS) STATE MASTER (New York facility tracking) - AIR PROGRAM, HAZARDOUS WASTE PROGRAM Small Quantity Generators, between 100 kg and 1000 kg of hazardous waste/month (Resource Conservation and Recovery Act (tracking hazardous waste)) Business SIC classification: DRYCLEANING PLANTS, EXCEPT RUG CLEANING; TRUCK RENTAL AND LEASING, WITHOUT DRIVERS Organizations: JEE & JUNG CLEANERS CORP (LEGALLY RESPONSIBLE PARTY)
Alternative names: JEE & JUNG CORP DBA HARBOR HILLS CLNRS
HOMELESS HOUSING (201 ROSLYN RD in ROSLYN HEIGHTS, NY)
(Resource Conservation and Recovery Act (tracking hazardous waste))
IMPRESSIONS AB (200 POWERHOUSE RD in ROSLYN HEIGHTS, NY)
(Resource Conservation and Recovery Act (tracking hazardous waste))
HASSET LTD (130 GLEN COVE RD in EAST HILLS, NY)
Conditionally Exempt Small Quantity Generators, less than 100 kg/month of hazardous waste (Resource Conservation and Recovery Act (tracking hazardous waste)) - notification Organizations: STEFRO SMOCO (CONTACT/OWNER)
Housing units lacking complete plumbing facilities: 1.1% Housing units lacking complete kitchen facilities: 1.1%
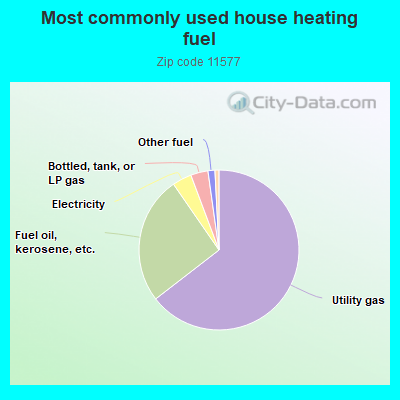
64.4%Utility gas
25.8%Fuel oil, kerosene, etc.
3.9%Electricity
3.5%Bottled, tank, or LP gas
1.4%Other fuel
0.8%Solar energy
Population in 1990: 10,665. Population change in the 1990s: +1,511 (+14.2%).
Place of birth for U.S.-born residents:
This state: 8,866
Northeast: 143
Midwest: 208
South: 112
West: 27
71% of the 11577 zip code residents lived in the same house 5 years ago. Out of people who lived in different houses, 52% lived in this county. Out of people who lived in different counties, 50% lived in New York.
93% of the 11577 zip code residents lived in the same house 1 year ago. Out of people who lived in different houses, 37% moved from this county. Out of people who lived in different houses, 44% moved from different county within same state. Out of people who lived in different houses, 18% moved from different state. Out of people who lived in different houses, 2% moved from abroad.
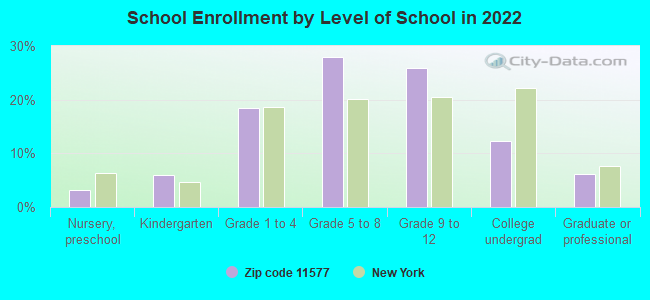
Private vs. public school enrollment:
Students in private schools in grades 1 to 8 (elementary and middle school): 86
Here:
5.5%
New York:
15.6%
Students in private schools in grades 9 to 12 (high school): 137
Here:
15.6%
New York:
15.0%
Students in private undergraduate colleges: 203
Here:
48.1%
New York:
39.2%
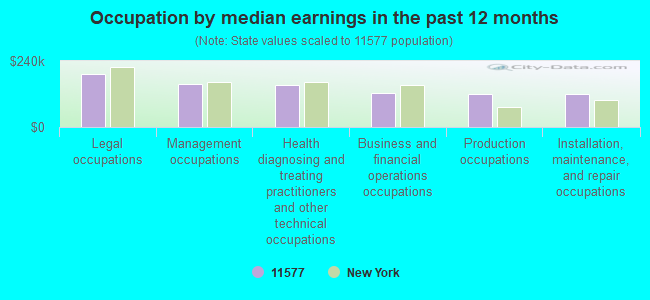
Occupation by median earnings in the past 12 months ($)
194,463Legal occupations
157,353Management occupations
151,161Health diagnosing and treating practitioners and other technical occupations
123,313Business and financial operations occupations
121,443Production occupations
120,018Installation, maintenance, and repair occupations
Companies with federal contracts located in this zip code (ROSLYN HEIGHTS, NY):
MIL-SPEC INDUSTRIES CORP (10 MINEOLA AVENUE; small business) : $2,414,831 in 29 contractsfrom 2000 to 2006
Contracts for Military Chemical Agents, Chemicals, Dyes, Hazardous Material Spill Containment and Clean-up Equipment and Material, and moreby Army, Defense Logistics Agency, Navy, Air Force, and others Signed by year:2000: $779,542; 2001: $44,250; 2002: $879,215; 2003: $113,428; 2004: $571,837; 2005: $12,749; 2006: $13,810.
Biggest contracts:
$473,400 with Army for Military Chemical Agents. Taking place in MO. Signed on 2002-06-26. Completion date: 2003-02-01.
$408,600 with Army for Military Chemical Agents. Signed on 2000-05-10. Completion date: 2000-08-10.
$336,600, same as above.Signed on 2004-09-16. Completion date: 2004-12-15.
$201,342 with Army for Chemicals. Signed on 2000-05-09. Completion date: 2000-07-08.
TRISTATE AVIATION INC (1 EXPRESSWAY PLAZA, SUITE; small business) : $1,435,886 in 23 contractsfrom 2002 to 2005
Contracts for Architect - Engineer Services (including landscaping, interior layout, and designing), Maintenance, Repair or Alteration of Real Property -- Other Airfield Structures, Administrative and Service Buildings by Army, Air Force Signed by year:2000: $0; 2001: $0; 2002: $178,275; 2003: $1,120,259; 2004: $164,082; 2005: -$26,730; 2006: $0.
Biggest contracts:
$287,611 with Army for Architect - Engineer Services (including landscaping, interior layout, and designing). Signed on 2003-09-18. Completion date: 2004-03-18.
$236,000, same as above.Signed on 2003-03-31. Completion date: 2004-03-31.
$131,031 with Air Force for Maintenance, Repair or Alteration of Real Property -- Other Airfield Structures. Taking place in MA. Signed on 2003-07-23. Completion date: 2004-01-30.
$95,441 with Army for Architect - Engineer Services (including landscaping, interior layout, and designing). Signed on 2003-09-22. Completion date: 2004-09-22.
SOLBRY COMPUTER CO INC (BOX 22; small business)
$40,480 with Defense Logistics Agency for Electrical and Electronic assemblies, Boards, Cards, and Associated Hardware. Taking place in CA. Signed on 2001-08-21. Completion date: 2001-11-13.
ALLAN RICH LOCK AND ALARM CO (43 SHERRARD STREET; small business)
$2,934 with U.S. Army Corps of Engineers - civil program financing only for Miscellaneous Alarm, Signal and Security Detection Systems. Signed on 2002-07-24. Completion date: 2002-08-23.
Top industries in this zip code by the number of employees in 2005:
Other Services (except Public Administration): All Other Personal Services (250-499 employees: 1 establishment, 20-49 employees: 1 establishment, 1-4 employees: 1 establishment)
Health Care and Social Assistance: Nursing Care Facilities (250-499: 1)
Health Care and Social Assistance: Offices of Physicians (except Mental Health Specialists) (100-249: 1, 20-49: 1, 10-19: 3, 5-9: 6, 1-4: 25)
2002 - 2018 National Fire Incident Reporting System (NFIRS) incidents
Based on the data from the years 2002 - 2018 the average number of fire incidents per year is 18. The highest number of fire incidents - 99 took place in 2013, and the least - 0 in 2010. The data has a growing trend.
When looking into fire subcategories, the most incidents belonged to: Other (53.7%), and Structure Fires (25.9%).
Fire incident types reported to NFIRS in Zip Code 11577
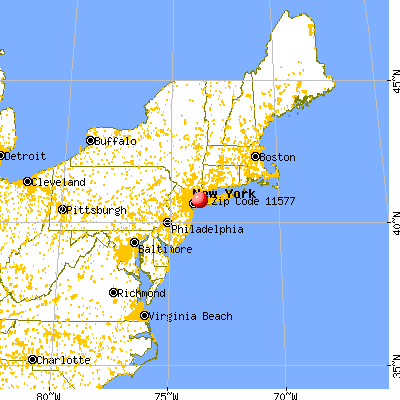


 Nearest zip codes: 11507, 11576, 11596, 11548, 11501, 11568.


 Based on the data from the years 2002 - 2018 the average number of fire incidents per year is 18. The highest number of fire incidents - 99 took place in 2013, and the least - 0 in 2010. The data has a growing trend.
 When looking into fire subcategories, the most incidents belonged to: Other (53.7%), and Structure Fires (25.9%).