Estimated zip code population in 2022: 7,596 Zip code population in 2010: 8,509 Zip code population in 2000: 8,207
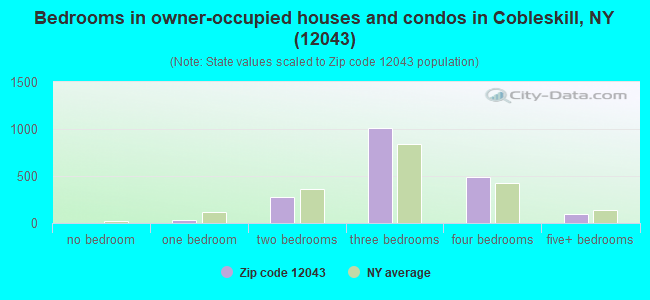
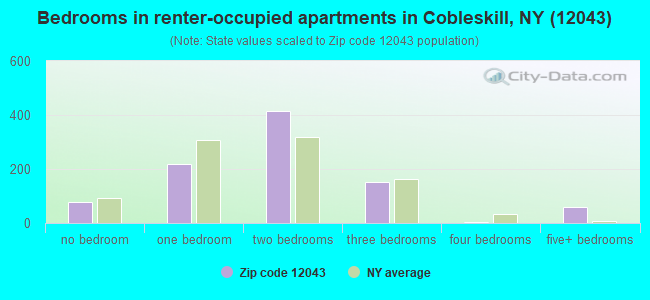
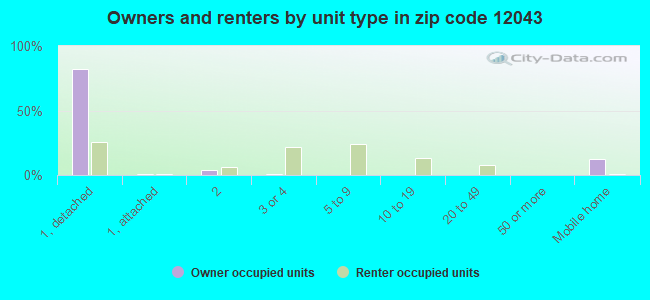
Houses and condos: 3,257 Renter-occupied apartments: 936
% of renters here:
33%
State:
46%
March 2022 cost of living index in zip code 12043: 104.0 (near average, U.S. average is 100)
Land area: 61.8 sq. mi. Water area: 0.3 sq. mi.
Population density: 123 people per square mile
(very low).
OSM Map
General Map
Google Map
MSN Map
OSM Map
General Map
Google Map
MSN Map
OSM Map
General Map
Google Map
MSN Map
OSM Map
General Map
Google Map
MSN Map
Please wait while loading the map...
Real estate property taxes paid for housing units in 2022:
This zip code:
2.5% ($4,225)
New York:
1.5% ($6,180)
Median real estate property taxes paid for housing units with mortgages in 2022: $4,474 (2.5%) Median real estate property taxes paid for housing units with no mortgage in 2022: $3,777 (2.4%)
Business Search- 14 Million verified businesses
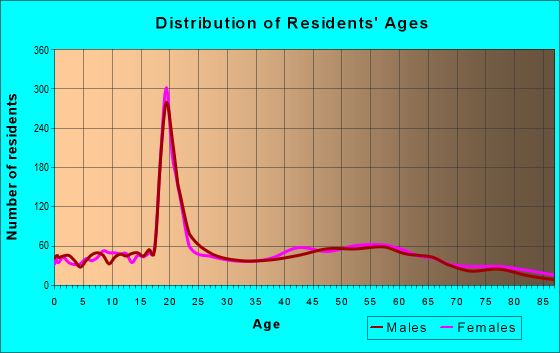
Males: 3,613
(47.6%)
Females: 3,982
(52.4%)
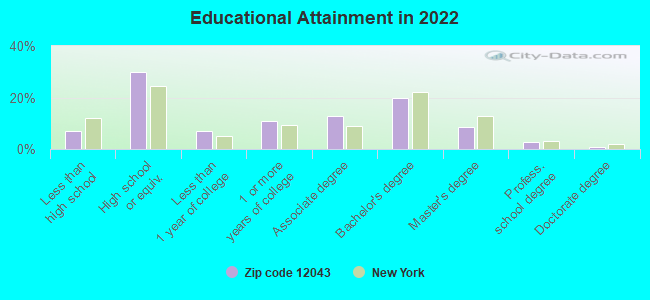
For population 25 years and over in 12043:
High school or higher: 92.6%
Bachelor's degree or higher: 32.1%
Graduate or professional degree: 12.5%
Unemployed: 5.0%
Mean travel time to work (commute): 28.3 minutes
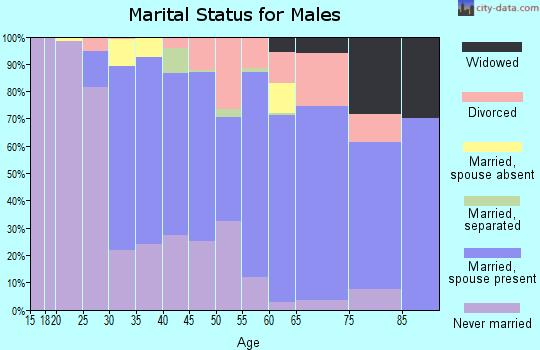
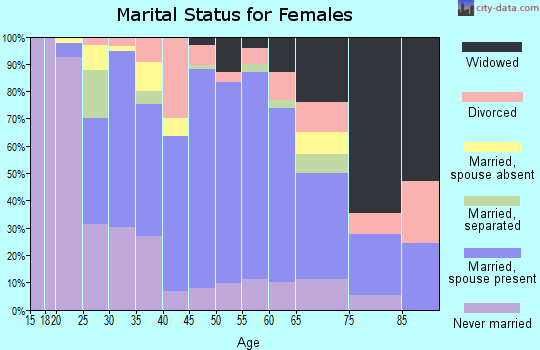
For population 15 years and over in 12043:
Never married: 38.1%
Now married: 47.2%
Separated: 0.9%
Widowed: 5.1%
Divorced: 8.7%
Zip code 12043 compared to state average:
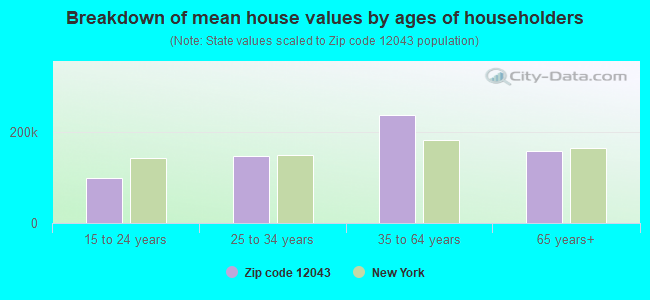
Median house value significantly below state average.
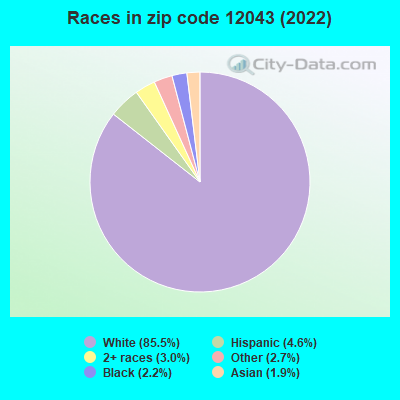
Black race population percentage significantly below state average.
Hispanic race population percentage significantly below state average.
Foreign-born population percentage significantly below state average.
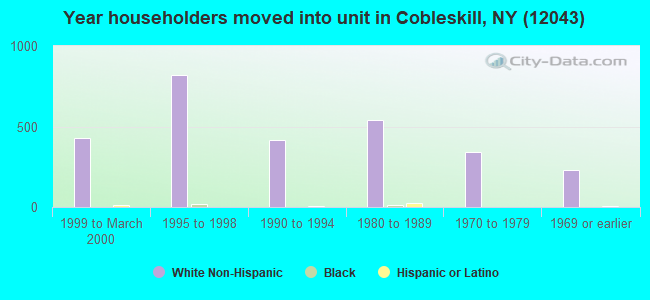
Length of stay since moving in above state average.
Averages for the 2020 tax year for zip code 12043, filed in 2021:
Average Adjusted Gross Income (AGI) in 2020: $57,415 (Individual Income Tax Returns)
Here:
$57,415
State:
$90,930
Salary/wage: $49,146 (reported on 79.0% of returns)
Here:
$49,146
State:
$72,104
(% of AGI for various income ranges: 1068.0% for AGIs below $25k, 3428.4% for AGIs $25k-50k, 6139.5% for AGIs $50k-75k, 8869.5% for AGIs $75k-100k, 15263.9% for AGIs $100k-200k)
Taxable interest for individuals: $766 (reported on 33.5% of returns)
This zip code:
$766
New York:
$3,075
(% of AGI for various income ranges: 14.6% for AGIs below $25k, 15.3% for AGIs $25k-50k, 25.4% for AGIs $50k-75k, 37.4% for AGIs $75k-100k, 80.0% for AGIs $100k-200k)
Ordinary dividends: $3,155 (reported on 19.8% of returns)
Here:
$3,155
State:
$11,095
(% of AGI for various income ranges: 37.4% for AGIs below $25k, 25.3% for AGIs $25k-50k, 57.0% for AGIs $50k-75k, 55.8% for AGIs $75k-100k, 262.1% for AGIs $100k-200k)
Net capital gain/loss in AGI: +$8,800 (reported on 18.3% of returns)
Here:
+$8,800
State:
+$44,925
(% of AGI for various income ranges: 34.1% for AGIs below $25k, 31.8% for AGIs $25k-50k, 172.7% for AGIs $50k-75k, 208.4% for AGIs $75k-100k, 406.4% for AGIs $100k-200k)
Profit/loss from business: +$11,629 (reported on 12.5% of returns)
Here:
+$11,629
State:
+$14,940
(% of AGI for various income ranges: 80.3% for AGIs below $25k, 106.8% for AGIs $25k-50k, 180.0% for AGIs $50k-75k, 223.2% for AGIs $75k-100k, 570.0% for AGIs $100k-200k)
Taxable individual retirement arrangement distribution: $14,525 (reported on 11.0% of returns)
12043:
$14,525
New York:
$19,609
(% of AGI for various income ranges: 77.7% for AGIs below $25k, 72.9% for AGIs $25k-50k, 203.5% for AGIs $50k-75k, 497.4% for AGIs $75k-100k, 633.9% for AGIs $100k-200k)
Total itemized deductions: $23,783 (reported on 3.7% of returns)
Here:
$23,783
State:
$39,326
(% of AGI for various income ranges: 439.5% for AGIs $50k-75k, 438.6% for AGIs $100k-200k)
Charity contributions: $6,825 (reported on 2.4% of returns)
Here:
$6,825
State:
$15,420
(% of AGI for various income ranges: 51.9% for AGIs $50k-75k, 126.4% for AGIs $100k-200k)
Taxes paid: $7,783 (reported on 3.7% of returns)
12043:
$7,783
State:
$9,183
(% of AGI for various income ranges: 137.6% for AGIs $50k-75k, 151.8% for AGIs $100k-200k)
Earned income credit: $2,171 (reported on 13.7% of returns)
Here:
$2,171
State:
$2,138
(% of AGI for various income ranges: 70.3% for AGIs below $25k, 66.4% for AGIs $25k-50k)
Percentage of individuals using paid preparers for their 2020 taxes: 96.3%
Here:
96%
State:
95%
(% for various income ranges: 94.1% for AGIs below $25k, 97.8% for AGIs $25k-50k, 96.2% for AGIs $50k-75k, 96.4% for AGIs $75k-100k, 97.8% for AGIs $100k-200k, 100.0% for AGIs over 200k)
Averages for the 2012 tax year for zip code 12043, filed in 2013:
Average Adjusted Gross Income (AGI) in 2012: $47,935 (Individual Income Tax Returns)
Here:
$47,935
State:
$77,088
Salary/wage: $41,550 (reported on 82.7% of returns)
Here:
$41,550
State:
$60,593
(% of AGI for various income ranges: 74.5% for AGIs below $25k, 76.1% for AGIs $25k-50k, 75.4% for AGIs $50k-75k, 72.7% for AGIs $75k-100k, 74.2% for AGIs $100k-200k, 45.5% for AGIs over 200k)
Taxable interest for individuals: $814 (reported on 38.8% of returns)
This zip code:
$814
New York:
$3,125
(% of AGI for various income ranges: 1.0% for AGIs below $25k, 0.5% for AGIs $25k-50k, 0.3% for AGIs $50k-75k, 0.3% for AGIs $75k-100k, 0.9% for AGIs $100k-200k, 1.2% for AGIs over 200k)
Ordinary dividends: $2,327 (reported on 25.3% of returns)
Here:
$2,327
State:
$10,299
(% of AGI for various income ranges: 1.6% for AGIs below $25k, 1.0% for AGIs $25k-50k, 1.5% for AGIs $50k-75k, 1.2% for AGIs $75k-100k, 0.8% for AGIs $100k-200k, 1.6% for AGIs over 200k)
Net capital gain/loss in AGI: +$7,827 (reported on 16.3% of returns)
Here:
+$7,827
State:
+$42,474
(% of AGI for various income ranges: 0.7% for AGIs below $25k, 0.7% for AGIs $25k-50k, 1.0% for AGIs $50k-75k, 2.1% for AGIs $75k-100k, 1.5% for AGIs $100k-200k, 15.6% for AGIs over 200k)
Profit/loss from business: +$9,937 (reported on 13.8% of returns)
Here:
+$9,937
State:
+$16,168
(% of AGI for various income ranges: 4.5% for AGIs below $25k, 3.4% for AGIs $25k-50k, 2.1% for AGIs $50k-75k, 2.6% for AGIs $75k-100k, 3.7% for AGIs $100k-200k)
Taxable individual retirement arrangement distribution: $10,730 (reported on 10.6% of returns)
12043:
$10,730
New York:
$17,621
(% of AGI for various income ranges: 2.4% for AGIs below $25k, 1.7% for AGIs $25k-50k, 3.0% for AGIs $50k-75k, 2.7% for AGIs $75k-100k, 3.0% for AGIs $100k-200k)
Self-employment retirement plans: $12,500 (reported on 0.6% of returns)
12043:
$12,500
New York:
$27,330
Total itemized deductions: $18,752 (20% of AGI, reported on 27.2% of returns)
Here:
$18,752
State:
$34,985
Here:
20.0% of AGI
State:
21.3% of AGI
(% of AGI for various income ranges: 6.3% for AGIs below $25k, 7.3% for AGIs $25k-50k, 11.0% for AGIs $50k-75k, 11.7% for AGIs $75k-100k, 13.8% for AGIs $100k-200k, 10.4% for AGIs over 200k)
Charity contributions: $2,562 (reported on 19.6% of returns)
Here:
$2,562
State:
$5,572
(% of AGI for various income ranges: 0.4% for AGIs below $25k, 0.6% for AGIs $25k-50k, 0.8% for AGIs $50k-75k, 1.3% for AGIs $75k-100k, 1.5% for AGIs $100k-200k, 1.3% for AGIs over 200k)
Taxes paid: $9,592 (reported on 26.9% of returns)
12043:
$9,592
State:
$18,656
(% of AGI for various income ranges: 1.8% for AGIs below $25k, 3.0% for AGIs $25k-50k, 4.7% for AGIs $50k-75k, 5.3% for AGIs $75k-100k, 7.7% for AGIs $100k-200k, 8.8% for AGIs over 200k)
Earned income credit: $1,969 (reported on 17.3% of returns)
Here:
$1,969
State:
$2,230
(% of AGI for various income ranges: 5.1% for AGIs below $25k, 1.1% for AGIs $25k-50k)
Percentage of individuals using paid preparers for their 2012 taxes: 57.1%
Here:
57%
State:
66%
(% for various income ranges: 48.4% for AGIs below $25k, 58.9% for AGIs $25k-50k, 66.0% for AGIs $50k-75k, 63.3% for AGIs $75k-100k, 63.3% for AGIs $100k-200k, 100.0% for AGIs over 200k)
Averages for the 2004 tax year for zip code 12043, filed in 2005:
Average Adjusted Gross Income (AGI) in 2004: $40,154 (Individual Income Tax Returns)
Here:
$40,154
State:
$59,519
Salary/wage: $35,527 (reported on 83.2% of returns)
Here:
$35,527
State:
$50,673
(% of AGI for various income ranges: 110.1% for AGIs below $10k, 72.3% for AGIs $10k-25k, 78.8% for AGIs $25k-50k, 82.1% for AGIs $50k-75k, 81.0% for AGIs $75k-100k, 56.5% for AGIs over 100k)
Taxable interest for individuals: $1,205 (reported on 54.7% of returns)
This zip code:
$1,205
New York:
$2,377
(% of AGI for various income ranges: 7.6% for AGIs below $10k, 2.4% for AGIs $10k-25k, 1.1% for AGIs $25k-50k, 0.7% for AGIs $50k-75k, 0.7% for AGIs $75k-100k, 2.7% for AGIs over 100k)
Taxable dividends: $2,438 (reported on 30.5% of returns)
Here:
$2,438
State:
$5,394
(% of AGI for various income ranges: 5.0% for AGIs below $10k, 2.0% for AGIs $10k-25k, 1.1% for AGIs $25k-50k, 1.1% for AGIs $50k-75k, 1.5% for AGIs $75k-100k, 3.0% for AGIs over 100k)
Net capital gain/loss: +$6,504 (reported on 22.2% of returns)
Here:
+$6,504
State:
+$23,581
(% of AGI for various income ranges: -2.1% for AGIs below $10k, 1.0% for AGIs $10k-25k, 1.6% for AGIs $25k-50k, 1.6% for AGIs $50k-75k, 1.7% for AGIs $75k-100k, 9.3% for AGIs over 100k)
Profit/loss from business: +$10,698 (reported on 14.1% of returns)
Here:
+$10,698
State:
+$13,809
(% of AGI for various income ranges: 6.9% for AGIs below $10k, 4.3% for AGIs $10k-25k, 3.5% for AGIs $25k-50k, 2.4% for AGIs $50k-75k, 3.1% for AGIs $75k-100k, 5.0% for AGIs over 100k)
Profit/loss from farming: +$433 (reported on 1.9% of returns)
Here:
+$433
State:
-$2,666
IRA payment deduction: $2,841 (reported on 2.8% of returns)
12043:
$2,841
New York:
$3,115
(% of AGI for various income ranges: 0.4% for AGIs $10k-25k, 0.3% for AGIs $25k-50k, 0.2% for AGIs $50k-75k, 0.2% for AGIs $75k-100k)
Self-employed pension: $7,759 (reported on 0.9% of returns)
Here:
$7,759
New York:
$19,016
Total itemized deductions: $16,352 (20% of AGI, reported on 27.1% of returns)
Here:
$16,352
State:
$25,864
Here:
20.3% of AGI
State:
21.9% of AGI
(% of AGI for various income ranges: 9.3% for AGIs below $10k, 7.0% for AGIs $10k-25k, 7.5% for AGIs $25k-50k, 11.6% for AGIs $50k-75k, 12.8% for AGIs $75k-100k, 14.0% for AGIs over 100k)
Charity contributions deductions: $2,534 (3% of AGI, reported on 22.8% of returns)
Here:
$2,534
State:
$4,439
Here:
3.0% of AGI
State:
3.6% of AGI
(% of AGI for various income ranges: 0.6% for AGIs below $10k, 0.7% for AGIs $10k-25k, 0.9% for AGIs $25k-50k, 1.1% for AGIs $50k-75k, 1.4% for AGIs $75k-100k, 2.6% for AGIs over 100k)
Total tax: $5,552 (reported on 75.0% of returns)
12043:
$5,552
State:
$11,730
(% of AGI for various income ranges: 3.0% for AGIs below $10k, 4.3% for AGIs $10k-25k, 6.8% for AGIs $25k-50k, 8.8% for AGIs $50k-75k, 10.1% for AGIs $75k-100k, 17.4% for AGIs over 100k)
Earned income credit: $1,567 (reported on 15.1% of returns)
Here:
$1,567
State:
$1,757
Percentage of individuals using paid preparers for their 2004 taxes: 61.0%
Here:
61%
State:
67%
(% for various income ranges: 52.4% for AGIs below $10k, 61.5% for AGIs $10k-25k, 61.9% for AGIs $25k-50k, 63.5% for AGIs $50k-75k, 66.2% for AGIs $75k-100k, 74.8% for AGIs over 100k)
Likely homosexual households (counted as self-reported same-sex unmarried-partner households)
Lesbian couples: 0.2% of all households
Gay men: 0.0% of all households
Household received Food Stamps/SNAP in the past 12 months: 328 Household did not receive Food Stamps/SNAP in the past 12 months: 2,507
Women who had a birth in the past 12 months: 111 (109 now married, 0 unmarried) Women who did not have a birth in the past 12 months: 1,914 (530 now married, 1,391 unmarried)
Housing units in zip code 12043 with a mortgage: 1,088 (159 second mortgage, 149 both second mortgage and home equity loan) Houses without a mortgage: 118
Median monthly owner costs for units with a mortgage: $1,543 Median monthly owner costs for units without a mortgage: $660
Residents with income below the poverty level in 2022:
This zip code:
13.3%
Whole state:
14.3%
Residents with income below 50% of the poverty level in 2022:
This zip code:
5.5%
Whole state:
6.8%
Median number of rooms in houses and condos:
Here:
6.7
State:
6.3
Median number of rooms in apartments:
Here:
4.1
State:
3.8
Notable locations in this zip code not listed on our city pages
Notable locations in zip code 12043: Shutts Corners (A), Fran Lan Farms (B), Cobleskill Golf and Country Club (C), Foundation Equestrian Center (D), Cobleskill Village Water Pollution Control Plant (E), Van Wagenen Library (F), Frisbie Hall (G), Ryder Hall (H), Alumni Hall (I), Wieting Hall (J), Wheeler Hall (K), Vroman Hall (L), Prentice Dining Hall (M), Bouck Hall (N), Knapp Hall (O), Draper Hall (P), Pearson Hall (Q), Dix Hall (R), Champlin Dining Hall (S), Fake Hall (T). Display/hide their locations on the map
Churches in zip code 12043 include: Open Bible Baptist Church (A), Saint Christopher Episcopal Church (B), Zion Evangelical Lutheran Church (C), Zion Lutheran Church of Seward (D). Display/hide their locations on the map
Cemeteries: Burhans Cemetery (1), Seward Cemetery (2), Strobeck Cemetery (3), Hynds Cemetery (4), Marcley Cemetery (5), New Rhinebeck Cemetery (6), Lawyersville Cemetery (7). Display/hide their locations on the map
669 married couples with children.
202 single-parent households (108 men, 94 women).
91.1% of residents of 12043 zip code speak English at home.
2.6% of residents speak Spanish at home (85% very well, 15% well).
4.6% of residents speak other Indo-European language at home (72% very well, 25% well, 3% not well).
1.2% of residents speak Asian or Pacific Island language at home (100% very well).
0.7% of residents speak other language at home (73% very well, 27% well).
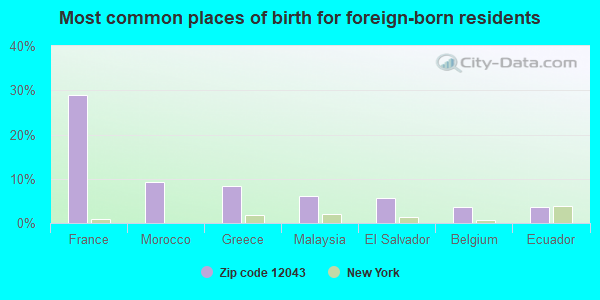
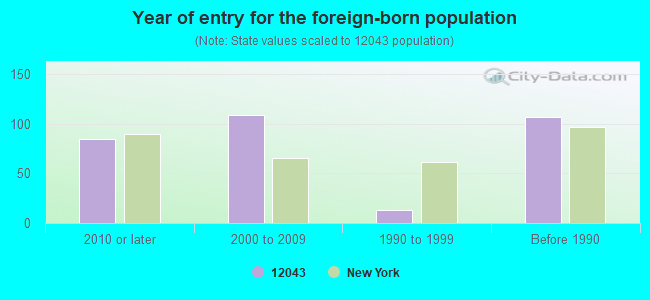
Foreign born population: 248 (3.3%) (60.2% of them are naturalized citizens)
This zip code:
3.3%
Whole state:
22.7%
29%France
9%Morocco
8%Greece
6%Malaysia
6%El Salvador
4%Belgium
4%Ecuador
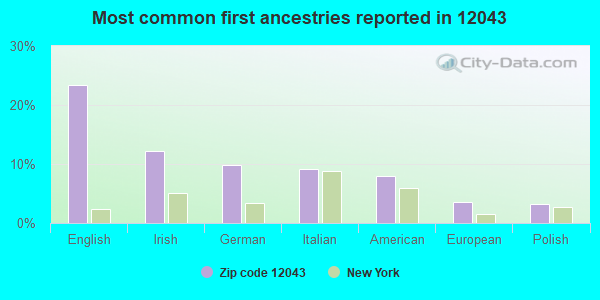
23%English
12%Irish
10%German
9%Italian
8%American
4%European
3%Polish
Year of entry for the foreign-born population
852010 or later
1092000 to 2009
131990 to 1999
107Before 1990
Major facilities with environmental interests located in this zip code:
COBLESKILL-V-WATER POLL CONTROL PLANT (EAST MACARTHUR AVE in COBLESKILL, NY)
STATE MASTER (New York facility tracking) - National Pollutant Discharge Elimination System Permit, REFUSE DISPOSAL, SOLID WASTE PROGRAM, National Pollutant Discharge Elimination System Permit National Pollutant Discharge Elimination System MAJOR (Tracking pollutant discharge elimination systems) - permit - ICIS-, ENFORCEMENT/COMPLIANCE ACTIVITY Business SIC classification: SEWERAGE SYSTEMS Business NAICS classification: SEWAGE TREATMENT FACILITIES. Organizations: COBLESKILL (V) (CONTACT/OWNER)
, COBLESKILL - V (LEGALLY RESPONSIBLE PARTY)
Alternative names: COBLESKILL (V), COBLESKILL (V) WPCP, COBLESKILL WATER POLLUTION CONTROL PLANT
COBLESKILL QUARRY (BARNERVILLE RD in COBLESKILL, NY)
AIR MINOR (AIRS/AFS) STATE MASTER (New York facility tracking) - MINE OPERATING PERMIT, AIR PROGRAM, MINE OPERATING PERMIT, National Pollutant Discharge Elimination System Permit Small Quantity Generators, between 100 kg and 1000 kg of hazardous waste/month (Resource Conservation and Recovery Act (tracking hazardous waste)) - notification Business SIC and NAICS classification: CRUSHED AND BROKEN LIMESTONE Organizations: EMIL J GALLASO (CONTACT/OWNER)
, COBLESKILL STONE PRODUCTS INC (LEGALLY RESPONSIBLE PARTY)
Alternative names: COBLESKILL STONE PRD, COBLESKILL STONE PRODUCTS INC, COBLESKILL STONE PROD-COBLESKILL QUARRY
AERO FORD/MERCURY (ROUTE 7 in COBLESKILL, NY)
STATE MASTER (New York facility tracking) - AIR PROGRAM HAZARDOUS WASTE BIENNIAL REPORTER (Resource Conservation and Recovery Act (tracking hazardous waste)) Large Quantity Generators, more that 1000 kg of hazardous waste/month (Resource Conservation and Recovery Act (tracking hazardous waste))
GEORGE D. RYDER ES ( in COBLESKILL, NY)
(National Center for Education Statistics) - STATE ID-541102060001 Organizations: COBLESKILL-RICHMONDVILLE CSD (SCHOOL DISTRICT)
COUNTRYSIDE #2 (1 W MAIN ST in COBLESKILL, NY)
(Resource Conservation and Recovery Act (tracking hazardous waste)) Organizations: DAVE VINCENT (CONTACT/OPERATOR)
COBLESKILL SCR (SHAD POINT in COBLESKILL, NY)
HAZARDOUS WASTE BIENNIAL REPORTER (Resource Conservation and Recovery Act (tracking hazardous waste)) Large Quantity Generators, more that 1000 kg of hazardous waste/month (Resource Conservation and Recovery Act (tracking hazardous waste)) Business NAICS classification: ELECTRIC BULK POWER TRANSMISSION AND CONTROL. Alternative names: COBLESKILL SERVICE CENTER
GLENS FALLS CEMENT TERMINAL (N OFF NYS RTE 7 TO SCHOHARIE in COBLESKILL, NY)
(Resource Conservation and Recovery Act (tracking hazardous waste))
COONS MARION (ELM ST in COBLESKILL, NY)
(Resource Conservation and Recovery Act (tracking hazardous waste))
COBLESKILL AGWAY COOP INC (1 W MAIN ST in COBLESKILL, NY)
(Resource Conservation and Recovery Act (tracking hazardous waste))
COBLESKILL MOBIL MART (RTE 7 E SITE 2 in COBLESKILL, NY)
(Resource Conservation and Recovery Act (tracking hazardous waste))
COBLESKILL PARTS CO (149 E MAIN ST in COBLESKILL, NY)
(Resource Conservation and Recovery Act (tracking hazardous waste))
COBLESKILL SUBSTATION (NORTH ST in COBLESKILL, NY)
(Resource Conservation and Recovery Act (tracking hazardous waste))
COBLESKILL VILLAGE OF (FRANCE LANE & GROVE ST INT in COBLESKILL, NY)
(Resource Conservation and Recovery Act (tracking hazardous waste))
Housing units lacking complete plumbing facilities: 3.5% Housing units lacking complete kitchen facilities: 2.8%
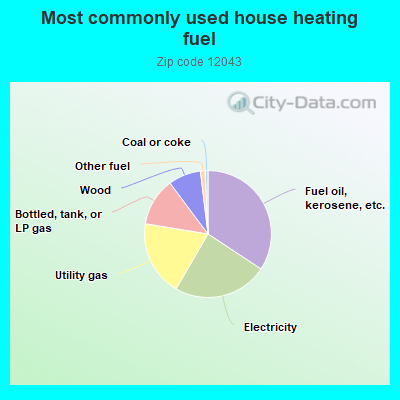
34.3%Fuel oil, kerosene, etc.
24.1%Electricity
19.2%Utility gas
12.2%Bottled, tank, or LP gas
8.3%Wood
1.2%Other fuel
0.7%Coal or coke
Population in 1990: 7,419. Population change in the 1990s: +788 (+10.6%).
Place of birth for U.S.-born residents:
This state: 6,308
Northeast: 487
Midwest: 57
South: 201
West: 212
60% of the 12043 zip code residents lived in the same house 5 years ago. Out of people who lived in different houses, 55% lived in this county. Out of people who lived in different counties, 50% lived in New York.
91% of the 12043 zip code residents lived in the same house 1 year ago. Out of people who lived in different houses, 50% moved from this county. Out of people who lived in different houses, 36% moved from different county within same state. Out of people who lived in different houses, 13% moved from different state. Out of people who lived in different houses, 0% moved from abroad.
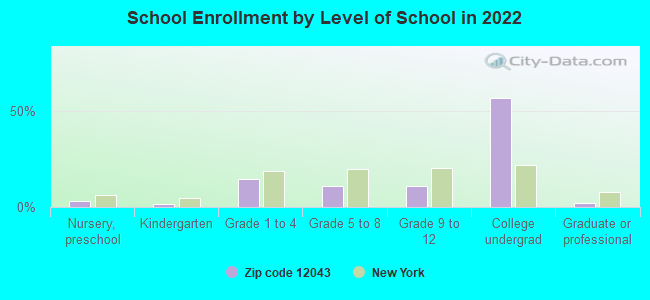
Private vs. public school enrollment:
Students in private schools in grades 1 to 8 (elementary and middle school): 30
Here:
5.2%
New York:
15.6%
Students in private schools in grades 9 to 12 (high school): 3
Here:
1.4%
New York:
15.0%
Students in private undergraduate colleges: 223
Here:
17.5%
New York:
39.2%
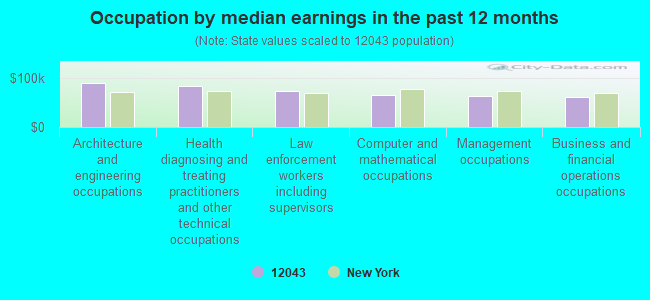
Occupation by median earnings in the past 12 months ($)
90,124Architecture and engineering occupations
83,129Health diagnosing and treating practitioners and other technical occupations
73,759Law enforcement workers including supervisors
65,542Computer and mathematical occupations
62,683Management occupations
61,914Business and financial operations occupations
Companies with federal contracts located in this zip code:
JOANNE DARCY CRUM (45 WEST MAIN STREET in COBLESKILL, NY; small business) : $64,000 in 3 contractsfrom 2000 to 2002
$35,000 with Army for Aeronautical Maps, Charts and Geodesic Products. Signed on 2002-09-28. Completion date: 2002-10-28.
$16,000 with United States Coast Guard (disused code: now 7008) for Other Special Studies and Analyses. Taking place in VT. Signed on 2001-11-15. Completion date: 2002-05-15.
$13,000 with United States Coast Guard (disused code: now 7008) for Land Surveys, Cadastral Services (non-construction). Taking place in VT. Signed on 2000-09-15. Completion date: 2000-12-15.
Top industries in this zip code by the number of employees in 2005:
Administrative and Support and Waste Management and Remediation Services: Facilities Support Services (100-249 employees: 1 establishment)
Health Care and Social Assistance: Nursing Care Facilities (100-249: 1)
2002 - 2018 National Fire Incident Reporting System (NFIRS) incidents
Based on the data from the years 2002 - 2018 the average number of fires per year is 16. The highest number of reported fires - 54 took place in 2008, and the least - 1 in 2018. The data has a decreasing trend.
When looking into fire subcategories, the most reports belonged to: Structure Fires (47.8%), and Outside Fires (24.3%).
Fire incident types reported to NFIRS in Zip Code 12043


+$433
-$2,666
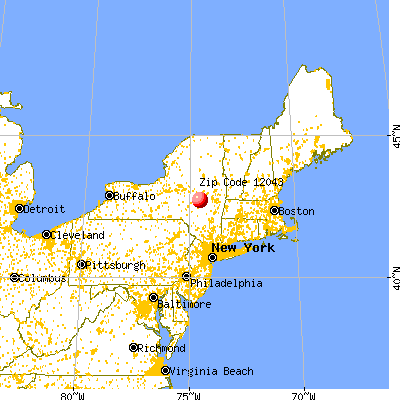
 Nearest zip codes: 12149, 13459, 12187, 12031, 12064, 12175.


 Based on the data from the years 2002 - 2018 the average number of fires per year is 16. The highest number of reported fires - 54 took place in 2008, and the least - 1 in 2018. The data has a decreasing trend.
 When looking into fire subcategories, the most reports belonged to: Structure Fires (47.8%), and Outside Fires (24.3%).