Estimated zip code population in 2022: 2,469 Zip code population in 2010: 3,201 Zip code population in 2000: 3,999
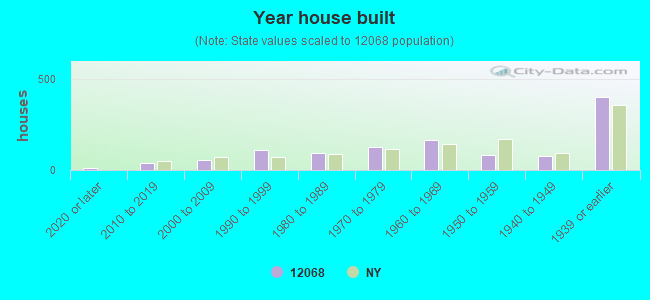
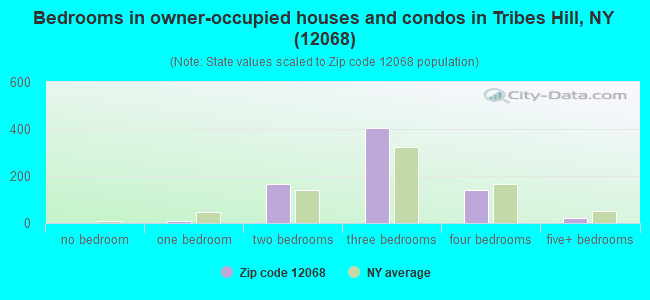
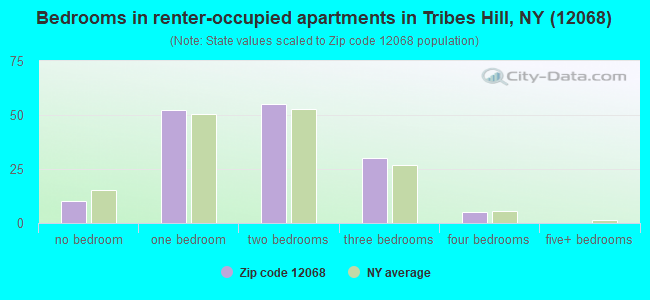
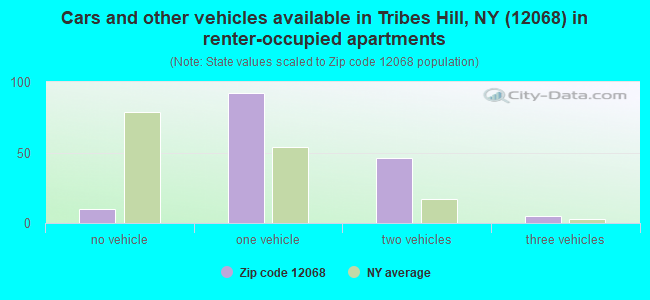
Houses and condos: 1,179 Renter-occupied apartments: 153
% of renters here:
17%
State:
46%
March 2022 cost of living index in zip code 12068: 94.1 (less than average, U.S. average is 100)
Land area: 30.8 sq. mi. Water area: 0.7 sq. mi.
Population density: 80 people per square mile
(very low).
OSM Map
General Map
Google Map
MSN Map
OSM Map
General Map
Google Map
MSN Map
OSM Map
General Map
Google Map
MSN Map
OSM Map
General Map
Google Map
MSN Map
Please wait while loading the map...
Real estate property taxes paid for housing units in 2022:
This zip code:
2.1% ($3,367)
New York:
1.5% ($6,180)
Median real estate property taxes paid for housing units with mortgages in 2022: $3,432 (2.2%) Median real estate property taxes paid for housing units with no mortgage in 2022: $3,011 (1.7%)
Business Search- 14 Million verified businesses
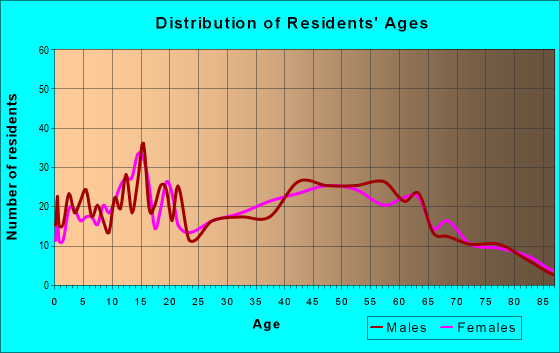
Males: 1,181
(47.8%)
Females: 1,287
(52.2%)
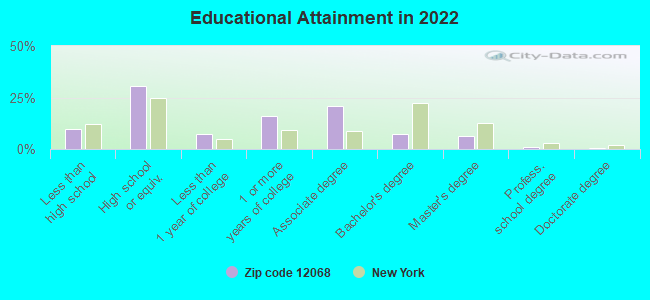
For population 25 years and over in 12068:
High school or higher: 89.2%
Bachelor's degree or higher: 15.2%
Graduate or professional degree: 7.8%
Unemployed: 2.4%
Mean travel time to work (commute): 24.7 minutes
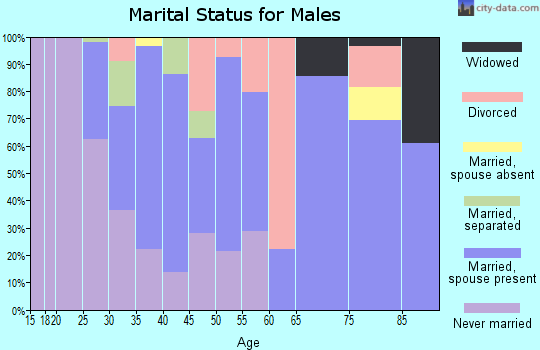
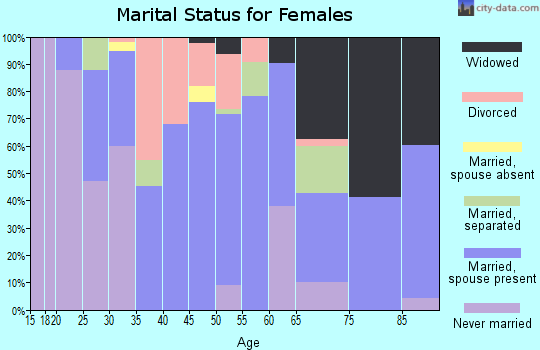
For population 15 years and over in 12068:
Never married: 33.1%
Now married: 43.6%
Separated: 1.1%
Widowed: 10.9%
Divorced: 11.3%
Zip code 12068 compared to state average:
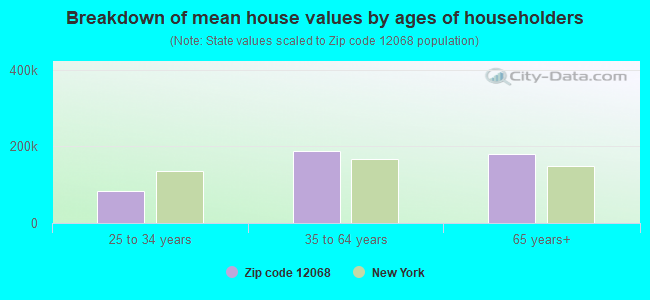
Median house value significantly below state average.
Unemployed percentage below state average.
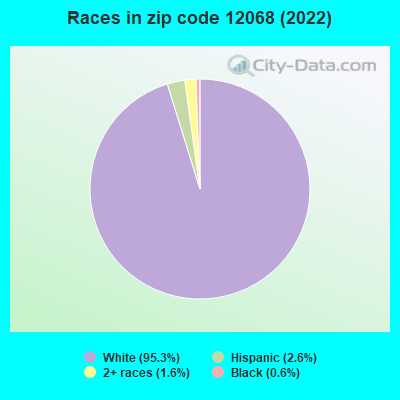
Black race population percentage significantly below state average.
Hispanic race population percentage significantly below state average.
Median age significantly above state average.
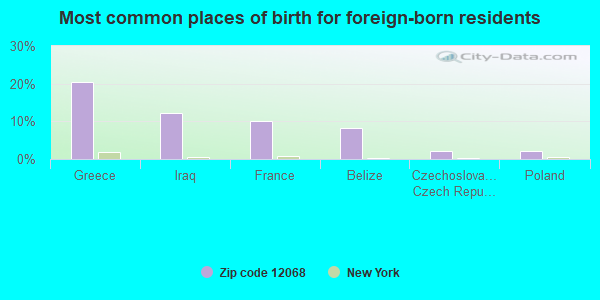
Foreign-born population percentage significantly below state average.
Renting percentage significantly below state average.
Length of stay since moving in significantly above state average.
Percentage of population with a bachelor's degree or higher significantly below state average.
Averages for the 2020 tax year for zip code 12068, filed in 2021:
Average Adjusted Gross Income (AGI) in 2020: $56,588 (Individual Income Tax Returns)
Here:
$56,588
State:
$90,930
Salary/wage: $50,570 (reported on 84.8% of returns)
Here:
$50,570
State:
$72,104
(% of AGI for various income ranges: 1262.8% for AGIs below $25k, 3475.8% for AGIs $25k-50k, 6161.8% for AGIs $50k-75k, 9071.0% for AGIs $75k-100k, 18837.7% for AGIs $100k-200k)
Taxable interest for individuals: $473 (reported on 29.7% of returns)
This zip code:
$473
New York:
$3,075
(% of AGI for various income ranges: 7.2% for AGIs below $25k, 15.2% for AGIs $25k-50k, 11.2% for AGIs $50k-75k, 34.0% for AGIs $75k-100k, 53.8% for AGIs $100k-200k)
Ordinary dividends: $2,014 (reported on 15.9% of returns)
Here:
$2,014
State:
$11,095
(% of AGI for various income ranges: 16.2% for AGIs below $25k, 33.0% for AGIs $25k-50k, 31.8% for AGIs $50k-75k, 31.0% for AGIs $75k-100k, 155.4% for AGIs $100k-200k)
Net capital gain/loss in AGI: +$9,960 (reported on 10.9% of returns)
Here:
+$9,960
State:
+$44,925
(% of AGI for various income ranges: 32.1% for AGIs $25k-50k, 31.2% for AGIs $50k-75k, 78.0% for AGIs $75k-100k, 967.7% for AGIs $100k-200k)
Profit/loss from business: +$7,682 (reported on 12.3% of returns)
Here:
+$7,682
State:
+$14,940
(% of AGI for various income ranges: 28.6% for AGIs below $25k, 38.8% for AGIs $25k-50k, 73.5% for AGIs $50k-75k, 368.0% for AGIs $75k-100k, 463.1% for AGIs $100k-200k)
Taxable individual retirement arrangement distribution: $14,740 (reported on 7.2% of returns)
12068:
$14,740
New York:
$19,609
(% of AGI for various income ranges: 46.6% for AGIs below $25k, 83.6% for AGIs $25k-50k, 337.1% for AGIs $50k-75k, 376.9% for AGIs $100k-200k)
Total itemized deductions: $23,975 (reported on 2.9% of returns)
Here:
$23,975
State:
$39,326
(% of AGI for various income ranges: 959.0% for AGIs $75k-100k)
Charity contributions: $6,050 (reported on 1.4% of returns)
Here:
$6,050
State:
$15,420
(% of AGI for various income ranges: 71.2% for AGIs $50k-75k)
Taxes paid: $8,600 (reported on 2.9% of returns)
12068:
$8,600
State:
$9,183
(% of AGI for various income ranges: 344.0% for AGIs $75k-100k)
Earned income credit: $1,960 (reported on 14.5% of returns)
Here:
$1,960
State:
$2,138
(% of AGI for various income ranges: 76.6% for AGIs below $25k, 51.5% for AGIs $25k-50k)
Percentage of individuals using paid preparers for their 2020 taxes: 94.9%
Here:
95%
State:
95%
(% for various income ranges: 94.9% for AGIs below $25k, 95.1% for AGIs $25k-50k, 95.5% for AGIs $50k-75k, 93.3% for AGIs $75k-100k, 94.7% for AGIs $100k-200k, 100.0% for AGIs over 200k)
Averages for the 2012 tax year for zip code 12068, filed in 2013:
Average Adjusted Gross Income (AGI) in 2012: $45,799 (Individual Income Tax Returns)
Here:
$45,799
State:
$77,088
Salary/wage: $41,422 (reported on 85.3% of returns)
Here:
$41,422
State:
$60,593
(% of AGI for various income ranges: 74.4% for AGIs below $25k, 81.7% for AGIs $25k-50k, 80.1% for AGIs $50k-75k, 75.4% for AGIs $75k-100k, 73.2% for AGIs $100k-200k)
Taxable interest for individuals: $624 (reported on 33.1% of returns)
This zip code:
$624
New York:
$3,125
(% of AGI for various income ranges: 0.4% for AGIs below $25k, 0.3% for AGIs $25k-50k, 0.5% for AGIs $50k-75k, 1.2% for AGIs $75k-100k, 0.2% for AGIs $100k-200k)
Ordinary dividends: $1,873 (reported on 19.1% of returns)
Here:
$1,873
State:
$10,299
(% of AGI for various income ranges: 1.2% for AGIs below $25k, 0.9% for AGIs $25k-50k, 1.1% for AGIs $50k-75k, 0.8% for AGIs $75k-100k, 0.3% for AGIs $100k-200k)
Net capital gain/loss in AGI: +$1,186 (reported on 10.3% of returns)
Here:
+$1,186
State:
+$42,474
(% of AGI for various income ranges: 1.4% for AGIs below $25k, 0.4% for AGIs $50k-75k, 0.1% for AGIs $75k-100k)
Profit/loss from business: +$3,961 (reported on 13.2% of returns)
Here:
+$3,961
State:
+$16,168
(% of AGI for various income ranges: 4.5% for AGIs below $25k, 1.2% for AGIs $25k-50k, 0.1% for AGIs $50k-75k, 1.0% for AGIs $75k-100k, 0.7% for AGIs $100k-200k)
Taxable individual retirement arrangement distribution: $9,300 (reported on 8.1% of returns)
12068:
$9,300
New York:
$17,621
(% of AGI for various income ranges: 2.1% for AGIs below $25k, 1.7% for AGIs $25k-50k, 2.1% for AGIs $50k-75k, 3.6% for AGIs $75k-100k)
Total itemized deductions: $19,789 (23% of AGI, reported on 26.5% of returns)
Here:
$19,789
State:
$34,985
Here:
23.3% of AGI
State:
21.3% of AGI
(% of AGI for various income ranges: 6.1% for AGIs below $25k, 7.4% for AGIs $25k-50k, 10.2% for AGIs $50k-75k, 11.2% for AGIs $75k-100k, 17.7% for AGIs $100k-200k)
Charity contributions: $1,958 (reported on 17.6% of returns)
Here:
$1,958
State:
$5,572
(% of AGI for various income ranges: 0.5% for AGIs $25k-50k, 0.8% for AGIs $50k-75k, 1.2% for AGIs $75k-100k, 1.0% for AGIs $100k-200k)
Taxes paid: $8,956 (reported on 26.5% of returns)
12068:
$8,956
State:
$18,656
(% of AGI for various income ranges: 1.7% for AGIs below $25k, 2.5% for AGIs $25k-50k, 4.3% for AGIs $50k-75k, 5.2% for AGIs $75k-100k, 9.2% for AGIs $100k-200k)
Earned income credit: $2,285 (reported on 19.1% of returns)
Here:
$2,285
State:
$2,230
(% of AGI for various income ranges: 6.0% for AGIs below $25k, 1.5% for AGIs $25k-50k)
Percentage of individuals using paid preparers for their 2012 taxes: 52.9%
Here:
53%
State:
66%
(% for various income ranges: 45.1% for AGIs below $25k, 55.3% for AGIs $25k-50k, 56.5% for AGIs $50k-75k, 58.3% for AGIs $75k-100k, 66.7% for AGIs $100k-200k)
Averages for the 2004 tax year for zip code 12068, filed in 2005:
Average Adjusted Gross Income (AGI) in 2004: $40,019 (Individual Income Tax Returns)
Here:
$40,019
State:
$59,519
Salary/wage: $33,571 (reported on 87.6% of returns)
Here:
$33,571
State:
$50,673
(% of AGI for various income ranges: 133.3% for AGIs below $10k, 73.8% for AGIs $10k-25k, 84.5% for AGIs $25k-50k, 83.6% for AGIs $50k-75k, 82.0% for AGIs $75k-100k, 43.8% for AGIs over 100k)
Taxable interest for individuals: $904 (reported on 47.6% of returns)
This zip code:
$904
New York:
$2,377
(% of AGI for various income ranges: 6.2% for AGIs below $10k, 2.1% for AGIs $10k-25k, 0.7% for AGIs $25k-50k, 0.6% for AGIs $50k-75k, 0.9% for AGIs $75k-100k, 1.2% for AGIs over 100k)
Taxable dividends: $1,627 (reported on 21.5% of returns)
Here:
$1,627
State:
$5,394
(% of AGI for various income ranges: 4.9% for AGIs below $10k, 1.4% for AGIs $10k-25k, 0.7% for AGIs $25k-50k, 0.7% for AGIs $50k-75k, 0.7% for AGIs $75k-100k, 0.9% for AGIs over 100k)
Net capital gain/loss: +$3,117 (reported on 14.8% of returns)
Here:
+$3,117
State:
+$23,581
(% of AGI for various income ranges: -1.5% for AGIs below $10k, 0.7% for AGIs $10k-25k, -0.0% for AGIs $25k-50k, 1.0% for AGIs $50k-75k, -0.1% for AGIs $75k-100k, 3.6% for AGIs over 100k)
Profit/loss from business: +$6,033 (reported on 13.6% of returns)
Here:
+$6,033
State:
+$13,809
(% of AGI for various income ranges: 11.5% for AGIs below $10k, 6.8% for AGIs $10k-25k, 2.2% for AGIs $25k-50k, 0.9% for AGIs $50k-75k, 2.5% for AGIs $75k-100k)
Profit/loss from farming: +$174 (reported on 1.7% of returns)
Here:
+$174
State:
-$2,666
IRA payment deduction: $2,250 (reported on 2.1% of returns)
12068:
$2,250
New York:
$3,115
Total itemized deductions: $15,737 (20% of AGI, reported on 25.7% of returns)
Here:
$15,737
State:
$25,864
Here:
20.2% of AGI
State:
21.9% of AGI
(% of AGI for various income ranges: 5.9% for AGIs $10k-25k, 8.6% for AGIs $25k-50k, 11.9% for AGIs $50k-75k, 14.2% for AGIs $75k-100k, 10.1% for AGIs over 100k)
Charity contributions deductions: $2,030 (2% of AGI, reported on 22.7% of returns)
Here:
$2,030
State:
$4,439
Here:
2.5% of AGI
State:
3.6% of AGI
(% of AGI for various income ranges: 0.6% for AGIs $10k-25k, 1.0% for AGIs $25k-50k, 1.4% for AGIs $50k-75k, 1.3% for AGIs $75k-100k, 1.3% for AGIs over 100k)
Total tax: $5,329 (reported on 74.6% of returns)
12068:
$5,329
State:
$11,730
(% of AGI for various income ranges: 3.8% for AGIs below $10k, 4.3% for AGIs $10k-25k, 6.3% for AGIs $25k-50k, 8.2% for AGIs $50k-75k, 9.5% for AGIs $75k-100k, 18.8% for AGIs over 100k)
Earned income credit: $1,679 (reported on 16.1% of returns)
Here:
$1,679
State:
$1,757
Percentage of individuals using paid preparers for their 2004 taxes: 65.0%
Here:
65%
State:
67%
(% for various income ranges: 58.3% for AGIs below $10k, 64.1% for AGIs $10k-25k, 67.1% for AGIs $25k-50k, 68.2% for AGIs $50k-75k, 62.2% for AGIs $75k-100k, 80.4% for AGIs over 100k)
Likely homosexual households (counted as self-reported same-sex unmarried-partner households)
Lesbian couples: 1.4% of all households
Gay men: 0.0% of all households
Household received Food Stamps/SNAP in the past 12 months: 54 Household did not receive Food Stamps/SNAP in the past 12 months: 829
Women who had a birth in the past 12 months: 18 (18 now married, 0 unmarried) Women who did not have a birth in the past 12 months: 365 (166 now married, 197 unmarried)
Housing units in zip code 12068 with a mortgage: 442 (34 second mortgage, 35 both second mortgage and home equity loan) Houses without a mortgage: 45
Median monthly owner costs for units with a mortgage: $1,251 Median monthly owner costs for units without a mortgage: $621
Residents with income below the poverty level in 2022:
This zip code:
9.5%
Whole state:
14.3%
Residents with income below 50% of the poverty level in 2022:
This zip code:
6.6%
Whole state:
6.8%
Median number of rooms in houses and condos:
Here:
6.3
State:
6.3
Median number of rooms in apartments:
Here:
4.3
State:
3.8
Notable locations in this zip code not listed on our city pages
Notable locations in zip code 12068: Longmeadow Farm (A), Appleridge Farm (B), Fonda - Fultonville Wastewater Treatment Plant (C), Sand Flats Orchard (D), Frothingham Free Library (E), Mohawk Volunteer Fire Department (F). Display/hide their locations on the map
Churches in zip code 12068 include: Tekakwitha Friary (A), Fonda Reformed Church (B), Saint Cecilia Church (C), Saving Grace Baptist Church (D). Display/hide their locations on the map
In group quarters: 88 (-1 institutionalized population)
Size of family households: 218 2-persons, 142 3-persons, 67 4-persons, 68 5-persons, 16 7-or-more-persons
Size of nonfamily households: 314 1-person, 63 2-persons, 4 3-persons
439 married couples with children.
74 single-parent households (30 men, 44 women).
96.6% of residents of 12068 zip code speak English at home.
0.5% of residents speak Spanish at home (67% very well, 33% well).
2.8% of residents speak other Indo-European language at home (85% well, 15% not well).
0.3% of residents speak other language at home (100% very well).
Foreign born population: 50 (2.0%) (82.8% of them are naturalized citizens)
This zip code:
2.0%
Whole state:
22.7%
20%Greece
12%Iraq
10%France
8%Belize
2%Czechoslovakia (includes Czech Republic and Slovakia)
2%Poland
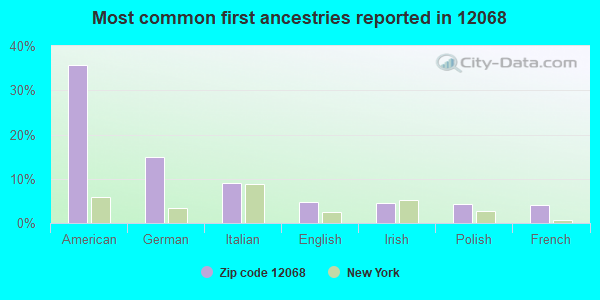
36%American
15%German
9%Italian
5%English
5%Irish
4%Polish
4%French
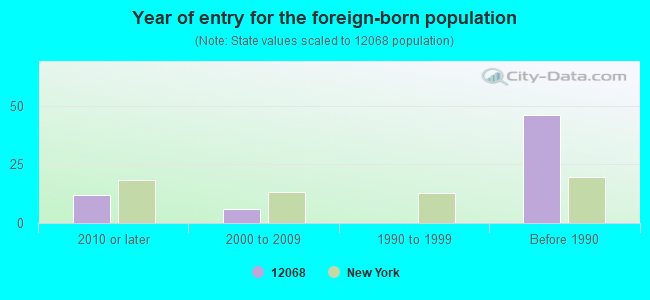
Year of entry for the foreign-born population
122010 or later
62000 to 2009
01990 to 1999
46Before 1990
Facilities with environmental interests located in this zip code:
GO OIL CO INC (70 W MAIN ST in FONDA, NY)
(Integrated Compliance Information System) - ICIS-02-1992-0253, FORMAL ENFORCEMENT ACTION
CUMBERLAND FARMS #3183 (MAIN ST RTE 5 & CENTER ST in FONDA, NY)
Large Quantity Generators, more that 1000 kg of hazardous waste/month (Resource Conservation and Recovery Act (tracking hazardous waste)) Organizations: CUMBERLAND FARMS INC (CONTACT/OPERATOR)
Alternative names: CUMBERLAND FARMS 3183
CONRAIL FONDA YARD (STATE RTE 5 in FONDA, NY)
(Resource Conservation and Recovery Act (tracking hazardous waste))
Housing units lacking complete plumbing facilities: 7.2% Housing units lacking complete kitchen facilities: 6.2%
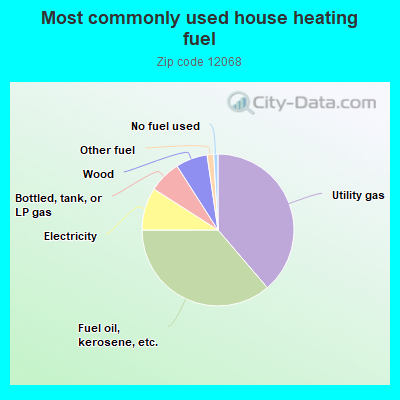
38.9%Utility gas
36.4%Fuel oil, kerosene, etc.
9.1%Electricity
6.9%Bottled, tank, or LP gas
6.8%Wood
1.4%Other fuel
0.9%No fuel used
Population in 1990: 2,307. Population change in the 1990s: +1,692 (+73.3%).
Place of birth for U.S.-born residents:
This state: 2,158
Northeast: 154
Midwest: 1
South: 55
West: 23
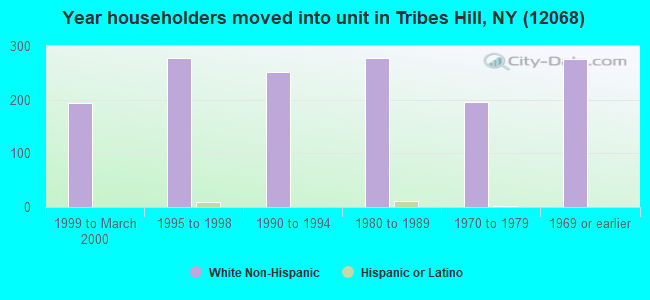
67% of the 12068 zip code residents lived in the same house 5 years ago. Out of people who lived in different houses, 69% lived in this county. Out of people who lived in different counties, 50% lived in New York.
90% of the 12068 zip code residents lived in the same house 1 year ago. Out of people who lived in different houses, 28% moved from this county. Out of people who lived in different houses, 29% moved from different county within same state. Out of people who lived in different houses, 39% moved from different state. Out of people who lived in different houses, 5% moved from abroad.
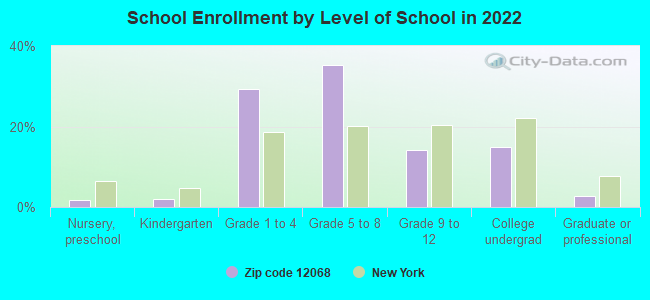
Private vs. public school enrollment:
Students in private schools in grades 1 to 8 (elementary and middle school):
Here:
0.0%
New York:
15.6%
Students in private schools in grades 9 to 12 (high school): 22
Here:
28.4%
New York:
15.0%
Students in private undergraduate colleges: 21
Here:
25.6%
New York:
39.2%
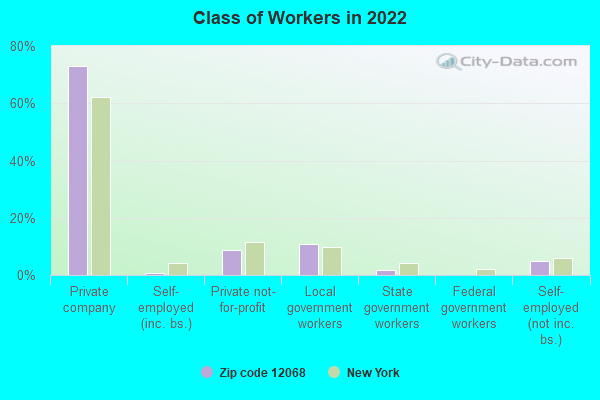
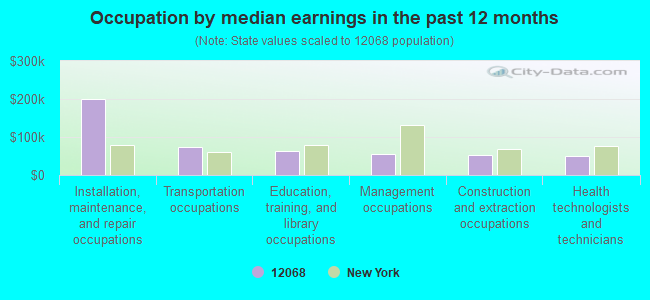
Occupation by median earnings in the past 12 months ($)
200,833Installation, maintenance, and repair occupations
74,252Transportation occupations
62,162Education, training, and library occupations
56,163Management occupations
53,924Construction and extraction occupations
49,289Health technologists and technicians
Companies with federal contracts located in this zip code:
BROWN COACH INC (12 BRIDGE ST in FONDA, NY; small business) : $55,700 in 5 contractsin 2003
Contracts for Motor Passenger Services by Army Signed by year:2000: $0; 2001: $0; 2002: $0; 2003: $55,700; 2004: $0; 2005: $0; 2006: $0.
Biggest contracts:
$22,150 with Army for Motor Passenger Services. Signed on 2003-02-13. Completion date: 2003-02-28.
$16,250, same as above.Signed on 2003-02-20. Completion date: 2003-02-28.
$11,700, same as above.Signed on 2003-03-05. Completion date: 2003-02-28.
$3,000, same as above.Signed on 2003-03-17. Completion date: 2003-03-21.
Top industries in this zip code by the number of employees in 2005:
Health Care and Social Assistance: Residential Mental Retardation Facilities (50-99 employees: 1 establishment, 20-49 employees: 1 establishment, 5-9 employees: 1 establishment)
Accommodation and Food Services: Full-Service Restaurants (5-9: 1, 1-4: 3)
Construction: New Single-Family Housing Construction (except Operative Builders) (5-9: 1, 1-4: 1)
People in group quarters in 2010:
34 people in group homes intended for adults
8 people in residential treatment centers for adults
People in group quarters in 2000:
24 people in homes or halfway houses for drug/alcohol abuse
7 people in homes for the mentally retarded
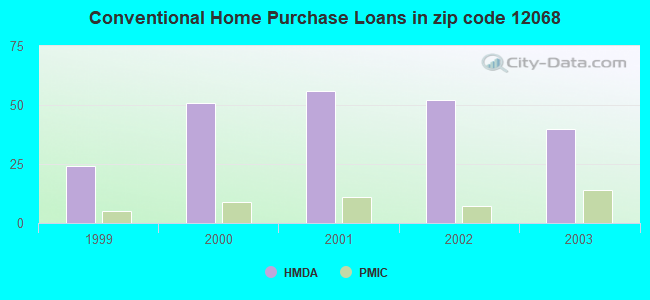
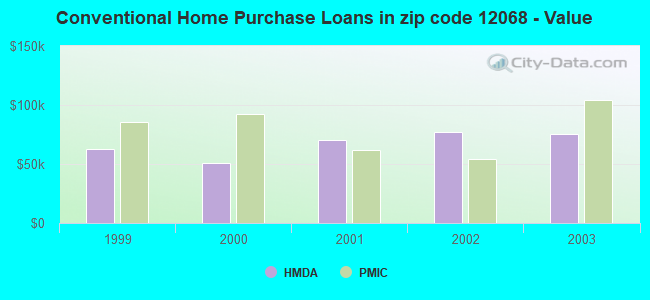
Home Mortgage Disclosure Act Aggregated Statistics For Year 2003 (Based on 2 partial tracts)
A) FHA, FSA/RHS & VA Home Purchase Loans
B) Conventional Home Purchase Loans
C) Refinancings
D) Home Improvement Loans
F) Non-occupant Loans on < 5 Family Dwellings (A B C & D)
Number
Average Value
Number
Average Value
Number
Average Value
Number
Average Value
Number
Average Value
LOANS ORIGINATED
18
$82,831
40
$75,678
168
$69,468
11
$8,718
9
$47,044
APPLICATIONS APPROVED, NOT ACCEPTED
2
$76,900
9
$90,269
45
$63,450
2
$27,140
4
$50,662
APPLICATIONS DENIED
2
$53,375
13
$115,941
141
$71,195
22
$13,817
0
$0
APPLICATIONS WITHDRAWN
2
$37,995
5
$109,650
87
$82,796
4
$29,402
0
$0
FILES CLOSED FOR INCOMPLETENESS
2
$46,140
2
$36,190
5
$42,340
2
$40,710
0
$0
Aggregated Statistics For Year 2002 (Based on 2 partial tracts)
A) FHA, FSA/RHS & VA Home Purchase Loans
B) Conventional Home Purchase Loans
C) Refinancings
D) Home Improvement Loans
F) Non-occupant Loans on < 5 Family Dwellings (A B C & D)
Number
Average Value
Number
Average Value
Number
Average Value
Number
Average Value
Number
Average Value
LOANS ORIGINATED
14
$58,547
52
$76,899
107
$62,957
18
$11,258
5
$36,912
APPLICATIONS APPROVED, NOT ACCEPTED
0
$0
4
$102,682
31
$67,240
5
$19,542
0
$0
APPLICATIONS DENIED
0
$0
16
$46,931
107
$80,814
24
$7,765
0
$0
APPLICATIONS WITHDRAWN
4
$38,450
5
$76,356
56
$71,019
5
$26,056
4
$41,615
FILES CLOSED FOR INCOMPLETENESS
0
$0
2
$95,900
9
$74,186
0
$0
0
$0
Aggregated Statistics For Year 2001 (Based on 2 partial tracts)
A) FHA, FSA/RHS & VA Home Purchase Loans
B) Conventional Home Purchase Loans
C) Refinancings
D) Home Improvement Loans
F) Non-occupant Loans on < 5 Family Dwellings (A B C & D)
Number
Average Value
Number
Average Value
Number
Average Value
Number
Average Value
Number
Average Value
LOANS ORIGINATED
27
$60,649
56
$70,211
89
$68,595
45
$9,570
2
$29,855
APPLICATIONS APPROVED, NOT ACCEPTED
4
$61,520
9
$61,118
24
$66,495
0
$0
0
$0
APPLICATIONS DENIED
0
$0
47
$45,736
81
$47,469
36
$11,560
2
$63,330
APPLICATIONS WITHDRAWN
2
$44,330
2
$4,525
54
$76,263
11
$24,838
0
$0
FILES CLOSED FOR INCOMPLETENESS
0
$0
0
$0
4
$45,235
0
$0
0
$0
Aggregated Statistics For Year 2000 (Based on 2 partial tracts)
A) FHA, FSA/RHS & VA Home Purchase Loans
B) Conventional Home Purchase Loans
C) Refinancings
D) Home Improvement Loans
F) Non-occupant Loans on < 5 Family Dwellings (A B C & D)
Number
Average Value
Number
Average Value
Number
Average Value
Number
Average Value
Number
Average Value
LOANS ORIGINATED
14
$59,581
51
$51,125
33
$54,830
49
$12,740
2
$27,140
APPLICATIONS APPROVED, NOT ACCEPTED
0
$0
20
$63,058
16
$74,751
13
$15,588
2
$71,470
APPLICATIONS DENIED
2
$45,235
43
$46,666
71
$64,680
29
$18,406
7
$68,757
APPLICATIONS WITHDRAWN
2
$52,475
11
$31,254
33
$50,334
2
$24,425
0
$0
FILES CLOSED FOR INCOMPLETENESS
0
$0
0
$0
4
$47,950
0
$0
0
$0
Aggregated Statistics For Year 1999 (Based on 1 partial tract)
A) FHA, FSA/RHS & VA Home Purchase Loans
B) Conventional Home Purchase Loans
C) Refinancings
D) Home Improvement Loans
F) Non-occupant Loans on < 5 Family Dwellings (A B C & D)


+$174
-$2,666
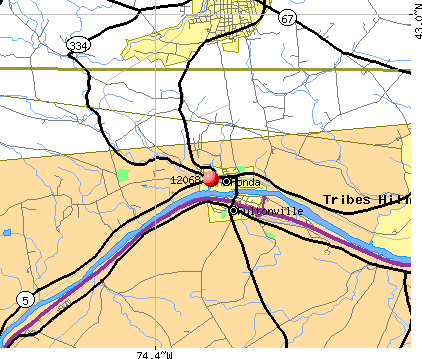 Nearest zip codes: 12095, 12072, 12177, 12069, 12166, 12070.