Estimated zip code population in 2022: 1,158 Zip code population in 2010: 1,572 Zip code population in 2000: 1,654
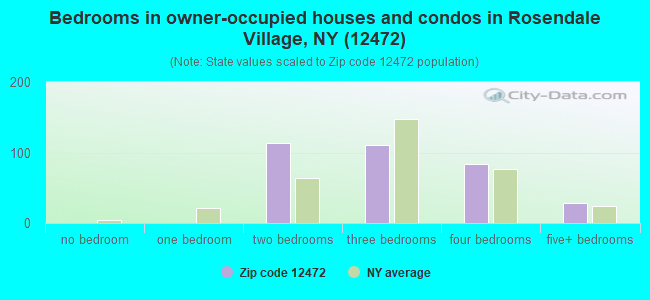
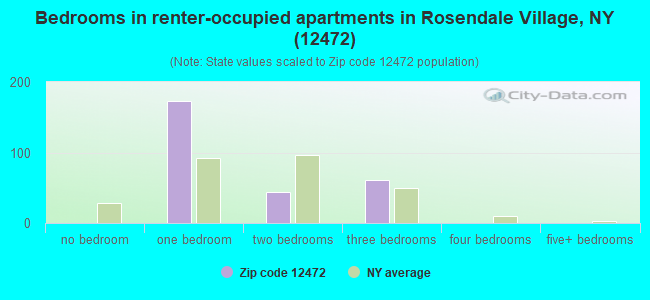
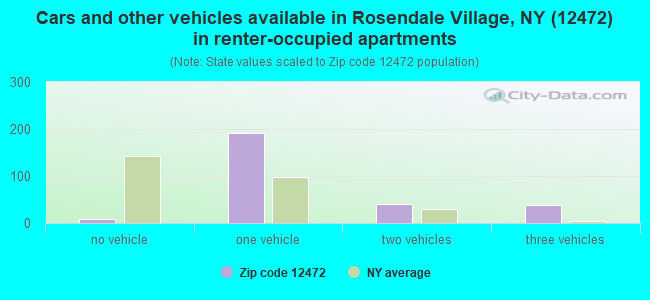
Houses and condos: 724 Renter-occupied apartments: 278
% of renters here:
45%
State:
46%
March 2022 cost of living index in zip code 12472: 109.4 (more than average, U.S. average is 100)
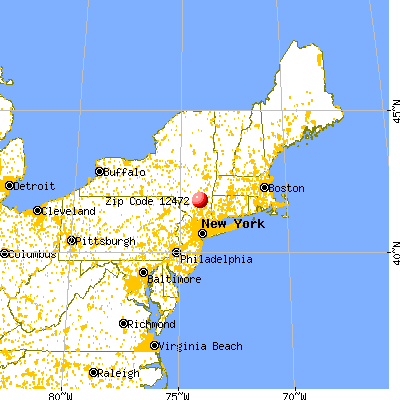
Land area: 3.6 sq. mi. Water area: 0.2 sq. mi.
Population density: 324 people per square mile
(very low).
OSM Map
General Map
Google Map
MSN Map
OSM Map
General Map
Google Map
MSN Map
OSM Map
General Map
Google Map
MSN Map
OSM Map
General Map
Google Map
MSN Map
Please wait while loading the map...
Real estate property taxes paid for housing units in 2022:
This zip code:
2.2% ($6,183)
New York:
1.5% ($6,180)
Median real estate property taxes paid for housing units with mortgages in 2022: $6,080 (2.1%) Median real estate property taxes paid for housing units with no mortgage in 2022: $6,336 (2.4%)
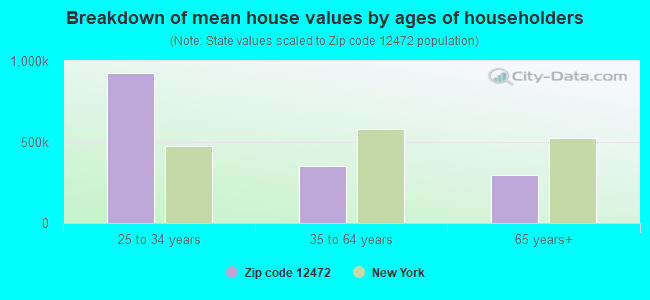
Estimated median house/condo value in 2022: $278,226
12472:
$278,226
New York:
$400,400
According to our research of New York and other state lists, there was 1 registered sex offender living in 12472 zip code as of April 26, 2024. The ratio of all residents to sex offenders in zip code 12472 is 1,439 to 1. The ratio of registered sex offenders to all residents in this zip code is lower than the state average.
Median resident age:
This zip code:
48.9 years
New York median age:
40.0 years
Average household size:
This zip code:
1.8 people
New York:
2.5 people
Averages for the 2020 tax year for zip code 12472, filed in 2021:
Average Adjusted Gross Income (AGI) in 2020: $66,525 (Individual Income Tax Returns)
Here:
$66,525
State:
$90,930
Salary/wage: $56,643 (reported on 76.5% of returns)
Here:
$56,643
State:
$72,104
(% of AGI for various income ranges: 1082.4% for AGIs below $25k, 3136.0% for AGIs $25k-50k, 6437.8% for AGIs $50k-75k, 10948.0% for AGIs $75k-100k, 13910.0% for AGIs $100k-200k)
Taxable interest for individuals: $735 (reported on 43.5% of returns)
This zip code:
$735
New York:
$3,075
(% of AGI for various income ranges: 15.9% for AGIs below $25k, 22.7% for AGIs $25k-50k, 33.3% for AGIs $50k-75k, 96.0% for AGIs $75k-100k, 82.5% for AGIs $100k-200k)
Ordinary dividends: $5,244 (reported on 21.2% of returns)
Here:
$5,244
State:
$11,095
(% of AGI for various income ranges: 12.4% for AGIs below $25k, 72.7% for AGIs $25k-50k, 93.3% for AGIs $50k-75k, 272.0% for AGIs $75k-100k, 742.5% for AGIs $100k-200k)
Net capital gain/loss in AGI: +$10,859 (reported on 20.0% of returns)
Here:
+$10,859
State:
+$44,925
(% of AGI for various income ranges: 46.7% for AGIs $25k-50k, 74.4% for AGIs $50k-75k, 406.0% for AGIs $75k-100k, 1885.0% for AGIs $100k-200k)
Profit/loss from business: +$10,585 (reported on 23.5% of returns)
Here:
+$10,585
State:
+$14,940
(% of AGI for various income ranges: 193.5% for AGIs below $25k, 305.3% for AGIs $25k-50k, 293.3% for AGIs $50k-75k, 584.0% for AGIs $75k-100k, 967.5% for AGIs $100k-200k)
Taxable individual retirement arrangement distribution: $13,475 (reported on 9.4% of returns)
12472:
$13,475
New York:
$19,609
(% of AGI for various income ranges: 254.0% for AGIs $25k-50k, 366.7% for AGIs $50k-75k, 458.8% for AGIs $100k-200k)
Total itemized deductions: $20,250 (reported on 7.1% of returns)
Here:
$20,250
State:
$39,326
(% of AGI for various income ranges: 321.3% for AGIs $25k-50k, 916.2% for AGIs $100k-200k)
Charity contributions: $2,350 (reported on 4.7% of returns)
Here:
$2,350
State:
$15,420
(% of AGI for various income ranges: 117.5% for AGIs $100k-200k)
Taxes paid: $7,200 (reported on 7.1% of returns)
12472:
$7,200
State:
$9,183
(% of AGI for various income ranges: 119.3% for AGIs $25k-50k, 316.2% for AGIs $100k-200k)
Earned income credit: $1,356 (reported on 10.6% of returns)
Here:
$1,356
State:
$2,138
(% of AGI for various income ranges: 71.8% for AGIs below $25k)
Percentage of individuals using paid preparers for their 2020 taxes: 95.3%
Here:
95%
State:
95%
(% for various income ranges: 92.3% for AGIs below $25k, 95.2% for AGIs $25k-50k, 100.0% for AGIs $50k-75k, 100.0% for AGIs $75k-100k, 100.0% for AGIs $100k-200k, 75.0% for AGIs over 200k)
Averages for the 2012 tax year for zip code 12472, filed in 2013:
Average Adjusted Gross Income (AGI) in 2012: $47,064 (Individual Income Tax Returns)
Here:
$47,064
State:
$77,088
Salary/wage: $42,627 (reported on 83.3% of returns)
Here:
$42,627
State:
$60,593
(% of AGI for various income ranges: 69.6% for AGIs below $25k, 79.4% for AGIs $25k-50k, 82.9% for AGIs $50k-75k, 71.6% for AGIs $75k-100k, 72.5% for AGIs $100k-200k)
Taxable interest for individuals: $516 (reported on 45.2% of returns)
This zip code:
$516
New York:
$3,125
(% of AGI for various income ranges: 1.0% for AGIs below $25k, 0.3% for AGIs $25k-50k, 0.3% for AGIs $50k-75k, 0.4% for AGIs $75k-100k, 0.7% for AGIs $100k-200k)
Ordinary dividends: $2,506 (reported on 21.4% of returns)
Here:
$2,506
State:
$10,299
(% of AGI for various income ranges: 2.6% for AGIs below $25k, 1.4% for AGIs $25k-50k, 0.6% for AGIs $50k-75k, 0.7% for AGIs $75k-100k, 1.1% for AGIs $100k-200k)
Net capital gain/loss in AGI: +$1,575 (reported on 9.5% of returns)
Here:
+$1,575
State:
+$42,474
(% of AGI for various income ranges: 1.1% for AGIs $100k-200k)
Profit/loss from business: +$6,594 (reported on 20.2% of returns)
Here:
+$6,594
State:
+$16,168
(% of AGI for various income ranges: 11.8% for AGIs below $25k, 2.7% for AGIs $25k-50k, 2.3% for AGIs $50k-75k, 3.4% for AGIs $75k-100k)
Taxable individual retirement arrangement distribution: $9,312 (reported on 9.5% of returns)
12472:
$9,312
New York:
$17,621
Total itemized deductions: $19,079 (25% of AGI, reported on 34.5% of returns)
Here:
$19,079
State:
$34,985
Here:
25.0% of AGI
State:
21.3% of AGI
(% of AGI for various income ranges: 17.0% for AGIs below $25k, 9.5% for AGIs $25k-50k, 12.9% for AGIs $50k-75k, 14.2% for AGIs $75k-100k, 15.9% for AGIs $100k-200k)
Charity contributions: $1,679 (reported on 28.6% of returns)
Here:
$1,679
State:
$5,572
(% of AGI for various income ranges: 0.7% for AGIs below $25k, 0.8% for AGIs $25k-50k, 1.0% for AGIs $50k-75k, 1.2% for AGIs $75k-100k, 1.2% for AGIs $100k-200k)
Taxes paid: $9,255 (reported on 34.5% of returns)
12472:
$9,255
State:
$18,656
(% of AGI for various income ranges: 5.4% for AGIs below $25k, 3.7% for AGIs $25k-50k, 5.3% for AGIs $50k-75k, 7.6% for AGIs $75k-100k, 9.4% for AGIs $100k-200k)
Earned income credit: $1,527 (reported on 17.9% of returns)
Here:
$1,527
State:
$2,230
(% of AGI for various income ranges: 4.1% for AGIs below $25k, 0.8% for AGIs $25k-50k)
Percentage of individuals using paid preparers for their 2012 taxes: 54.8%
Here:
55%
State:
66%
(% for various income ranges: 48.6% for AGIs below $25k, 50.0% for AGIs $25k-50k, 57.1% for AGIs $50k-75k, 62.5% for AGIs $75k-100k, 77.8% for AGIs $100k-200k)
Averages for the 2004 tax year for zip code 12472, filed in 2005:
Average Adjusted Gross Income (AGI) in 2004: $35,492 (Individual Income Tax Returns)
Here:
$35,492
State:
$59,519
Salary/wage: $34,252 (reported on 84.0% of returns)
Here:
$34,252
State:
$50,673
(% of AGI for various income ranges: 87.3% for AGIs below $10k, 77.7% for AGIs $10k-25k, 84.2% for AGIs $25k-50k, 79.9% for AGIs $50k-75k, 76.2% for AGIs $75k-100k, 83.8% for AGIs over 100k)
Taxable interest for individuals: $748 (reported on 52.5% of returns)
This zip code:
$748
New York:
$2,377
(% of AGI for various income ranges: 5.9% for AGIs below $10k, 1.4% for AGIs $10k-25k, 1.0% for AGIs $25k-50k, 0.8% for AGIs $50k-75k, 1.2% for AGIs $75k-100k, 0.6% for AGIs over 100k)
Taxable dividends: $1,308 (reported on 24.3% of returns)
Here:
$1,308
State:
$5,394
(% of AGI for various income ranges: 3.2% for AGIs below $10k, 1.9% for AGIs $10k-25k, 0.9% for AGIs $25k-50k, 0.9% for AGIs $50k-75k, 0.4% for AGIs $75k-100k, 0.3% for AGIs over 100k)
Net capital gain/loss: +$1,521 (reported on 16.6% of returns)
Here:
+$1,521
State:
+$23,581
(% of AGI for various income ranges: -4.6% for AGIs below $10k, 0.1% for AGIs $10k-25k, 0.5% for AGIs $25k-50k, 0.9% for AGIs $50k-75k, 2.8% for AGIs $75k-100k, 0.0% for AGIs over 100k)
Profit/loss from business: +$4,384 (reported on 18.9% of returns)
Here:
+$4,384
State:
+$13,809
(% of AGI for various income ranges: 16.0% for AGIs below $10k, 6.5% for AGIs $10k-25k, 1.4% for AGIs $25k-50k, 1.5% for AGIs $50k-75k, 0.8% for AGIs $75k-100k, 1.1% for AGIs over 100k)
IRA payment deduction: $2,522 (reported on 2.6% of returns)
12472:
$2,522
New York:
$3,115
Total itemized deductions: $15,228 (24% of AGI, reported on 30.9% of returns)
Here:
$15,228
State:
$25,864
Here:
23.9% of AGI
State:
21.9% of AGI
(% of AGI for various income ranges: 12.5% for AGIs below $10k, 10.5% for AGIs $10k-25k, 9.7% for AGIs $25k-50k, 15.7% for AGIs $50k-75k, 15.0% for AGIs $75k-100k, 15.5% for AGIs over 100k)
Charity contributions deductions: $1,786 (3% of AGI, reported on 27.4% of returns)
Here:
$1,786
State:
$4,439
Here:
2.7% of AGI
State:
3.6% of AGI
(% of AGI for various income ranges: 0.8% for AGIs $10k-25k, 0.9% for AGIs $25k-50k, 2.0% for AGIs $50k-75k, 1.6% for AGIs $75k-100k, 1.6% for AGIs over 100k)
Total tax: $4,357 (reported on 77.5% of returns)
12472:
$4,357
State:
$11,730
(% of AGI for various income ranges: 4.2% for AGIs below $10k, 4.9% for AGIs $10k-25k, 7.7% for AGIs $25k-50k, 9.1% for AGIs $50k-75k, 10.8% for AGIs $75k-100k, 15.2% for AGIs over 100k)
Earned income credit: $1,371 (reported on 15.2% of returns)
Here:
$1,371
State:
$1,757
Percentage of individuals using paid preparers for their 2004 taxes: 55.8%
Here:
56%
State:
67%
(% for various income ranges: 47.9% for AGIs below $10k, 52.2% for AGIs $10k-25k, 55.9% for AGIs $25k-50k, 64.0% for AGIs $50k-75k, 67.2% for AGIs $75k-100k, 70.2% for AGIs over 100k)
Likely homosexual households (counted as self-reported same-sex unmarried-partner households)
Lesbian couples: 0.0% of all households
Gay men: 0.4% of all households
Household received Food Stamps/SNAP in the past 12 months: 32 Household did not receive Food Stamps/SNAP in the past 12 months: 575
Women who did not have a birth in the past 12 months: 237 (111 now married, 124 unmarried)
Housing units in zip code 12472 with a mortgage: 228 (23 second mortgage, 24 both second mortgage and home equity loan) Median monthly owner costs for units with a mortgage: $1,917 Median monthly owner costs for units without a mortgage: $942
Residents with income below the poverty level in 2022:
This zip code:
12.0%
Whole state:
14.3%
Residents with income below 50% of the poverty level in 2022:
This zip code:
5.5%
Whole state:
6.8%
Median number of rooms in houses and condos:
Here:
5.6
State:
6.3
Median number of rooms in apartments:
Here:
3.4
State:
3.8
Notable locations in this zip code not listed on our city pages
Churches in zip code 12472 include: Saint Peter's Roman Catholic Church (A), Reformed Church (B), All Saints Church (C). Display/hide their locations on the map
In group quarters: 20 (-1 institutionalized population)
Size of family households: 209 2-persons, 47 3-persons, 30 4-persons, 26 5-persons
Size of nonfamily households: 274 1-person, 35 2-persons
99 married couples with children.
42 single-parent households (42 women).
96.0% of residents of 12472 zip code speak English at home.
2.4% of residents speak other Indo-European language at home (100% very well).
1.6% of residents speak Asian or Pacific Island language at home (44% well, 56% not well).
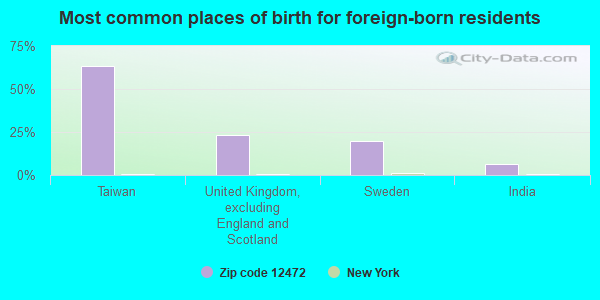
Foreign born population: 30 (2.6%) (26.8% of them are naturalized citizens)
This zip code:
2.6%
Whole state:
22.7%
63%Taiwan
23%United Kingdom, excluding England and Scotland
20%Sweden
7%India
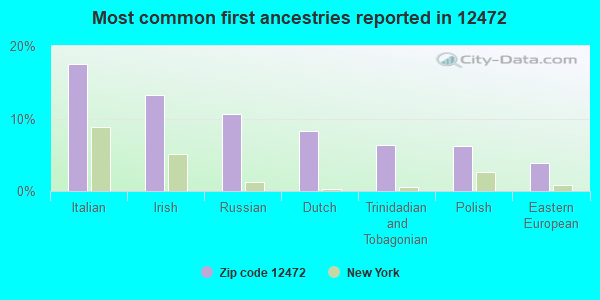
18%Italian
13%Irish
11%Russian
8%Dutch
6%Trinidadian and Tobagonian
6%Polish
4%Eastern European
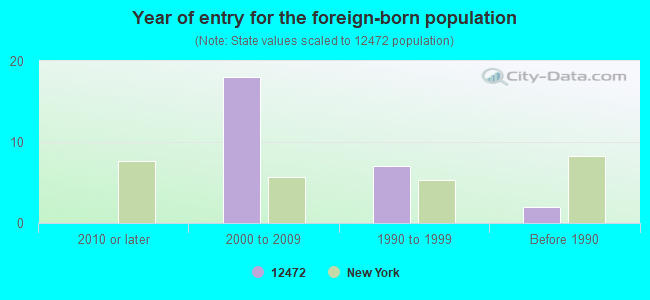
Year of entry for the foreign-born population
02010 or later
182000 to 2009
71990 to 1999
2Before 1990
Facilities with environmental interests located in this zip code:
A T & T CORP (MAPLE HILL DR in ROSENDALE, NY)
(Resource Conservation and Recovery Act (tracking hazardous waste))
IRON MOUNTAIN RECORDS MGMT CO (BINNEWATER RD BOX 86 in ROSENDALE, NY)
(Resource Conservation and Recovery Act (tracking hazardous waste))
COASTAL MART (RTE 32 & MADELINE LANE in ROSENDALE, NY)
(Resource Conservation and Recovery Act (tracking hazardous waste))
CREEK LOCKS ROAD (136 AND 144 CREEK LOCKS ROAD in ROSENDALE, NY)
SUPERFUND (Superfund database)
Housing units lacking complete plumbing facilities: 1.5% Housing units lacking complete kitchen facilities: 1.5%
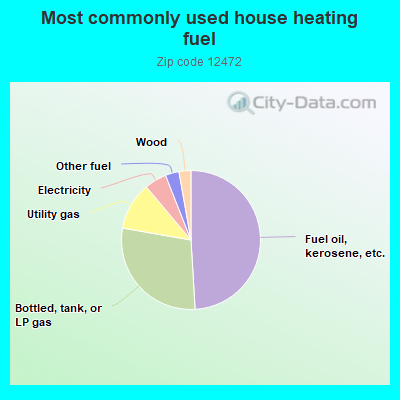
49.4%Fuel oil, kerosene, etc.
28.9%Bottled, tank, or LP gas
11.2%Utility gas
5.2%Electricity
3.2%Other fuel
2.8%Wood
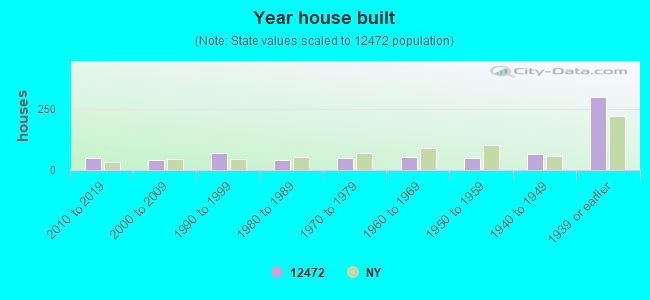
Population in 1990: 2,939.
Place of birth for U.S.-born residents:
This state: 961
Northeast: 72
Midwest: 40
South: 16
West: 36
60% of the 12472 zip code residents lived in the same house 5 years ago. Out of people who lived in different houses, 53% lived in this county. Out of people who lived in different counties, 50% lived in New York.
92% of the 12472 zip code residents lived in the same house 1 year ago. Out of people who lived in different houses, 76% moved from this county. Out of people who lived in different houses, 21% moved from different state.
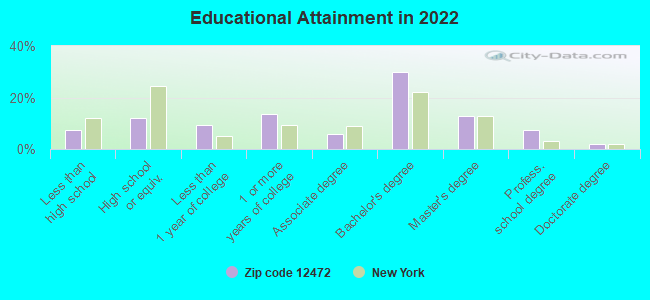
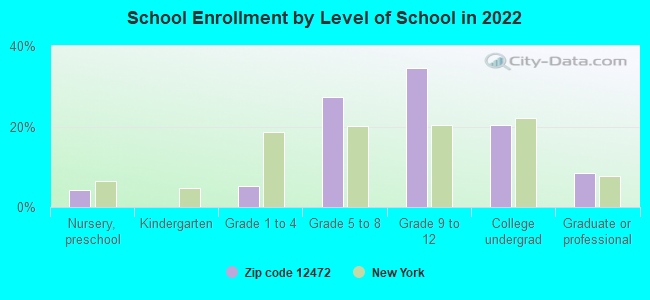
Private vs. public school enrollment:
Students in private schools in grades 1 to 8 (elementary and middle school): 28
Here:
36.2%
New York:
15.6%
Students in private schools in grades 9 to 12 (high school):
Here:
0.0%
New York:
15.0%
Students in private undergraduate colleges: 5
Here:
12.3%
New York:
39.2%
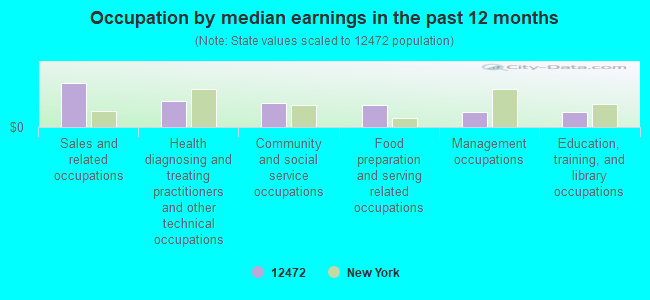
Occupation by median earnings in the past 12 months ($)
128,496Sales and related occupations
76,259Health diagnosing and treating practitioners and other technical occupations
70,177Community and social service occupations
63,967Food preparation and serving related occupations
44,051Management occupations
43,250Education, training, and library occupations
Top industries in this zip code by the number of employees in 2005:
Accommodation and Food Services: Hotels (except Casino Hotels) and Motels (20-49 employees: 1 establishment)
Health Care and Social Assistance: Other Residential Care Facilities (20-49: 1)
Accommodation and Food Services: Full-Service Restaurants (5-9: 2, 1-4: 2)
Wholesale Trade: Tobacco and Tobacco Product Merchant Wholesalers (10-19: 1)
Health Care and Social Assistance: Residential Mental Health and Substance Abuse Facilities (10-19: 1)
Other Services (except Public Administration): Religious Organizations (5-9: 1, 1-4: 1)
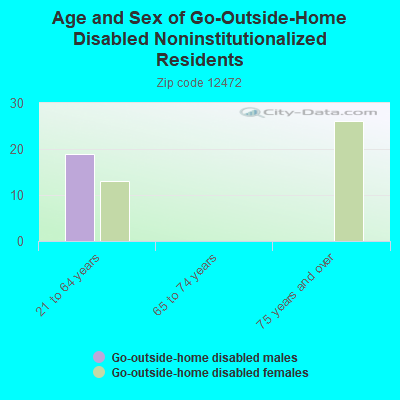
People in group quarters in 2010:
12 people in emergency and transitional shelters (with sleeping facilities) for people experiencing homelessness
People in group quarters in 2000:
13 people in other noninstitutional group quarters
10 people in homes for the mentally ill
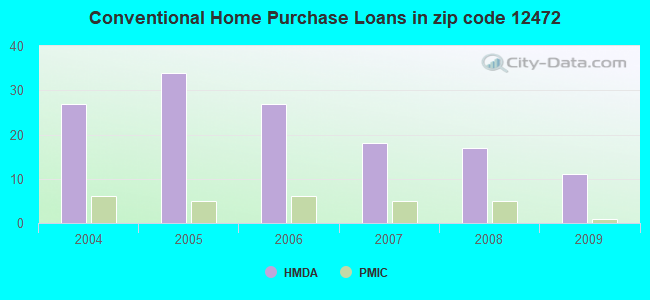
Home Mortgage Disclosure Act Aggregated Statistics For Year 2009 (Based on 4 partial tracts)
A) FHA, FSA/RHS & VA Home Purchase Loans
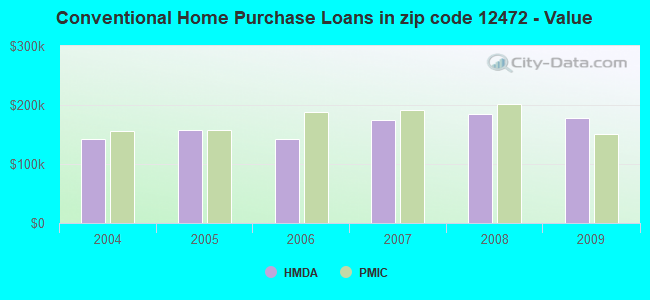
B) Conventional Home Purchase Loans
C) Refinancings
D) Home Improvement Loans
E) Loans on Dwellings For 5+ Families
F) Non-occupant Loans on < 5 Family Dwellings (A B C & D)
G) Loans On Manufactured Home Dwelling (A B C & D)
Number
Average Value
Number
Average Value
Number
Average Value
Number
Average Value
Number
Average Value
Number
Average Value
Number
Average Value
LOANS ORIGINATED
3
$172,680
11
$177,854
21
$158,193
7
$45,990
1
$263,650
3
$149,173
0
$0
APPLICATIONS APPROVED, NOT ACCEPTED
1
$66,760
0
$0
2
$129,540
0
$0
0
$0
0
$0
0
$0
APPLICATIONS DENIED
0
$0
1
$176,440
15
$155,228
2
$87,395
0
$0
1
$162,150
1
$32,100
APPLICATIONS WITHDRAWN
1
$96,670
1
$68,800
6
$147,000
0
$0
1
$167,660
0
$0
0
$0
FILES CLOSED FOR INCOMPLETENESS
0
$0
0
$0
0
$0
0
$0
0
$0
0
$0
0
$0
Aggregated Statistics For Year 2008 (Based on 4 partial tracts)
A) FHA, FSA/RHS & VA Home Purchase Loans
B) Conventional Home Purchase Loans
C) Refinancings
D) Home Improvement Loans
F) Non-occupant Loans on < 5 Family Dwellings (A B C & D)
G) Loans On Manufactured Home Dwelling (A B C & D)
Number
Average Value
Number
Average Value
Number
Average Value
Number
Average Value
Number
Average Value
Number
Average Value
LOANS ORIGINATED
2
$200,275
17
$184,001
17
$138,921
7
$65,430
5
$181,966
1
$30,070
APPLICATIONS APPROVED, NOT ACCEPTED
0
$0
2
$142,250
2
$103,295
2
$63,700
1
$89,180
1
$70,220
APPLICATIONS DENIED
0
$0
2
$213,385
17
$172,508
10
$74,846
1
$80,520
2
$72,670
APPLICATIONS WITHDRAWN
0
$0
3
$134,563
8
$136,169
0
$0
0
$0
0
$0
FILES CLOSED FOR INCOMPLETENESS
0
$0
1
$54,800
1
$236,820
0
$0
0
$0
1
$15,290
Aggregated Statistics For Year 2007 (Based on 4 partial tracts)
A) FHA, FSA/RHS & VA Home Purchase Loans
B) Conventional Home Purchase Loans
C) Refinancings
D) Home Improvement Loans
F) Non-occupant Loans on < 5 Family Dwellings (A B C & D)
G) Loans On Manufactured Home Dwelling (A B C & D)
Number
Average Value
Number
Average Value
Number
Average Value
Number
Average Value
Number
Average Value
Number
Average Value
LOANS ORIGINATED
1
$77,970
18
$174,392
26
$147,302
9
$85,127
3
$175,787
1
$32,970
APPLICATIONS APPROVED, NOT ACCEPTED
0
$0
3
$174,927
11
$134,205
2
$112,110
1
$118,600
1
$91,540
APPLICATIONS DENIED
1
$50,450
6
$203,315
27
$187,767
10
$80,362
4
$220,912
1
$55,540
APPLICATIONS WITHDRAWN
1
$97,610
5
$157,700
10
$184,534
2
$133,535
1
$254,290
0
$0
FILES CLOSED FOR INCOMPLETENESS
0
$0
0
$0
3
$121,173
1
$175,790
0
$0
0
$0
Aggregated Statistics For Year 2006 (Based on 4 partial tracts)
A) FHA, FSA/RHS & VA Home Purchase Loans
B) Conventional Home Purchase Loans
C) Refinancings
D) Home Improvement Loans
E) Loans on Dwellings For 5+ Families
F) Non-occupant Loans on < 5 Family Dwellings (A B C & D)
G) Loans On Manufactured Home Dwelling (A B C & D)
Number
Average Value
Number
Average Value
Number
Average Value
Number
Average Value
Number
Average Value
Number
Average Value
Number
Average Value
LOANS ORIGINATED
1
$113,210
27
$142,127
44
$147,493
14
$82,595
1
$10,190
6
$164,570
4
$47,408
APPLICATIONS APPROVED, NOT ACCEPTED
0
$0
4
$105,738
9
$141,356
2
$50,620
0
$0
1
$126,580
2
$31,850
APPLICATIONS DENIED
0
$0
7
$155,160
32
$166,757
10
$95,849
0
$0
5
$78,346
2
$64,020
APPLICATIONS WITHDRAWN
0
$0
3
$133,327
19
$145,604
4
$140,462
0
$0
2
$92,490
0
$0
FILES CLOSED FOR INCOMPLETENESS
0
$0
1
$181,410
8
$151,019
0
$0
0
$0
1
$141,160
0
$0
Aggregated Statistics For Year 2005 (Based on 4 partial tracts)
B) Conventional Home Purchase Loans
C) Refinancings
D) Home Improvement Loans
E) Loans on Dwellings For 5+ Families
F) Non-occupant Loans on < 5 Family Dwellings (A B C & D)
G) Loans On Manufactured Home Dwelling (A B C & D)
Number
Average Value
Number
Average Value
Number
Average Value
Number
Average Value
Number
Average Value
Number
Average Value
LOANS ORIGINATED
34
$157,853
45
$133,017
23
$59,503
1
$458,890
8
$184,758
2
$49,550
APPLICATIONS APPROVED, NOT ACCEPTED
6
$126,630
7
$109,001
3
$42,360
1
$149,310
2
$104,945
2
$92,635
APPLICATIONS DENIED
11
$146,970
30
$129,095
13
$56,338
0
$0
3
$104,770
4
$39,955
APPLICATIONS WITHDRAWN
3
$172,597
35
$140,872
3
$90,933
0
$0
0
$0
0
$0
FILES CLOSED FOR INCOMPLETENESS
2
$334,145
11
$148,971
0
$0
0
$0
0
$0
0
$0
Aggregated Statistics For Year 2004 (Based on 4 partial tracts)
A) FHA, FSA/RHS & VA Home Purchase Loans
B) Conventional Home Purchase Loans
C) Refinancings
D) Home Improvement Loans
E) Loans on Dwellings For 5+ Families
F) Non-occupant Loans on < 5 Family Dwellings (A B C & D)
G) Loans On Manufactured Home Dwelling (A B C & D)


 Nearest zip codes: 12486, 12419, 12471, 12411, 12487, 12443.