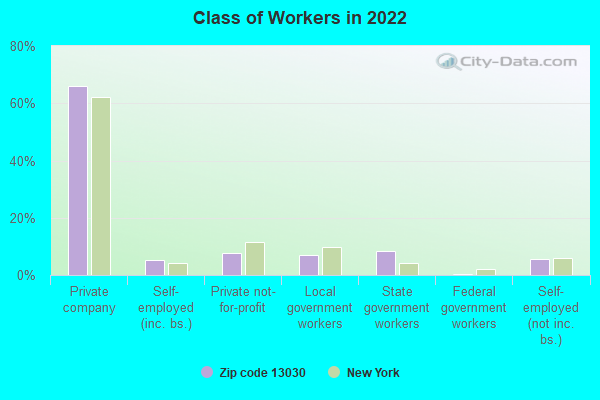
Estimated zip code population in 2022: 3,944 Zip code population in 2010: 3,892 Zip code population in 2000: 4,272
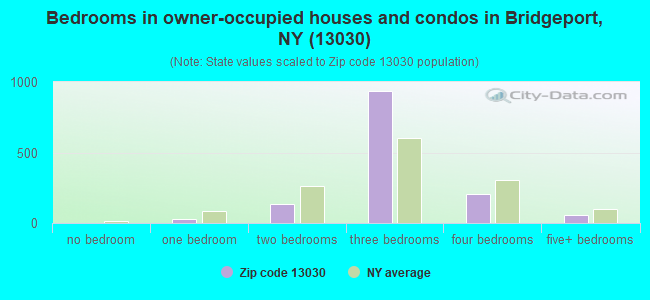
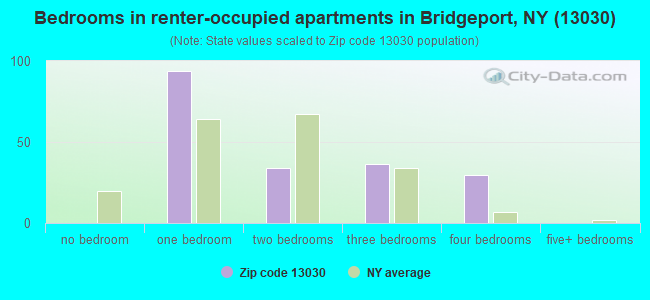
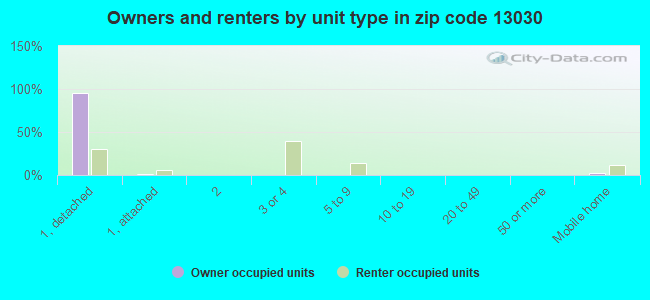
Houses and condos: 1,882 Renter-occupied apartments: 195
% of renters here:
12%
State:
46%
March 2022 cost of living index in zip code 13030: 94.6 (less than average, U.S. average is 100)
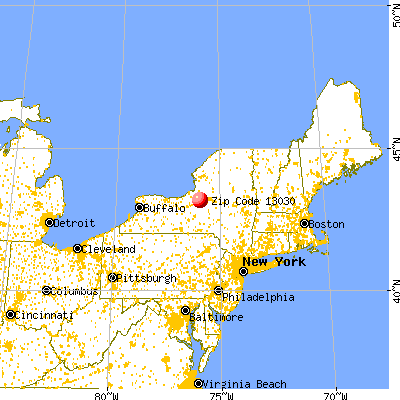
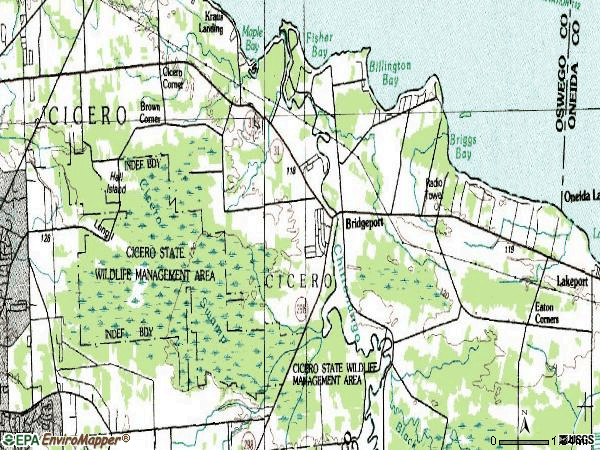
Land area: 13.3 sq. mi. Water area: 0.1 sq. mi.
Population density: 296 people per square mile
(very low).
OSM Map
General Map
Google Map
MSN Map
OSM Map
General Map
Google Map
MSN Map
OSM Map
General Map
Google Map
MSN Map
OSM Map
General Map
Google Map
MSN Map
Please wait while loading the map...
Real estate property taxes paid for housing units in 2022:
This zip code:
2.3% ($4,543)
New York:
1.5% ($6,180)
Median real estate property taxes paid for housing units with mortgages in 2022: $4,301 (2.2%) Median real estate property taxes paid for housing units with no mortgage in 2022: $5,352 (2.5%)
Business Search- 14 Million verified businesses
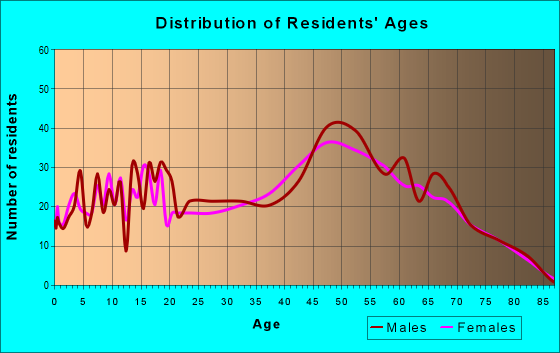
Males: 1,990
(50.5%)
Females: 1,953
(49.5%)
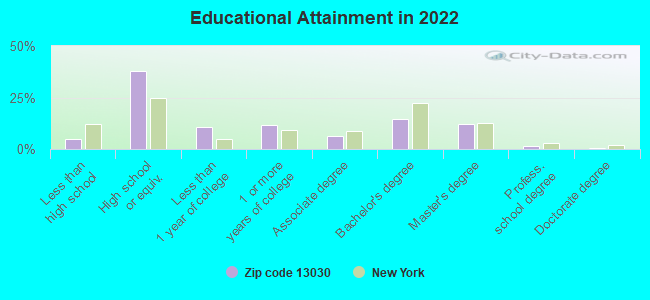
For population 25 years and over in 13030:
High school or higher: 94.9%
Bachelor's degree or higher: 28.4%
Graduate or professional degree: 14.1%
Unemployed: 2.4%
Mean travel time to work (commute): 22.5 minutes
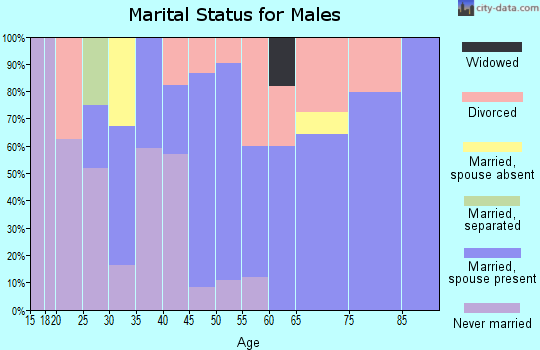
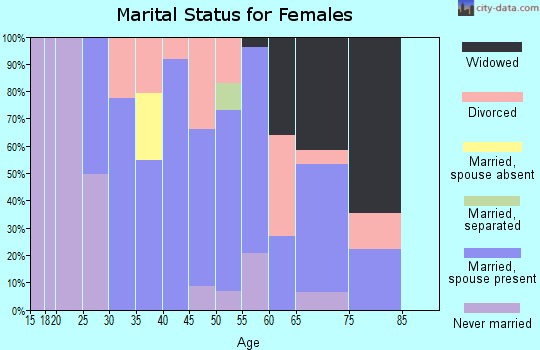
For population 15 years and over in 13030:
Never married: 25.8%
Now married: 57.6%
Separated: 2.2%
Widowed: 3.6%
Divorced: 10.8%
Zip code 13030 compared to state average:
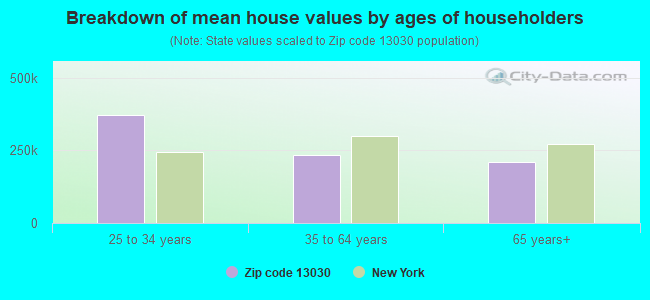
Median house value below state average.
Unemployed percentage below state average.
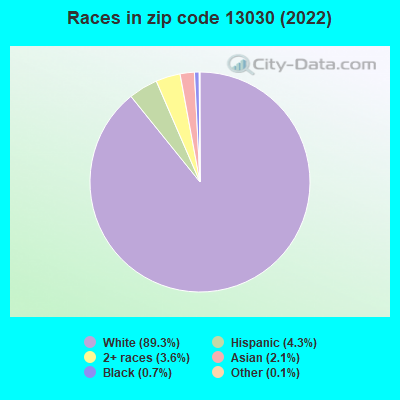
Black race population percentage significantly below state average.
Hispanic race population percentage significantly below state average.
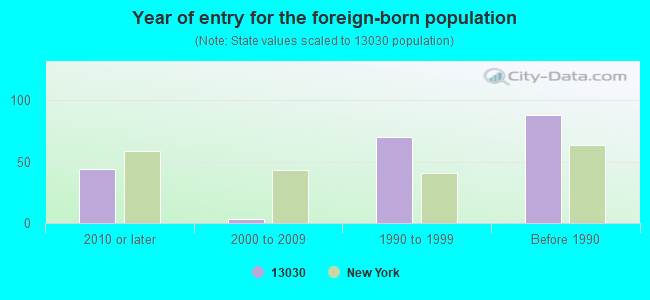
Foreign-born population percentage significantly below state average.
Renting percentage significantly below state average.
Length of stay since moving in significantly above state average.
Averages for the 2020 tax year for zip code 13030, filed in 2021:
Average Adjusted Gross Income (AGI) in 2020: $68,088 (Individual Income Tax Returns)
Here:
$68,088
State:
$90,930
Salary/wage: $55,845 (reported on 80.6% of returns)
Here:
$55,845
State:
$72,104
(% of AGI for various income ranges: 1016.0% for AGIs below $25k, 3162.7% for AGIs $25k-50k, 6290.0% for AGIs $50k-75k, 8790.0% for AGIs $75k-100k, 15566.1% for AGIs $100k-200k, 49980.0% for AGIs over 200k)
Taxable interest for individuals: $831 (reported on 40.3% of returns)
This zip code:
$831
New York:
$3,075
(% of AGI for various income ranges: 16.0% for AGIs below $25k, 19.8% for AGIs $25k-50k, 29.2% for AGIs $50k-75k, 38.1% for AGIs $75k-100k, 70.0% for AGIs $100k-200k, 876.7% for AGIs over 200k)
Ordinary dividends: $3,945 (reported on 20.9% of returns)
Here:
$3,945
State:
$11,095
(% of AGI for various income ranges: 26.2% for AGIs below $25k, 23.1% for AGIs $25k-50k, 86.7% for AGIs $50k-75k, 73.8% for AGIs $75k-100k, 345.0% for AGIs $100k-200k, 1670.0% for AGIs over 200k)
Net capital gain/loss in AGI: +$8,648 (reported on 16.4% of returns)
Here:
+$8,648
State:
+$44,925
(% of AGI for various income ranges: 12.0% for AGIs below $25k, 24.4% for AGIs $25k-50k, 65.4% for AGIs $50k-75k, 95.0% for AGIs $75k-100k, 397.2% for AGIs $100k-200k, 5573.3% for AGIs over 200k)
Profit/loss from business: +$11,380 (reported on 12.4% of returns)
Here:
+$11,380
State:
+$14,940
(% of AGI for various income ranges: 87.0% for AGIs below $25k, 57.3% for AGIs $25k-50k, 160.0% for AGIs $50k-75k, 126.2% for AGIs $75k-100k, 918.3% for AGIs $100k-200k)
Taxable individual retirement arrangement distribution: $19,358 (reported on 11.9% of returns)
13030:
$19,358
New York:
$19,609
(% of AGI for various income ranges: 111.5% for AGIs below $25k, 109.6% for AGIs $25k-50k, 197.5% for AGIs $50k-75k, 484.4% for AGIs $75k-100k, 1365.6% for AGIs $100k-200k)
Total itemized deductions: $27,083 (reported on 6.0% of returns)
Here:
$27,083
State:
$39,326
(% of AGI for various income ranges: 195.6% for AGIs $25k-50k, 400.6% for AGIs $75k-100k, 506.1% for AGIs $100k-200k, 2726.7% for AGIs over 200k)
Charity contributions: $4,611 (reported on 4.5% of returns)
Here:
$4,611
State:
$15,420
(% of AGI for various income ranges: 52.9% for AGIs $50k-75k, 160.0% for AGIs $100k-200k)
Taxes paid: $8,742 (reported on 6.0% of returns)
13030:
$8,742
State:
$9,183
(% of AGI for various income ranges: 64.0% for AGIs $25k-50k, 159.4% for AGIs $75k-100k, 166.7% for AGIs $100k-200k, 686.7% for AGIs over 200k)
Earned income credit: $1,891 (reported on 11.4% of returns)
Here:
$1,891
State:
$2,138
(% of AGI for various income ranges: 63.0% for AGIs below $25k, 40.7% for AGIs $25k-50k)
Percentage of individuals using paid preparers for their 2020 taxes: 96.5%
Here:
97%
State:
95%
(% for various income ranges: 94.5% for AGIs below $25k, 98.1% for AGIs $25k-50k, 97.1% for AGIs $50k-75k, 91.3% for AGIs $75k-100k, 100.0% for AGIs $100k-200k, 100.0% for AGIs over 200k)
Averages for the 2012 tax year for zip code 13030, filed in 2013:
Average Adjusted Gross Income (AGI) in 2012: $49,319 (Individual Income Tax Returns)
Here:
$49,319
State:
$77,088
Salary/wage: $41,692 (reported on 84.4% of returns)
Here:
$41,692
State:
$60,593
(% of AGI for various income ranges: 67.6% for AGIs below $25k, 76.6% for AGIs $25k-50k, 77.1% for AGIs $50k-75k, 78.2% for AGIs $75k-100k, 74.7% for AGIs $100k-200k, 38.4% for AGIs over 200k)
Taxable interest for individuals: $772 (reported on 40.5% of returns)
This zip code:
$772
New York:
$3,125
(% of AGI for various income ranges: 0.7% for AGIs below $25k, 0.5% for AGIs $25k-50k, 0.2% for AGIs $50k-75k, 0.4% for AGIs $75k-100k, 0.7% for AGIs $100k-200k, 1.7% for AGIs over 200k)
Ordinary dividends: $3,337 (reported on 20.0% of returns)
Here:
$3,337
State:
$10,299
(% of AGI for various income ranges: 0.9% for AGIs below $25k, 1.0% for AGIs $25k-50k, 0.5% for AGIs $50k-75k, 0.4% for AGIs $75k-100k, 1.3% for AGIs $100k-200k, 5.7% for AGIs over 200k)
Net capital gain/loss in AGI: +$4,136 (reported on 12.2% of returns)
Here:
+$4,136
State:
+$42,474
(% of AGI for various income ranges: 0.5% for AGIs $25k-50k, 0.1% for AGIs $50k-75k, 0.2% for AGIs $75k-100k, 4.2% for AGIs $100k-200k)
Profit/loss from business: +$9,580 (reported on 12.2% of returns)
Here:
+$9,580
State:
+$16,168
(% of AGI for various income ranges: 6.2% for AGIs below $25k, 2.6% for AGIs $25k-50k, 1.3% for AGIs $50k-75k, 3.1% for AGIs $75k-100k, 1.9% for AGIs $100k-200k)
Taxable individual retirement arrangement distribution: $12,704 (reported on 12.2% of returns)
13030:
$12,704
New York:
$17,621
(% of AGI for various income ranges: 3.7% for AGIs below $25k, 2.6% for AGIs $25k-50k, 2.1% for AGIs $50k-75k, 4.1% for AGIs $75k-100k, 5.1% for AGIs $100k-200k)
Total itemized deductions: $19,216 (21% of AGI, reported on 30.2% of returns)
Here:
$19,216
State:
$34,985
Here:
21.3% of AGI
State:
21.3% of AGI
(% of AGI for various income ranges: 8.0% for AGIs below $25k, 7.8% for AGIs $25k-50k, 9.8% for AGIs $50k-75k, 12.9% for AGIs $75k-100k, 16.0% for AGIs $100k-200k, 15.8% for AGIs over 200k)
Charity contributions: $2,244 (reported on 23.4% of returns)
Here:
$2,244
State:
$5,572
(% of AGI for various income ranges: 0.4% for AGIs below $25k, 0.6% for AGIs $25k-50k, 0.6% for AGIs $50k-75k, 1.0% for AGIs $75k-100k, 1.7% for AGIs $100k-200k, 2.2% for AGIs over 200k)
Taxes paid: $9,650 (reported on 30.2% of returns)
13030:
$9,650
State:
$18,656
(% of AGI for various income ranges: 2.8% for AGIs below $25k, 3.7% for AGIs $25k-50k, 4.4% for AGIs $50k-75k, 6.5% for AGIs $75k-100k, 9.1% for AGIs $100k-200k, 8.1% for AGIs over 200k)
Earned income credit: $1,987 (reported on 15.1% of returns)
Here:
$1,987
State:
$2,230
(% of AGI for various income ranges: 4.7% for AGIs below $25k, 0.7% for AGIs $25k-50k)
Percentage of individuals using paid preparers for their 2012 taxes: 52.2%
Here:
52%
State:
66%
(% for various income ranges: 44.3% for AGIs below $25k, 50.9% for AGIs $25k-50k, 59.4% for AGIs $50k-75k, 59.1% for AGIs $75k-100k, 68.8% for AGIs $100k-200k, 66.7% for AGIs over 200k)
Averages for the 2004 tax year for zip code 13030, filed in 2005:
Average Adjusted Gross Income (AGI) in 2004: $40,228 (Individual Income Tax Returns)
Here:
$40,228
State:
$59,519
Salary/wage: $36,815 (reported on 87.1% of returns)
Here:
$36,815
State:
$50,673
(% of AGI for various income ranges: 110.9% for AGIs below $10k, 75.4% for AGIs $10k-25k, 83.3% for AGIs $25k-50k, 82.4% for AGIs $50k-75k, 83.5% for AGIs $75k-100k, 69.7% for AGIs over 100k)
Taxable interest for individuals: $815 (reported on 52.3% of returns)
This zip code:
$815
New York:
$2,377
(% of AGI for various income ranges: 4.9% for AGIs below $10k, 1.3% for AGIs $10k-25k, 0.6% for AGIs $25k-50k, 0.9% for AGIs $50k-75k, 0.3% for AGIs $75k-100k, 1.8% for AGIs over 100k)
Taxable dividends: $1,652 (reported on 22.4% of returns)
Here:
$1,652
State:
$5,394
(% of AGI for various income ranges: 4.8% for AGIs below $10k, 0.8% for AGIs $10k-25k, 0.4% for AGIs $25k-50k, 0.5% for AGIs $50k-75k, 0.7% for AGIs $75k-100k, 1.9% for AGIs over 100k)
Net capital gain/loss: +$2,288 (reported on 14.5% of returns)
Here:
+$2,288
State:
+$23,581
(% of AGI for various income ranges: -2.0% for AGIs below $10k, 0.4% for AGIs $10k-25k, 0.0% for AGIs $25k-50k, 0.5% for AGIs $50k-75k, 0.7% for AGIs $75k-100k, 2.5% for AGIs over 100k)
Profit/loss from business: +$7,397 (reported on 11.6% of returns)
Here:
+$7,397
State:
+$13,809
(% of AGI for various income ranges: 11.2% for AGIs below $10k, 3.9% for AGIs $10k-25k, 3.0% for AGIs $25k-50k, 0.4% for AGIs $50k-75k, 2.0% for AGIs $75k-100k, 1.9% for AGIs over 100k)
IRA payment deduction: $2,723 (reported on 2.3% of returns)
13030:
$2,723
New York:
$3,115
Total itemized deductions: $15,247 (22% of AGI, reported on 34.7% of returns)
Here:
$15,247
State:
$25,864
Here:
21.9% of AGI
State:
21.9% of AGI
(% of AGI for various income ranges: 7.5% for AGIs below $10k, 7.9% for AGIs $10k-25k, 11.2% for AGIs $25k-50k, 12.9% for AGIs $50k-75k, 16.9% for AGIs $75k-100k, 15.9% for AGIs over 100k)
Charity contributions deductions: $2,059 (3% of AGI, reported on 31.2% of returns)
Here:
$2,059
State:
$4,439
Here:
2.9% of AGI
State:
3.6% of AGI
(% of AGI for various income ranges: 0.7% for AGIs $10k-25k, 1.2% for AGIs $25k-50k, 1.4% for AGIs $50k-75k, 1.8% for AGIs $75k-100k, 2.7% for AGIs over 100k)
Total tax: $4,974 (reported on 77.6% of returns)
13030:
$4,974
State:
$11,730
(% of AGI for various income ranges: 3.1% for AGIs below $10k, 4.2% for AGIs $10k-25k, 7.0% for AGIs $25k-50k, 9.0% for AGIs $50k-75k, 10.2% for AGIs $75k-100k, 16.0% for AGIs over 100k)
Earned income credit: $1,557 (reported on 12.2% of returns)
Here:
$1,557
State:
$1,757
Percentage of individuals using paid preparers for their 2004 taxes: 58.1%
Here:
58%
State:
67%
(% for various income ranges: 46.0% for AGIs below $10k, 55.6% for AGIs $10k-25k, 58.5% for AGIs $25k-50k, 63.0% for AGIs $50k-75k, 68.0% for AGIs $75k-100k, 75.8% for AGIs over 100k)
Household received Food Stamps/SNAP in the past 12 months: 164 Household did not receive Food Stamps/SNAP in the past 12 months: 1,395
Women who had a birth in the past 12 months: 61 (60 now married, 0 unmarried) Women who did not have a birth in the past 12 months: 687 (353 now married, 329 unmarried)
Housing units in zip code 13030 with a mortgage: 849 (112 second mortgage, 106 both second mortgage and home equity loan) Houses without a mortgage: 32
Median monthly owner costs for units with a mortgage: $1,396 Median monthly owner costs for units without a mortgage: $805
Residents with income below the poverty level in 2022:
This zip code:
7.9%
Whole state:
14.3%
Residents with income below 50% of the poverty level in 2022:
This zip code:
5.2%
Whole state:
6.8%
Median number of rooms in houses and condos:
Here:
6.0
State:
6.3
Median number of rooms in apartments:
Here:
4.2
State:
3.8
Notable locations in this zip code not listed on our city pages
Notable locations in zip code 13030: Anchorage Marina (A), Rogues' Roost Golf and Country Club (B), Bridgeport Fire Company (C). Display/hide their locations on the map
In group quarters: 16 (-1 institutionalized population)
Size of family households: 501 2-persons, 166 3-persons, 256 4-persons, 107 5-persons, 7 6-persons, 11 7-or-more-persons
Size of nonfamily households: 378 1-person, 116 2-persons, 25 4-persons
753 married couples with children.
92 single-parent households (13 men, 79 women).
93.8% of residents of 13030 zip code speak English at home.
2.2% of residents speak Spanish at home (93% very well, 5% well, 2% not well).
1.2% of residents speak other Indo-European language at home (100% very well).
0.7% of residents speak Asian or Pacific Island language at home (11% very well, 61% well, 18% not well, 11% not at all).
1.6% of residents speak other language at home (70% very well, 22% well, 8% not well).
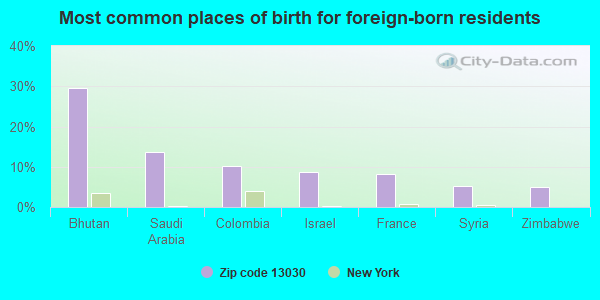
Foreign born population: 208 (5.3%) (77.9% of them are naturalized citizens)
This zip code:
5.3%
Whole state:
22.7%
30%Bhutan
14%Saudi Arabia
10%Colombia
9%Israel
8%France
5%Syria
5%Zimbabwe
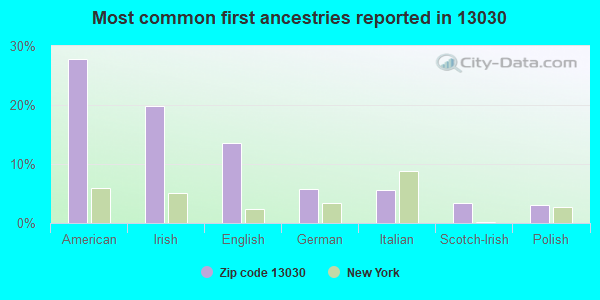
28%American
20%Irish
14%English
6%German
6%Italian
3%Scotch-Irish
3%Polish
Year of entry for the foreign-born population
442010 or later
32000 to 2009
701990 to 1999
88Before 1990
Facilities with environmental interests located in this zip code:
BRIDGEPORT ES (9076 NORTH RD in BRIDGEPORT, NY)
(National Center for Education Statistics) - STATE ID-251601060001 Organizations: CHITTENANGO CSD (SCHOOL DISTRICT)
BRIDGEPORT BODY SHOP (RT 31 AT CHITTENANGO CREEK in BRIDGEPORT, NY)
(Resource Conservation and Recovery Act (tracking hazardous waste)) Business NAICS classification: GENERAL AUTOMOTIVE REPAIR.
Housing units lacking complete plumbing facilities: 0.9% Housing units lacking complete kitchen facilities: 0.9%
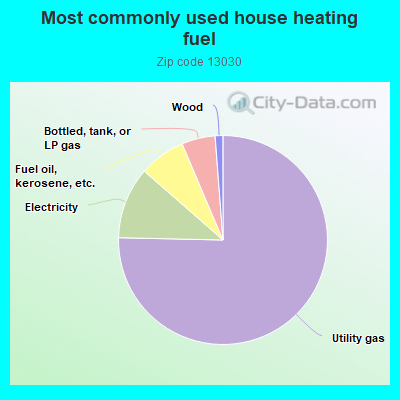
75.5%Utility gas
11.1%Electricity
7.2%Fuel oil, kerosene, etc.
5.2%Bottled, tank, or LP gas
1.2%Wood
Population in 1990: 4,507.
Place of birth for U.S.-born residents:
This state: 3,277
Northeast: 216
Midwest: 114
South: 80
West: 36
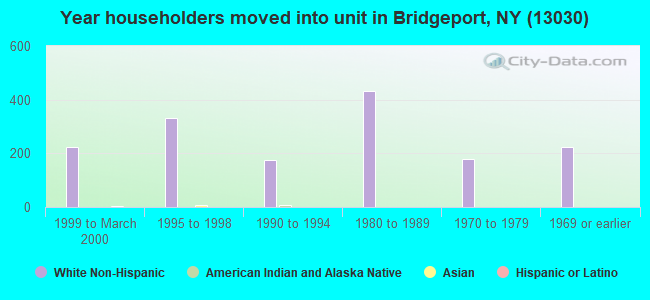
64% of the 13030 zip code residents lived in the same house 5 years ago. Out of people who lived in different houses, 41% lived in this county. Out of people who lived in different counties, 50% lived in New York.
95% of the 13030 zip code residents lived in the same house 1 year ago. Out of people who lived in different houses, 25% moved from this county. Out of people who lived in different houses, 50% moved from different county within same state. Out of people who lived in different houses, 25% moved from different state. Out of people who lived in different houses, 1% moved from abroad.
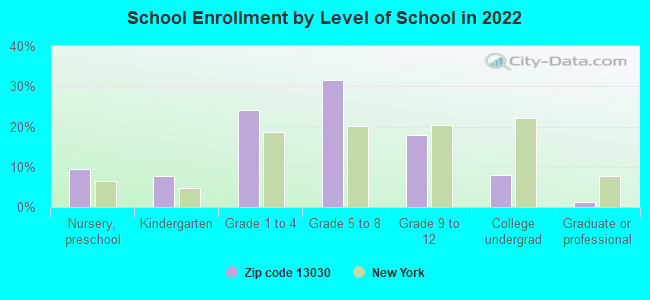
Private vs. public school enrollment:
Students in private schools in grades 1 to 8 (elementary and middle school): 42
Here:
7.6%
New York:
15.6%
Students in private schools in grades 9 to 12 (high school):
Here:
0.0%
New York:
15.0%
Students in private undergraduate colleges: 18
Here:
23.1%
New York:
39.2%
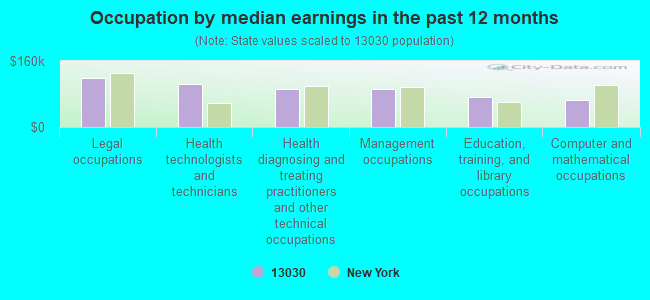
Occupation by median earnings in the past 12 months ($)
118,220Legal occupations
104,771Health technologists and technicians
91,689Health diagnosing and treating practitioners and other technical occupations
91,438Management occupations
73,464Education, training, and library occupations
65,823Computer and mathematical occupations
Top industries in this zip code by the number of employees in 2005:
Wholesale Trade: Farm and Garden Machinery and Equipment Merchant Wholesalers (20-49 employees: 1 establishment)
Accommodation and Food Services: Limited-Service Restaurants (5-9: 1, 1-4: 1)
Construction: Plumbing, Heating, and Air-Conditioning Contractors (5-9: 1, 1-4: 1)
Other Services (except Public Administration): Religious Organizations (5-9: 1, 1-4: 1)
Professional, Scientific, and Technical Services: Offices of Lawyers (5-9: 1)
People in group quarters in 2000:
3 people in college dormitories (includes college quarters off campus)
Fatal accident statistics in 2014:
Fatal accident count: 1
Vehicles involved in fatal accidents: 1
Fatal accidents caused by drunken drivers: 0
Fatalities: 1
Persons involved in fatal accidents: 3
Pedestrians involved in fatal accidents: 1
Fatal accident statistics in 2010:
Fatal accident count: 2
Vehicles involved in fatal accidents: 3
Fatal accidents caused by drunken drivers: 2
Fatalities: 2
Persons involved in fatal accidents: 4
Pedestrians involved in fatal accidents: 0
Home Mortgage Disclosure Act Aggregated Statistics For Year 2009 (Based on 6 partial tracts)
A) FHA, FSA/RHS & VA Home Purchase Loans
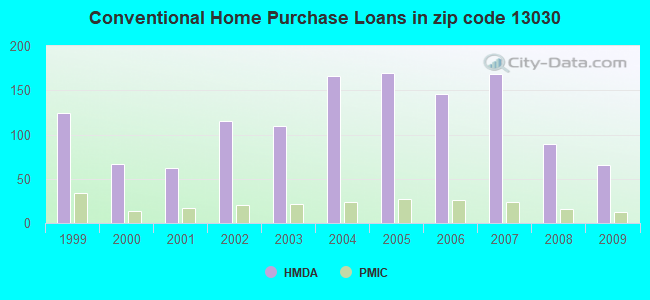
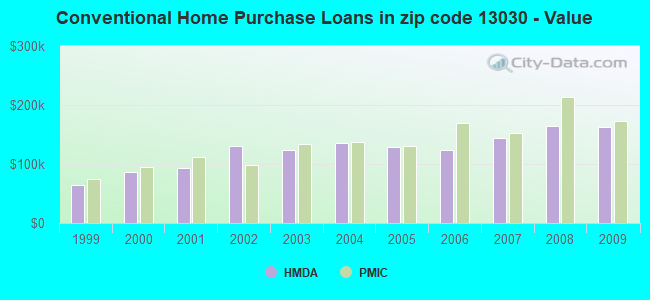
B) Conventional Home Purchase Loans
C) Refinancings
D) Home Improvement Loans
F) Non-occupant Loans on < 5 Family Dwellings (A B C & D)
G) Loans On Manufactured Home Dwelling (A B C & D)
Number
Average Value
Number
Average Value
Number
Average Value
Number
Average Value
Number
Average Value
Number
Average Value
LOANS ORIGINATED
44
$147,195
65
$163,012
154
$152,800
29
$23,043
4
$144,120
4
$59,640
APPLICATIONS APPROVED, NOT ACCEPTED
2
$207,250
6
$191,360
19
$167,462
1
$180,800
0
$0
1
$52,130
APPLICATIONS DENIED
1
$124,420
10
$95,046
47
$136,539
14
$34,390
0
$0
3
$41,267
APPLICATIONS WITHDRAWN
5
$128,038
2
$117,525
46
$140,353
6
$115,515
2
$139,265
2
$102,265
FILES CLOSED FOR INCOMPLETENESS
0
$0
2
$64,035
7
$188,859
2
$22,335
0
$0
0
$0
Aggregated Statistics For Year 2008 (Based on 6 partial tracts)
A) FHA, FSA/RHS & VA Home Purchase Loans
B) Conventional Home Purchase Loans
C) Refinancings
D) Home Improvement Loans
E) Loans on Dwellings For 5+ Families
F) Non-occupant Loans on < 5 Family Dwellings (A B C & D)
G) Loans On Manufactured Home Dwelling (A B C & D)
Number
Average Value
Number
Average Value
Number
Average Value
Number
Average Value
Number
Average Value
Number
Average Value
Number
Average Value
LOANS ORIGINATED
33
$129,591
89
$165,009
94
$124,878
45
$36,334
1
$2,303,200
7
$108,486
4
$68,508
APPLICATIONS APPROVED, NOT ACCEPTED
2
$157,000
17
$149,026
18
$107,621
5
$22,928
0
$0
0
$0
2
$57,710
APPLICATIONS DENIED
3
$167,090
21
$128,949
62
$122,829
48
$22,167
0
$0
3
$105,620
7
$58,444
APPLICATIONS WITHDRAWN
4
$155,702
9
$150,021
33
$118,562
5
$81,454
0
$0
0
$0
1
$58,640
FILES CLOSED FOR INCOMPLETENESS
0
$0
2
$141,100
12
$170,690
4
$32,242
0
$0
0
$0
1
$70,590
Aggregated Statistics For Year 2007 (Based on 6 partial tracts)
A) FHA, FSA/RHS & VA Home Purchase Loans
B) Conventional Home Purchase Loans
C) Refinancings
D) Home Improvement Loans
F) Non-occupant Loans on < 5 Family Dwellings (A B C & D)
G) Loans On Manufactured Home Dwelling (A B C & D)
Number
Average Value
Number
Average Value
Number
Average Value
Number
Average Value
Number
Average Value
Number
Average Value
LOANS ORIGINATED
22
$99,915
168
$144,897
95
$100,801
58
$39,236
9
$103,260
7
$48,450
APPLICATIONS APPROVED, NOT ACCEPTED
0
$0
23
$136,117
21
$111,509
17
$30,863
3
$103,660
2
$39,460
APPLICATIONS DENIED
1
$99,040
16
$116,804
110
$124,440
52
$39,471
6
$87,347
8
$65,275
APPLICATIONS WITHDRAWN
2
$84,250
15
$120,460
56
$120,536
12
$65,221
7
$133,241
1
$19,910
FILES CLOSED FOR INCOMPLETENESS
0
$0
2
$248,415
7
$150,467
1
$21,720
0
$0
0
$0
Aggregated Statistics For Year 2006 (Based on 6 partial tracts)
A) FHA, FSA/RHS & VA Home Purchase Loans
B) Conventional Home Purchase Loans
C) Refinancings
D) Home Improvement Loans
F) Non-occupant Loans on < 5 Family Dwellings (A B C & D)
G) Loans On Manufactured Home Dwelling (A B C & D)
Number
Average Value
Number
Average Value
Number
Average Value
Number
Average Value
Number
Average Value
Number
Average Value
LOANS ORIGINATED
26
$96,707
146
$124,362
99
$100,210
59
$32,389
16
$89,749
6
$50,657
APPLICATIONS APPROVED, NOT ACCEPTED
0
$0
11
$71,245
18
$87,627
12
$23,194
3
$49,067
4
$55,575
APPLICATIONS DENIED
5
$75,882
24
$97,540
99
$107,939
52
$39,166
3
$69,650
7
$45,664
APPLICATIONS WITHDRAWN
3
$65,893
8
$145,025
67
$97,305
12
$44,637
5
$110,040
1
$53,940
FILES CLOSED FOR INCOMPLETENESS
0
$0
6
$162,615
16
$118,918
0
$0
1
$154,750
0
$0
Aggregated Statistics For Year 2005 (Based on 6 partial tracts)
A) FHA, FSA/RHS & VA Home Purchase Loans
B) Conventional Home Purchase Loans
C) Refinancings
D) Home Improvement Loans
F) Non-occupant Loans on < 5 Family Dwellings (A B C & D)
G) Loans On Manufactured Home Dwelling (A B C & D)
Number
Average Value
Number
Average Value
Number
Average Value
Number
Average Value
Number
Average Value
Number
Average Value
LOANS ORIGINATED
23
$98,457
169
$128,083
104
$95,689
60
$34,810
19
$82,256
7
$67,896
APPLICATIONS APPROVED, NOT ACCEPTED
2
$118,355
17
$99,861
26
$91,903
8
$47,451
2
$47,385
1
$70,950
APPLICATIONS DENIED
2
$70,680
12
$70,523
100
$91,246
53
$32,088
3
$156,853
6
$36,452
APPLICATIONS WITHDRAWN
2
$64,955
16
$130,205
79
$101,663
9
$110,208
5
$78,002
6
$80,428
FILES CLOSED FOR INCOMPLETENESS
0
$0
11
$97,863
22
$136,777
3
$39,810
0
$0
0
$0
Aggregated Statistics For Year 2004 (Based on 6 partial tracts)
A) FHA, FSA/RHS & VA Home Purchase Loans
B) Conventional Home Purchase Loans
C) Refinancings
D) Home Improvement Loans
F) Non-occupant Loans on < 5 Family Dwellings (A B C & D)
G) Loans On Manufactured Home Dwelling (A B C & D)
Number
Average Value
Number
Average Value
Number
Average Value
Number
Average Value
Number
Average Value
Number
Average Value
LOANS ORIGINATED
27
$88,961
166
$136,150
110
$92,509
45
$30,234
16
$71,971
5
$32,798
APPLICATIONS APPROVED, NOT ACCEPTED
3
$96,257
17
$94,132
26
$87,066
7
$54,219
1
$85,070
6
$40,467
APPLICATIONS DENIED
3
$85,917
24
$81,221
82
$77,939
29
$22,527
2
$64,615
11
$38,796
APPLICATIONS WITHDRAWN
2
$66,500
11
$123,118
65
$74,360
8
$55,572
1
$41,630
1
$111,130
FILES CLOSED FOR INCOMPLETENESS
0
$0
3
$109,577
22
$87,561
2
$24,825
0
$0
0
$0
Aggregated Statistics For Year 2003 (Based on 6 partial tracts)
A) FHA, FSA/RHS & VA Home Purchase Loans
B) Conventional Home Purchase Loans
C) Refinancings
D) Home Improvement Loans
E) Loans on Dwellings For 5+ Families
F) Non-occupant Loans on < 5 Family Dwellings (A B C & D)
Number
Average Value
Number
Average Value
Number
Average Value
Number
Average Value
Number
Average Value
Number
Average Value
LOANS ORIGINATED
32
$76,226
110
$124,026
204
$88,632
26
$15,277
1
$1,566,180
12
$72,108
APPLICATIONS APPROVED, NOT ACCEPTED
1
$55,190
13
$134,837
34
$85,116
7
$17,929
0
$0
0
$0
APPLICATIONS DENIED
0
$0
22
$50,324
97
$77,275
32
$25,468
0
$0
5
$72,074
APPLICATIONS WITHDRAWN
0
$0
5
$131,214
50
$80,070
2
$4,805
0
$0
0
$0
FILES CLOSED FOR INCOMPLETENESS
0
$0
3
$67,527
10
$100,959
1
$57,580
0
$0
0
$0
Aggregated Statistics For Year 2002 (Based on 6 partial tracts)
A) FHA, FSA/RHS & VA Home Purchase Loans
B) Conventional Home Purchase Loans
C) Refinancings
D) Home Improvement Loans
E) Loans on Dwellings For 5+ Families
F) Non-occupant Loans on < 5 Family Dwellings (A B C & D)
Number
Average Value
Number
Average Value
Number
Average Value
Number
Average Value
Number
Average Value
Number
Average Value
LOANS ORIGINATED
37
$70,745
115
$130,750
124
$79,090
30
$18,300
1
$345,480
7
$46,676
APPLICATIONS APPROVED, NOT ACCEPTED
1
$76,010
11
$153,644
25
$75,484
9
$21,373
0
$0
3
$29,360
APPLICATIONS DENIED
3
$60,073
15
$86,049
83
$73,542
25
$15,854
0
$0
1
$27,310
APPLICATIONS WITHDRAWN
4
$97,782
6
$107,473
57
$74,217
8
$33,270
0
$0
0
$0
FILES CLOSED FOR INCOMPLETENESS
0
$0
1
$51,120
17
$85,976
0
$0
0
$0
0
$0
Aggregated Statistics For Year 2001 (Based on 6 partial tracts)
A) FHA, FSA/RHS & VA Home Purchase Loans
B) Conventional Home Purchase Loans
C) Refinancings
D) Home Improvement Loans
F) Non-occupant Loans on < 5 Family Dwellings (A B C & D)
Number
Average Value
Number
Average Value
Number
Average Value
Number
Average Value
Number
Average Value
LOANS ORIGINATED
37
$65,811
62
$93,700
109
$80,337
30
$23,639
6
$58,273
APPLICATIONS APPROVED, NOT ACCEPTED
0
$0
16
$86,761
17
$51,061
3
$19,857
1
$52,850
APPLICATIONS DENIED
2
$66,565
26
$58,172
63
$60,720
32
$13,741
4
$54,492
APPLICATIONS WITHDRAWN
0
$0
6
$78,947
63
$62,326
2
$24,940
3
$64,037
FILES CLOSED FOR INCOMPLETENESS
1
$51,820
0
$0
10
$79,898
0
$0
0
$0
Aggregated Statistics For Year 2000 (Based on 6 partial tracts)
A) FHA, FSA/RHS & VA Home Purchase Loans
B) Conventional Home Purchase Loans
C) Refinancings
D) Home Improvement Loans
F) Non-occupant Loans on < 5 Family Dwellings (A B C & D)
Number
Average Value
Number
Average Value
Number
Average Value
Number
Average Value
Number
Average Value
LOANS ORIGINATED
35
$72,491
67
$86,967
34
$63,322
43
$14,727
8
$84,961
APPLICATIONS APPROVED, NOT ACCEPTED
2
$84,145
13
$47,412
18
$61,753
10
$19,150
2
$103,335
APPLICATIONS DENIED
2
$25,040
28
$37,530
49
$63,311
34
$16,543
3
$37,407
APPLICATIONS WITHDRAWN
1
$102,490
6
$88,970
28
$51,086
4
$30,988
1
$85,670
FILES CLOSED FOR INCOMPLETENESS
0
$0
0
$0
14
$62,194
0
$0
2
$27,555
Aggregated Statistics For Year 1999 (Based on 1 full and 4 partial tracts)
A) FHA, FSA/RHS & VA Home Purchase Loans
B) Conventional Home Purchase Loans
C) Refinancings
D) Home Improvement Loans
F) Non-occupant Loans on < 5 Family Dwellings (A B C & D)
2002 - 2018 National Fire Incident Reporting System (NFIRS) incidents
According to the data from the years 2002 - 2018 the average number of fire incidents per year is 24. The highest number of reported fire incidents - 39 took place in 2007, and the least - 10 in 2013. The data has a rising trend.
When looking into fire subcategories, the most reports belonged to: Structure Fires (43.3%), and Outside Fires (41.8%).
Fire incident types reported to NFIRS in Zip Code 13030


 Nearest zip codes: 13082, 13116, 13057, 13039, 13066, 13037.


 According to the data from the years 2002 - 2018 the average number of fire incidents per year is 24. The highest number of reported fire incidents - 39 took place in 2007, and the least - 10 in 2013. The data has a rising trend.
 When looking into fire subcategories, the most reports belonged to: Structure Fires (43.3%), and Outside Fires (41.8%).