Estimated zip code population in 2022: 4,266 Zip code population in 2010: 4,488 Zip code population in 2000: 4,915
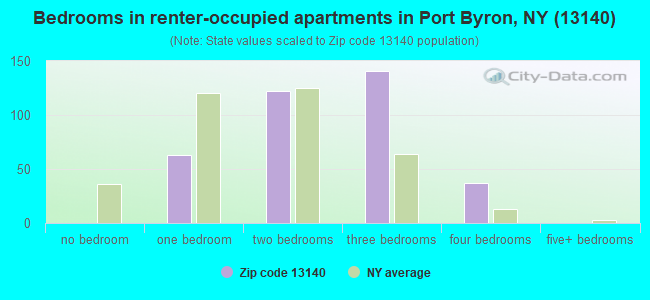
Houses and condos: 1,944 Renter-occupied apartments: 365
% of renters here:
21%
State:
46%
March 2022 cost of living index in zip code 13140: 94.5 (less than average, U.S. average is 100)
Land area: 52.3 sq. mi. Water area: 1.6 sq. mi.
Population density: 82 people per square mile
(very low).
OSM Map
General Map
Google Map
MSN Map
OSM Map
General Map
Google Map
MSN Map
OSM Map
General Map
Google Map
MSN Map
OSM Map
General Map
Google Map
MSN Map
Please wait while loading the map...
Real estate property taxes paid for housing units in 2022:
This zip code:
2.2% ($2,574)
New York:
1.5% ($6,180)
Median real estate property taxes paid for housing units with mortgages in 2022: $3,377 (2.1%) Median real estate property taxes paid for housing units with no mortgage in 2022: $1,895 (2.0%)
Business Search- 14 Million verified businesses
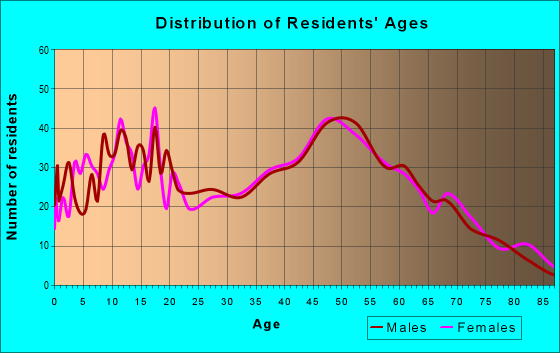
Males: 2,102
(49.3%)
Females: 2,163
(50.7%)
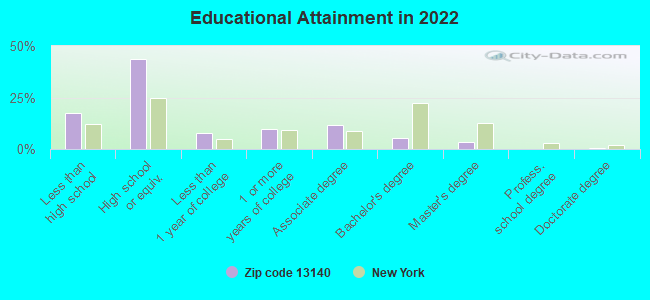
For population 25 years and over in 13140:
High school or higher: 81.0%
Bachelor's degree or higher: 9.1%
Graduate or professional degree: 3.7%
Unemployed: 3.0%
Mean travel time to work (commute): 26.8 minutes
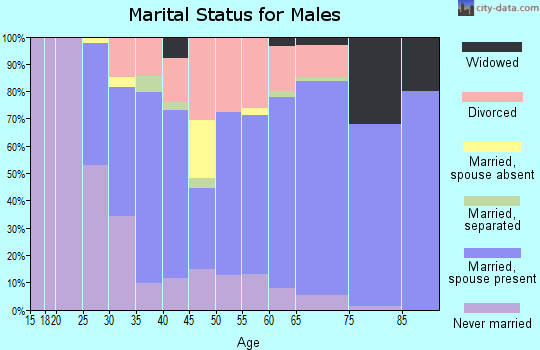
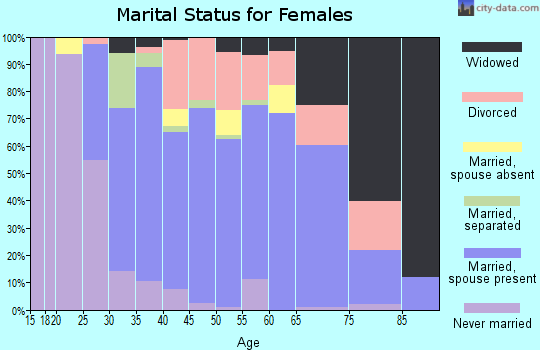
For population 15 years and over in 13140:
Never married: 31.5%
Now married: 46.4%
Separated: 2.7%
Widowed: 12.0%
Divorced: 7.4%
Zip code 13140 compared to state average:
Median house value significantly below state average.
Unemployed percentage below state average.
Black race population percentage significantly below state average.
Hispanic race population percentage significantly below state average.
Median age above state average.
Foreign-born population percentage significantly below state average.
Renting percentage below state average.
Length of stay since moving in significantly above state average.
Number of rooms per house above state average.
Number of college students below state average.
Percentage of population with a bachelor's degree or higher significantly below state average.
Averages for the 2020 tax year for zip code 13140, filed in 2021:
Average Adjusted Gross Income (AGI) in 2020: $49,895 (Individual Income Tax Returns)
Here:
$49,895
State:
$90,930
Salary/wage: $43,688 (reported on 81.9% of returns)
Here:
$43,688
State:
$72,104
(% of AGI for various income ranges: 1109.1% for AGIs below $25k, 3205.8% for AGIs $25k-50k, 5872.7% for AGIs $50k-75k, 9270.7% for AGIs $75k-100k, 17457.7% for AGIs $100k-200k)
Taxable interest for individuals: $631 (reported on 32.2% of returns)
This zip code:
$631
New York:
$3,075
(% of AGI for various income ranges: 14.8% for AGIs below $25k, 11.7% for AGIs $25k-50k, 43.1% for AGIs $50k-75k, 62.1% for AGIs $75k-100k, 64.6% for AGIs $100k-200k)
Ordinary dividends: $1,504 (reported on 13.6% of returns)
Here:
$1,504
State:
$11,095
(% of AGI for various income ranges: 11.8% for AGIs below $25k, 23.1% for AGIs $25k-50k, 23.1% for AGIs $50k-75k, 44.3% for AGIs $75k-100k, 93.1% for AGIs $100k-200k)
Net capital gain/loss in AGI: +$6,200 (reported on 9.5% of returns)
Here:
+$6,200
State:
+$44,925
(% of AGI for various income ranges: 10.7% for AGIs below $25k, 17.3% for AGIs $25k-50k, 71.9% for AGIs $50k-75k, 128.6% for AGIs $75k-100k, 523.8% for AGIs $100k-200k)
Profit/loss from business: +$8,981 (reported on 10.6% of returns)
Here:
+$8,981
State:
+$14,940
(% of AGI for various income ranges: 91.1% for AGIs below $25k, 75.4% for AGIs $25k-50k, 228.1% for AGIs $50k-75k, 407.7% for AGIs $100k-200k)
Taxable individual retirement arrangement distribution: $11,253 (reported on 8.5% of returns)
13140:
$11,253
New York:
$19,609
(% of AGI for various income ranges: 94.8% for AGIs below $25k, 40.6% for AGIs $25k-50k, 143.5% for AGIs $50k-75k, 290.7% for AGIs $75k-100k, 400.8% for AGIs $100k-200k)
Total itemized deductions: $19,440 (reported on 2.5% of returns)
Here:
$19,440
State:
$39,326
(% of AGI for various income ranges: 694.3% for AGIs $75k-100k)
Charity contributions: $4,467 (reported on 1.5% of returns)
Here:
$4,467
State:
$15,420
(% of AGI for various income ranges: 51.5% for AGIs $50k-75k)
Taxes paid: $6,660 (reported on 2.5% of returns)
13140:
$6,660
State:
$9,183
(% of AGI for various income ranges: 237.9% for AGIs $75k-100k)
Earned income credit: $1,983 (reported on 17.6% of returns)
Here:
$1,983
State:
$2,138
(% of AGI for various income ranges: 75.9% for AGIs below $25k, 75.0% for AGIs $25k-50k)
Percentage of individuals using paid preparers for their 2020 taxes: 96.0%
Here:
96%
State:
95%
(% for various income ranges: 95.2% for AGIs below $25k, 96.6% for AGIs $25k-50k, 100.0% for AGIs $50k-75k, 90.5% for AGIs $75k-100k, 95.0% for AGIs $100k-200k, 100.0% for AGIs over 200k)
Averages for the 2012 tax year for zip code 13140, filed in 2013:
Average Adjusted Gross Income (AGI) in 2012: $39,940 (Individual Income Tax Returns)
Here:
$39,940
State:
$77,088
Salary/wage: $35,827 (reported on 85.4% of returns)
Here:
$35,827
State:
$60,593
(% of AGI for various income ranges: 72.3% for AGIs below $25k, 80.5% for AGIs $25k-50k, 81.2% for AGIs $50k-75k, 78.5% for AGIs $75k-100k, 67.8% for AGIs $100k-200k)
Taxable interest for individuals: $518 (reported on 30.2% of returns)
This zip code:
$518
New York:
$3,125
(% of AGI for various income ranges: 0.6% for AGIs below $25k, 0.5% for AGIs $25k-50k, 0.2% for AGIs $50k-75k, 0.5% for AGIs $75k-100k, 0.3% for AGIs $100k-200k)
Ordinary dividends: $1,022 (reported on 13.6% of returns)
Here:
$1,022
State:
$10,299
(% of AGI for various income ranges: 0.7% for AGIs below $25k, 0.3% for AGIs $25k-50k, 0.2% for AGIs $50k-75k, 0.2% for AGIs $75k-100k, 0.4% for AGIs $100k-200k)
Net capital gain/loss in AGI: +$6,738 (reported on 8.0% of returns)
Here:
+$6,738
State:
+$42,474
(% of AGI for various income ranges: 0.4% for AGIs below $25k, 0.4% for AGIs $25k-50k, 0.1% for AGIs $50k-75k, 1.8% for AGIs $75k-100k, 4.1% for AGIs $100k-200k)
Profit/loss from business: +$7,800 (reported on 11.6% of returns)
Here:
+$7,800
State:
+$16,168
(% of AGI for various income ranges: 4.5% for AGIs below $25k, 1.3% for AGIs $25k-50k, 1.3% for AGIs $50k-75k, 2.5% for AGIs $75k-100k, 2.7% for AGIs $100k-200k)
Taxable individual retirement arrangement distribution: $8,462 (reported on 8.0% of returns)
13140:
$8,462
New York:
$17,621
(% of AGI for various income ranges: 2.9% for AGIs below $25k, 1.5% for AGIs $25k-50k, 1.8% for AGIs $50k-75k, 2.7% for AGIs $75k-100k)
Total itemized deductions: $16,195 (20% of AGI, reported on 18.6% of returns)
Here:
$16,195
State:
$34,985
Here:
20.3% of AGI
State:
21.3% of AGI
(% of AGI for various income ranges: 2.1% for AGIs below $25k, 5.6% for AGIs $25k-50k, 8.1% for AGIs $50k-75k, 9.2% for AGIs $75k-100k, 11.3% for AGIs $100k-200k)
Charity contributions: $2,083 (reported on 14.6% of returns)
Here:
$2,083
State:
$5,572
(% of AGI for various income ranges: 0.5% for AGIs $25k-50k, 1.0% for AGIs $50k-75k, 0.8% for AGIs $75k-100k, 1.3% for AGIs $100k-200k)
Taxes paid: $7,368 (reported on 18.6% of returns)
13140:
$7,368
State:
$18,656
(% of AGI for various income ranges: 0.6% for AGIs below $25k, 2.1% for AGIs $25k-50k, 3.3% for AGIs $50k-75k, 4.4% for AGIs $75k-100k, 6.1% for AGIs $100k-200k)
Earned income credit: $2,091 (reported on 22.6% of returns)
Here:
$2,091
State:
$2,230
(% of AGI for various income ranges: 6.6% for AGIs below $25k, 1.2% for AGIs $25k-50k)
Percentage of individuals using paid preparers for their 2012 taxes: 56.8%
Here:
57%
State:
66%
(% for various income ranges: 52.9% for AGIs below $25k, 53.7% for AGIs $25k-50k, 60.7% for AGIs $50k-75k, 68.4% for AGIs $75k-100k, 72.7% for AGIs $100k-200k)
Averages for the 2004 tax year for zip code 13140, filed in 2005:
Average Adjusted Gross Income (AGI) in 2004: $32,660 (Individual Income Tax Returns)
Here:
$32,660
State:
$59,519
Salary/wage: $29,969 (reported on 87.9% of returns)
Here:
$29,969
State:
$50,673
(% of AGI for various income ranges: 102.2% for AGIs below $10k, 73.2% for AGIs $10k-25k, 85.5% for AGIs $25k-50k, 87.0% for AGIs $50k-75k, 81.5% for AGIs $75k-100k, 53.5% for AGIs over 100k)
Taxable interest for individuals: $635 (reported on 38.5% of returns)
This zip code:
$635
New York:
$2,377
(% of AGI for various income ranges: 1.9% for AGIs below $10k, 1.2% for AGIs $10k-25k, 0.7% for AGIs $25k-50k, 0.6% for AGIs $50k-75k, 0.4% for AGIs $75k-100k, 0.6% for AGIs over 100k)
Taxable dividends: $814 (reported on 17.3% of returns)
Here:
$814
State:
$5,394
(% of AGI for various income ranges: 0.9% for AGIs below $10k, 0.8% for AGIs $10k-25k, 0.5% for AGIs $25k-50k, 0.2% for AGIs $50k-75k, 0.3% for AGIs $75k-100k, 0.3% for AGIs over 100k)
Net capital gain/loss: +$3,416 (reported on 10.5% of returns)
Here:
+$3,416
State:
+$23,581
(% of AGI for various income ranges: 0.5% for AGIs below $10k, 0.7% for AGIs $10k-25k, 0.3% for AGIs $25k-50k, 1.1% for AGIs $50k-75k, 1.8% for AGIs $75k-100k, 3.2% for AGIs over 100k)
Profit/loss from business: +$9,394 (reported on 11.1% of returns)
Here:
+$9,394
State:
+$13,809
(% of AGI for various income ranges: 6.7% for AGIs below $10k, 3.7% for AGIs $10k-25k, 2.7% for AGIs $25k-50k, 0.6% for AGIs $50k-75k, 0.3% for AGIs $75k-100k, 13.4% for AGIs over 100k)
IRA payment deduction: $2,000 (reported on 1.9% of returns)
13140:
$2,000
New York:
$3,115
Total itemized deductions: $13,181 (22% of AGI, reported on 20.3% of returns)
Here:
$13,181
State:
$25,864
Here:
21.7% of AGI
State:
21.9% of AGI
(% of AGI for various income ranges: 6.2% for AGIs below $10k, 5.4% for AGIs $10k-25k, 6.0% for AGIs $25k-50k, 9.5% for AGIs $50k-75k, 12.4% for AGIs $75k-100k, 10.3% for AGIs over 100k)
Charity contributions deductions: $1,591 (2% of AGI, reported on 17.1% of returns)
Here:
$1,591
State:
$4,439
Here:
2.5% of AGI
State:
3.6% of AGI
(% of AGI for various income ranges: 0.5% for AGIs $10k-25k, 0.5% for AGIs $25k-50k, 1.0% for AGIs $50k-75k, 1.5% for AGIs $75k-100k, 1.2% for AGIs over 100k)
Total tax: $3,654 (reported on 72.4% of returns)
13140:
$3,654
State:
$11,730
(% of AGI for various income ranges: 2.5% for AGIs below $10k, 3.6% for AGIs $10k-25k, 6.4% for AGIs $25k-50k, 8.3% for AGIs $50k-75k, 10.4% for AGIs $75k-100k, 17.5% for AGIs over 100k)
Earned income credit: $1,682 (reported on 20.5% of returns)
Here:
$1,682
State:
$1,757
Percentage of individuals using paid preparers for their 2004 taxes: 60.7%
Here:
61%
State:
67%
(% for various income ranges: 46.6% for AGIs below $10k, 67.3% for AGIs $10k-25k, 58.6% for AGIs $25k-50k, 69.1% for AGIs $50k-75k, 64.4% for AGIs $75k-100k, 78.0% for AGIs over 100k)
Likely homosexual households (counted as self-reported same-sex unmarried-partner households)
Lesbian couples: 0.0% of all households
Gay men: 0.2% of all households
Household received Food Stamps/SNAP in the past 12 months: 256 Household did not receive Food Stamps/SNAP in the past 12 months: 1,468
Women who had a birth in the past 12 months: 43 (35 now married, 8 unmarried) Women who did not have a birth in the past 12 months: 837 (280 now married, 558 unmarried)
Housing units in zip code 13140 with a mortgage: 623 (74 second mortgage, 72 both second mortgage and home equity loan) Houses without a mortgage: 31
Median monthly owner costs for units with a mortgage: $1,325 Median monthly owner costs for units without a mortgage: $549
Residents with income below the poverty level in 2022:
This zip code:
14.4%
Whole state:
14.3%
Residents with income below 50% of the poverty level in 2022:
This zip code:
4.5%
Whole state:
6.8%
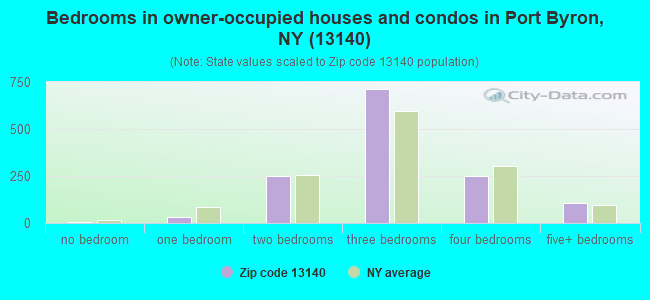
Median number of rooms in houses and condos:
Here:
6.3
State:
6.3
Median number of rooms in apartments:
Here:
5.2
State:
3.8
Notable locations in this zip code not listed on our city pages
Notable locations in zip code 13140: Mills Dairy Farm (A), High Bridge (B), Montezuma Station (C), Cottage Corners (D), Guidone Farms (E), Miller Farms (F), Port Byron Library (G), Conquest Fire Company (H). Display/hide their locations on the map
Cemeteries: Mount Pleasant Cemetery (1), Spring Lake Cemetery (2), Conquest Village Cemetery (3), McCloud Cemetery (4), Salt Road Cemetery (5), Stevens Family Cemetery (6), Wethy Family Cemetery (7). Display/hide their locations on the map
In group quarters: 19 (-1 institutionalized population)
Size of family households: 580 2-persons, 192 3-persons, 180 4-persons, 143 5-persons, 12 6-persons, 23 7-or-more-persons
Size of nonfamily households: 453 1-person, 120 2-persons, 20 3-persons
451 married couples with children.
339 single-parent households (143 men, 196 women).
98.7% of residents of 13140 zip code speak English at home.
0.9% of residents speak Spanish at home (50% very well, 25% well, 17% not well, 8% not at all).
0.3% of residents speak other Indo-European language at home (91% very well, 9% not at all).
0.1% of residents speak other language at home (100% well).
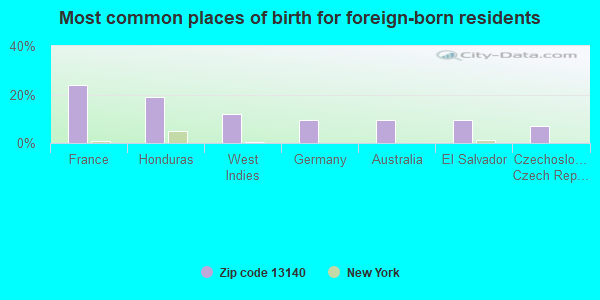
Foreign born population: 42 (1.0%) (52.5% of them are naturalized citizens)
This zip code:
1.0%
Whole state:
22.7%
24%France
19%Honduras
12%West Indies
10%Germany
10%Australia
10%El Salvador
7%Czechoslovakia (includes Czech Republic and Slovakia)
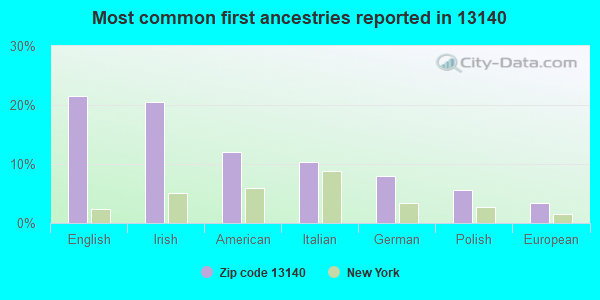
22%English
20%Irish
12%American
10%Italian
8%German
6%Polish
3%European
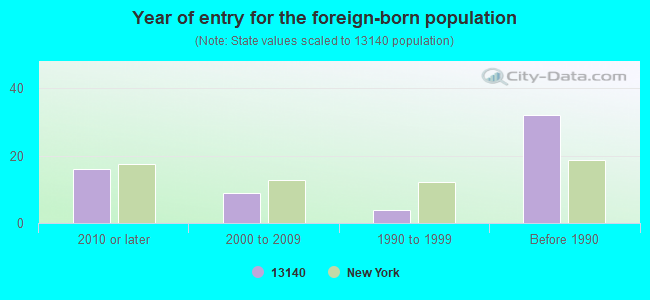
Year of entry for the foreign-born population
162010 or later
92000 to 2009
41990 to 1999
32Before 1990
Facilities with environmental interests located in this zip code:
A.A. GATES ES (30 MAPLE AVE in PORT BYRON, NY)
(National Center for Education Statistics) - STATE ID-051101040001 Organizations: PORT BYRON CSD (SCHOOL DISTRICT)
ALLEN DIERKSEN (758 HOWELL ROAD in PORT BYRON, NY)
ENFORCEMENT/COMPLIANCE ACTIVITY (Integrated Compliance Information System)
CONQUEST AUTO SALES (10175 STATE ROUTE 38 in PORT BYRON, NY)
ENFORCEMENT/COMPLIANCE ACTIVITY (Integrated Compliance Information System)
Housing units lacking complete plumbing facilities: 4.2% Housing units lacking complete kitchen facilities: 3.1%
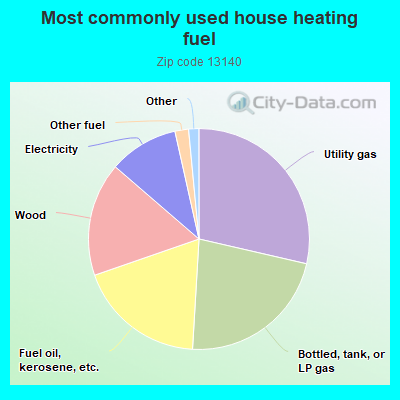
28.7%Utility gas
22.4%Bottled, tank, or LP gas
18.8%Fuel oil, kerosene, etc.
16.7%Wood
10.2%Electricity
2.0%Other fuel
0.9%Coal or coke
0.5%No fuel used
Population in 1990: 4,391. Population change in the 1990s: +524 (+11.9%).
Place of birth for U.S.-born residents:
This state: 3,835
Northeast: 142
Midwest: 31
South: 124
West: 53
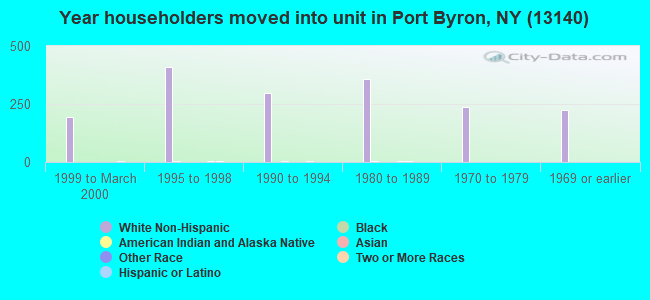
70% of the 13140 zip code residents lived in the same house 5 years ago. Out of people who lived in different houses, 75% lived in this county. Out of people who lived in different counties, 50% lived in New York.
92% of the 13140 zip code residents lived in the same house 1 year ago. Out of people who lived in different houses, 75% moved from this county. Out of people who lived in different houses, 14% moved from different county within same state. Out of people who lived in different houses, 7% moved from different state. Out of people who lived in different houses, 1% moved from abroad.
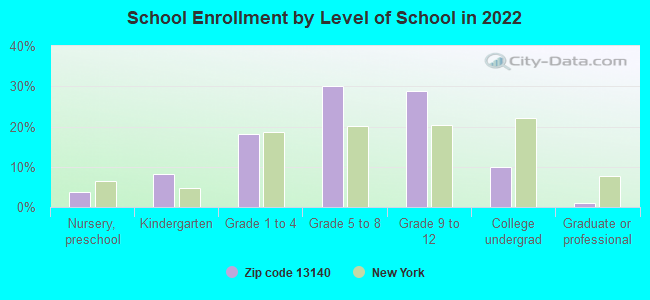
Private vs. public school enrollment:
Students in private schools in grades 1 to 8 (elementary and middle school): 78
Here:
18.6%
New York:
15.6%
Students in private schools in grades 9 to 12 (high school):
Here:
0.0%
New York:
15.0%
Students in private undergraduate colleges: 12
Here:
14.7%
New York:
39.2%
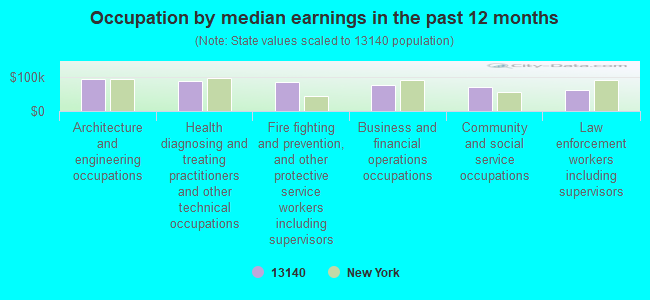
Occupation by median earnings in the past 12 months ($)
96,052Architecture and engineering occupations
88,534Health diagnosing and treating practitioners and other technical occupations
85,923Fire fighting and prevention, and other protective service workers including supervisors
76,251Business and financial operations occupations
72,258Community and social service occupations
63,565Law enforcement workers including supervisors
Companies with federal contracts located in this zip code:
MARTENS COUNTRY KITCHEN PRODUC (1323 TOWPATH RD in PORT BYRON, NY; small business) : $90,428 in 8 contractsfrom 2005 to 2006
Contracts for Fruits and Vegetables by Defense Logistics Agency Signed by year:2000: $0; 2001: $0; 2002: $0; 2003: $0; 2004: $0; 2005: $42,916; 2006: $47,512.
Biggest contracts:
$17,080 with Defense Logistics Agency for Fruits and Vegetables. Signed on 2006-03-09. Completion date: 2006-03-09.
$16,656, same as above.Signed on 2006-04-06. Completion date: 2006-04-06.
$15,576, same as above.Signed on 2005-09-09. Completion date: 2005-09-09.
$13,776, same as above.Signed on 2006-01-05. Completion date: 2006-01-05.
SERVICE PRECISION GRINDING CO (2113 ROUTE 31 in PORT BYRON, NY; small business)
$3,582 with Navy for Tools and Attachments for Woodworking Machinery. Taking place in VA. Signed on 2005-09-22. Completion date: 2005-10-22.
Top industries in this zip code by the number of employees in 2005:
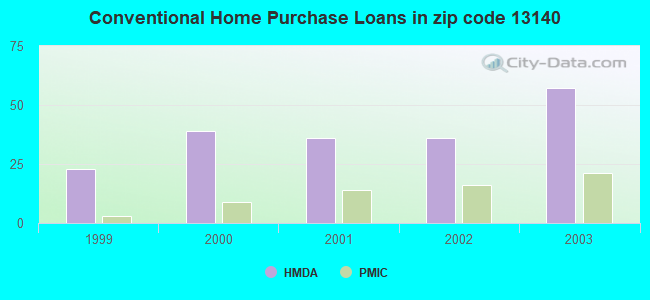
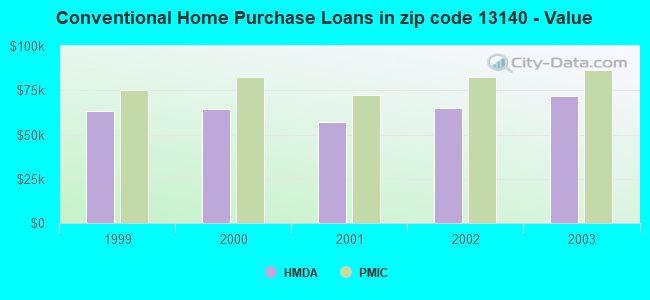
Detailed PMIC statistics for the following Tracts:0403.00
, 0405.00
2002 - 2018 National Fire Incident Reporting System (NFIRS) incidents
Based on the data from the years 2002 - 2018 the average number of fires per year is 13. The highest number of reported fires - 33 took place in 2009, and the least - 0 in 2005. The data has a rising trend.
When looking into fire subcategories, the most reports belonged to: Structure Fires (62.4%), and Outside Fires (24.5%).
Fire incident types reported to NFIRS in Zip Code 13140
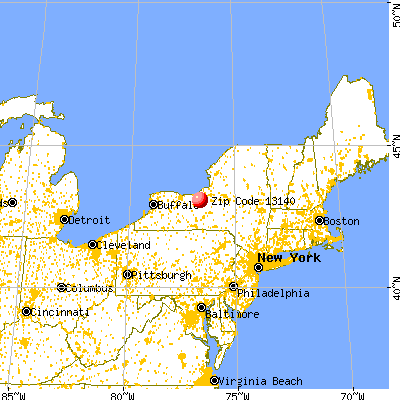


 Nearest zip codes: 13117, 13166, 13146, 13034, 13024, 13113.


 Based on the data from the years 2002 - 2018 the average number of fires per year is 13. The highest number of reported fires - 33 took place in 2009, and the least - 0 in 2005. The data has a rising trend.
 When looking into fire subcategories, the most reports belonged to: Structure Fires (62.4%), and Outside Fires (24.5%).