Estimated zip code population in 2022: 20,310 Zip code population in 2010: 20,356 Zip code population in 2000: 20,878
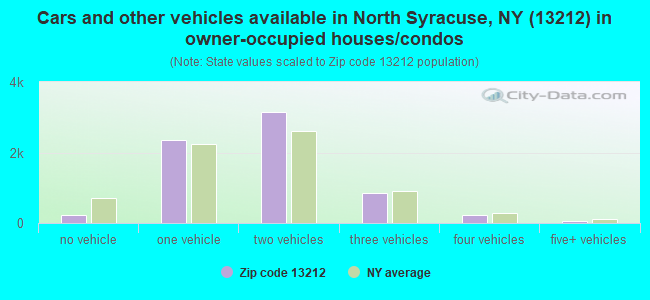
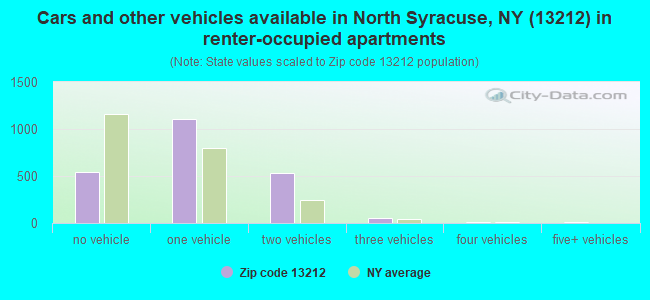
Houses and condos: 9,493 Renter-occupied apartments: 2,252
% of renters here:
25%
State:
46%
March 2022 cost of living index in zip code 13212: 101.5 (near average, U.S. average is 100)
Land area: 10.6 sq. mi. Water area: 0.0 sq. mi.
Population density: 1,917 people per square mile
(low).
OSM Map
General Map
Google Map
MSN Map
OSM Map
General Map
Google Map
MSN Map
OSM Map
General Map
Google Map
MSN Map
OSM Map
General Map
Google Map
MSN Map
Please wait while loading the map...
Real estate property taxes paid for housing units in 2022:
This zip code:
2.5% ($3,889)
New York:
1.5% ($6,180)
Median real estate property taxes paid for housing units with mortgages in 2022: $4,111 (2.6%) Median real estate property taxes paid for housing units with no mortgage in 2022: $3,467 (2.3%)
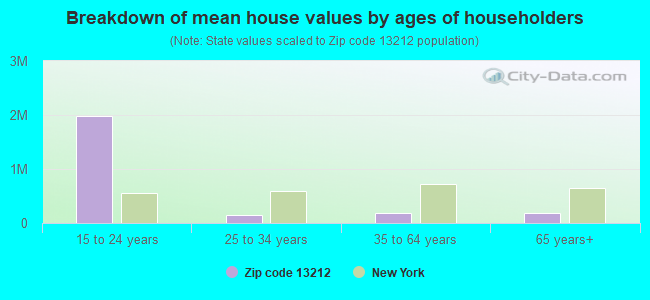
Estimated median house/condo value in 2022: $152,925
13212:
$152,925
New York:
$400,400
According to our research of New York and other state lists, there were 20 registered sex offenders living in 13212 zip code as of April 26, 2024. The ratio of all residents to sex offenders in zip code 13212 is 1,047 to 1. The ratio of registered sex offenders to all residents in this zip code is near the state average.
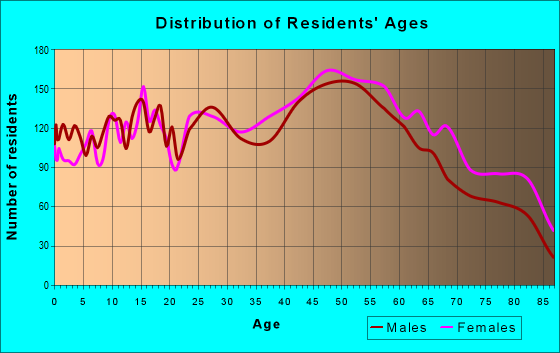
Median resident age:
This zip code:
45.9 years
New York median age:
40.0 years
Average household size:
This zip code:
2.2 people
New York:
2.5 people
Averages for the 2020 tax year for zip code 13212, filed in 2021:
Average Adjusted Gross Income (AGI) in 2020: $55,063 (Individual Income Tax Returns)
Here:
$55,063
State:
$90,930
Salary/wage: $48,297 (reported on 80.7% of returns)
Here:
$48,297
State:
$72,104
(% of AGI for various income ranges: 1033.1% for AGIs below $25k, 3399.6% for AGIs $25k-50k, 6281.2% for AGIs $50k-75k, 8984.6% for AGIs $75k-100k, 15605.0% for AGIs $100k-200k, 48038.3% for AGIs over 200k)
Taxable interest for individuals: $717 (reported on 37.8% of returns)
This zip code:
$717
New York:
$3,075
(% of AGI for various income ranges: 19.0% for AGIs below $25k, 11.6% for AGIs $25k-50k, 32.1% for AGIs $50k-75k, 58.9% for AGIs $75k-100k, 102.3% for AGIs $100k-200k, 823.3% for AGIs over 200k)
Ordinary dividends: $2,938 (reported on 18.9% of returns)
Here:
$2,938
State:
$11,095
(% of AGI for various income ranges: 32.8% for AGIs below $25k, 32.0% for AGIs $25k-50k, 54.3% for AGIs $50k-75k, 109.3% for AGIs $75k-100k, 196.2% for AGIs $100k-200k, 2186.7% for AGIs over 200k)
Net capital gain/loss in AGI: +$6,277 (reported on 14.5% of returns)
Here:
+$6,277
State:
+$44,925
(% of AGI for various income ranges: 9.0% for AGIs below $25k, 28.0% for AGIs $25k-50k, 65.3% for AGIs $50k-75k, 140.4% for AGIs $75k-100k, 396.2% for AGIs $100k-200k, 6465.0% for AGIs over 200k)
Profit/loss from business: +$10,384 (reported on 10.5% of returns)
Here:
+$10,384
State:
+$14,940
(% of AGI for various income ranges: 71.5% for AGIs below $25k, 66.6% for AGIs $25k-50k, 113.3% for AGIs $50k-75k, 153.7% for AGIs $75k-100k, 310.4% for AGIs $100k-200k, 5496.7% for AGIs over 200k)
Taxable individual retirement arrangement distribution: $14,069 (reported on 11.3% of returns)
13212:
$14,069
New York:
$19,609
(% of AGI for various income ranges: 90.6% for AGIs below $25k, 106.7% for AGIs $25k-50k, 186.4% for AGIs $50k-75k, 432.2% for AGIs $75k-100k, 620.6% for AGIs $100k-200k, 2425.0% for AGIs over 200k)
Self-employed (Keogh) retirement plans: $16,450 (reported on 0.2% of returns)
13212:
$16,450
New York:
$32,497
(% of AGI for various income ranges: 22.8% for AGIs $50k-75k)
Total itemized deductions: $22,787 (reported on 4.8% of returns)
Here:
$22,787
State:
$39,326
(% of AGI for various income ranges: 19.3% for AGIs below $25k, 60.7% for AGIs $25k-50k, 169.9% for AGIs $50k-75k, 295.8% for AGIs $75k-100k, 450.9% for AGIs $100k-200k, 2825.0% for AGIs over 200k)
Charity contributions: $5,892 (reported on 3.6% of returns)
Here:
$5,892
State:
$15,420
(% of AGI for various income ranges: 8.1% for AGIs $25k-50k, 15.9% for AGIs $50k-75k, 44.0% for AGIs $75k-100k, 106.7% for AGIs $100k-200k, 1113.3% for AGIs over 200k)
Taxes paid: $8,087 (reported on 4.8% of returns)
13212:
$8,087
State:
$9,183
(% of AGI for various income ranges: 4.3% for AGIs below $25k, 15.0% for AGIs $25k-50k, 75.6% for AGIs $50k-75k, 134.3% for AGIs $75k-100k, 158.7% for AGIs $100k-200k, 633.3% for AGIs over 200k)
Earned income credit: $1,880 (reported on 12.1% of returns)
Here:
$1,880
State:
$2,138
(% of AGI for various income ranges: 60.6% for AGIs below $25k, 42.9% for AGIs $25k-50k)
Percentage of individuals using paid preparers for their 2020 taxes: 95.9%
Here:
96%
State:
95%
(% for various income ranges: 94.6% for AGIs below $25k, 96.0% for AGIs $25k-50k, 96.4% for AGIs $50k-75k, 96.6% for AGIs $75k-100k, 97.6% for AGIs $100k-200k, 94.1% for AGIs over 200k)
Averages for the 2012 tax year for zip code 13212, filed in 2013:
Average Adjusted Gross Income (AGI) in 2012: $45,803 (Individual Income Tax Returns)
Here:
$45,803
State:
$77,088
Salary/wage: $40,859 (reported on 81.8% of returns)
Here:
$40,859
State:
$60,593
(% of AGI for various income ranges: 68.2% for AGIs below $25k, 78.1% for AGIs $25k-50k, 75.6% for AGIs $50k-75k, 75.2% for AGIs $75k-100k, 74.7% for AGIs $100k-200k, 44.4% for AGIs over 200k)
Taxable interest for individuals: $741 (reported on 44.2% of returns)
This zip code:
$741
New York:
$3,125
(% of AGI for various income ranges: 1.2% for AGIs below $25k, 0.5% for AGIs $25k-50k, 0.5% for AGIs $50k-75k, 0.6% for AGIs $75k-100k, 0.7% for AGIs $100k-200k, 1.8% for AGIs over 200k)
Ordinary dividends: $2,712 (reported on 22.1% of returns)
Here:
$2,712
State:
$10,299
(% of AGI for various income ranges: 1.6% for AGIs below $25k, 0.9% for AGIs $25k-50k, 0.9% for AGIs $50k-75k, 1.0% for AGIs $75k-100k, 1.4% for AGIs $100k-200k, 4.1% for AGIs over 200k)
Net capital gain/loss in AGI: +$3,570 (reported on 13.2% of returns)
Here:
+$3,570
State:
+$42,474
(% of AGI for various income ranges: 0.2% for AGIs $25k-50k, 0.3% for AGIs $50k-75k, 0.7% for AGIs $75k-100k, 1.4% for AGIs $100k-200k, 7.3% for AGIs over 200k)
Profit/loss from business: +$10,877 (reported on 10.1% of returns)
Here:
+$10,877
State:
+$16,168
(% of AGI for various income ranges: 4.5% for AGIs below $25k, 1.8% for AGIs $25k-50k, 1.4% for AGIs $50k-75k, 1.7% for AGIs $75k-100k, 3.0% for AGIs $100k-200k, 4.2% for AGIs over 200k)
Taxable individual retirement arrangement distribution: $10,740 (reported on 13.2% of returns)
13212:
$10,740
New York:
$17,621
(% of AGI for various income ranges: 4.9% for AGIs below $25k, 2.7% for AGIs $25k-50k, 3.1% for AGIs $50k-75k, 3.4% for AGIs $75k-100k, 3.4% for AGIs $100k-200k)
Self-employment retirement plans: $15,350 (reported on 0.4% of returns)
13212:
$15,350
New York:
$27,330
Total itemized deductions: $16,440 (21% of AGI, reported on 30.3% of returns)
Here:
$16,440
State:
$34,985
Here:
20.6% of AGI
State:
21.3% of AGI
(% of AGI for various income ranges: 5.8% for AGIs below $25k, 9.1% for AGIs $25k-50k, 10.7% for AGIs $50k-75k, 12.1% for AGIs $75k-100k, 13.8% for AGIs $100k-200k, 12.5% for AGIs over 200k)
Charity contributions: $2,149 (reported on 24.4% of returns)
Here:
$2,149
State:
$5,572
(% of AGI for various income ranges: 0.5% for AGIs below $25k, 0.9% for AGIs $25k-50k, 1.0% for AGIs $50k-75k, 1.4% for AGIs $75k-100k, 1.6% for AGIs $100k-200k, 1.3% for AGIs over 200k)
Taxes paid: $8,162 (reported on 30.3% of returns)
13212:
$8,162
State:
$18,656
(% of AGI for various income ranges: 1.8% for AGIs below $25k, 3.7% for AGIs $25k-50k, 4.9% for AGIs $50k-75k, 6.0% for AGIs $75k-100k, 7.6% for AGIs $100k-200k, 9.2% for AGIs over 200k)
Earned income credit: $1,926 (reported on 14.3% of returns)
Here:
$1,926
State:
$2,230
(% of AGI for various income ranges: 4.2% for AGIs below $25k, 0.8% for AGIs $25k-50k)
Percentage of individuals using paid preparers for their 2012 taxes: 53.5%
Here:
53%
State:
66%
(% for various income ranges: 46.7% for AGIs below $25k, 52.7% for AGIs $25k-50k, 58.2% for AGIs $50k-75k, 64.4% for AGIs $75k-100k, 63.0% for AGIs $100k-200k, 88.9% for AGIs over 200k)
Averages for the 2004 tax year for zip code 13212, filed in 2005:
Average Adjusted Gross Income (AGI) in 2004: $39,337 (Individual Income Tax Returns)
Here:
$39,337
State:
$59,519
Salary/wage: $36,616 (reported on 83.2% of returns)
Here:
$36,616
State:
$50,673
(% of AGI for various income ranges: 84.6% for AGIs below $10k, 69.7% for AGIs $10k-25k, 79.5% for AGIs $25k-50k, 80.5% for AGIs $50k-75k, 81.7% for AGIs $75k-100k, 70.7% for AGIs over 100k)
Taxable interest for individuals: $954 (reported on 56.1% of returns)
This zip code:
$954
New York:
$2,377
(% of AGI for various income ranges: 4.2% for AGIs below $10k, 2.1% for AGIs $10k-25k, 1.1% for AGIs $25k-50k, 0.9% for AGIs $50k-75k, 0.8% for AGIs $75k-100k, 2.0% for AGIs over 100k)
Taxable dividends: $1,922 (reported on 28.0% of returns)
Here:
$1,922
State:
$5,394
(% of AGI for various income ranges: 2.5% for AGIs below $10k, 1.5% for AGIs $10k-25k, 1.1% for AGIs $25k-50k, 1.0% for AGIs $50k-75k, 1.2% for AGIs $75k-100k, 2.1% for AGIs over 100k)
Net capital gain/loss: +$2,170 (reported on 19.3% of returns)
Here:
+$2,170
State:
+$23,581
(% of AGI for various income ranges: -1.0% for AGIs below $10k, -0.1% for AGIs $10k-25k, 0.3% for AGIs $25k-50k, 0.5% for AGIs $50k-75k, 0.6% for AGIs $75k-100k, 4.0% for AGIs over 100k)
Profit/loss from business: +$8,359 (reported on 11.0% of returns)
Here:
+$8,359
State:
+$13,809
(% of AGI for various income ranges: 3.6% for AGIs below $10k, 3.7% for AGIs $10k-25k, 1.8% for AGIs $25k-50k, 1.3% for AGIs $50k-75k, 1.6% for AGIs $75k-100k, 4.0% for AGIs over 100k)
IRA payment deduction: $2,885 (reported on 2.4% of returns)
13212:
$2,885
New York:
$3,115
(% of AGI for various income ranges: 0.3% for AGIs below $10k, 0.2% for AGIs $10k-25k, 0.2% for AGIs $25k-50k, 0.1% for AGIs $50k-75k, 0.1% for AGIs $75k-100k, 0.2% for AGIs over 100k)
Self-employed pension: $11,861 (reported on 0.4% of returns)
Here:
$11,861
New York:
$19,016
Total itemized deductions: $13,994 (20% of AGI, reported on 32.5% of returns)
Here:
$13,994
State:
$25,864
Here:
20.4% of AGI
State:
21.9% of AGI
(% of AGI for various income ranges: 7.5% for AGIs below $10k, 6.8% for AGIs $10k-25k, 10.3% for AGIs $25k-50k, 12.2% for AGIs $50k-75k, 13.8% for AGIs $75k-100k, 13.5% for AGIs over 100k)
Charity contributions deductions: $2,141 (3% of AGI, reported on 29.8% of returns)
Here:
$2,141
State:
$4,439
Here:
3.0% of AGI
State:
3.6% of AGI
(% of AGI for various income ranges: 0.7% for AGIs below $10k, 0.7% for AGIs $10k-25k, 1.3% for AGIs $25k-50k, 1.7% for AGIs $50k-75k, 2.2% for AGIs $75k-100k, 2.0% for AGIs over 100k)
Total tax: $4,964 (reported on 76.4% of returns)
13212:
$4,964
State:
$11,730
(% of AGI for various income ranges: 2.3% for AGIs below $10k, 4.1% for AGIs $10k-25k, 7.1% for AGIs $25k-50k, 8.8% for AGIs $50k-75k, 10.4% for AGIs $75k-100k, 17.0% for AGIs over 100k)
Earned income credit: $1,561 (reported on 12.5% of returns)
Here:
$1,561
State:
$1,757
Percentage of individuals using paid preparers for their 2004 taxes: 58.5%
Here:
58%
State:
67%
(% for various income ranges: 48.1% for AGIs below $10k, 58.6% for AGIs $10k-25k, 60.2% for AGIs $25k-50k, 62.1% for AGIs $50k-75k, 63.2% for AGIs $75k-100k, 68.1% for AGIs over 100k)
Likely homosexual households (counted as self-reported same-sex unmarried-partner households)
Lesbian couples: 0.1% of all households
Gay men: 0.1% of all households
Household received Food Stamps/SNAP in the past 12 months: 955 Household did not receive Food Stamps/SNAP in the past 12 months: 8,105
Women who had a birth in the past 12 months: 122 (103 now married, 17 unmarried) Women who did not have a birth in the past 12 months: 4,136 (1,574 now married, 2,558 unmarried)
Housing units in zip code 13212 with a mortgage: 4,187 (536 second mortgage, 42 home equity loan, 432 both second mortgage and home equity loan) Houses without a mortgage: 370
Median monthly owner costs for units with a mortgage: $1,342 Median monthly owner costs for units without a mortgage: $585
Residents with income below the poverty level in 2022:
This zip code:
12.6%
Whole state:
14.3%
Residents with income below 50% of the poverty level in 2022:
This zip code:
6.3%
Whole state:
6.8%
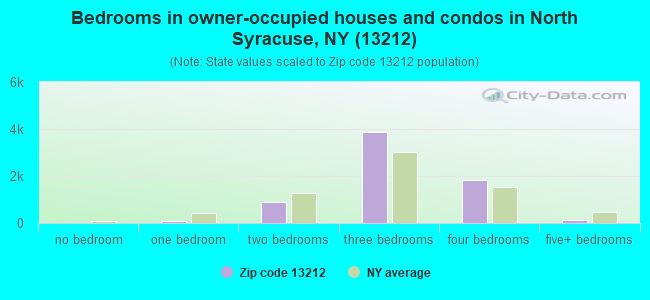
Median number of rooms in houses and condos:
Here:
6.5
State:
6.3
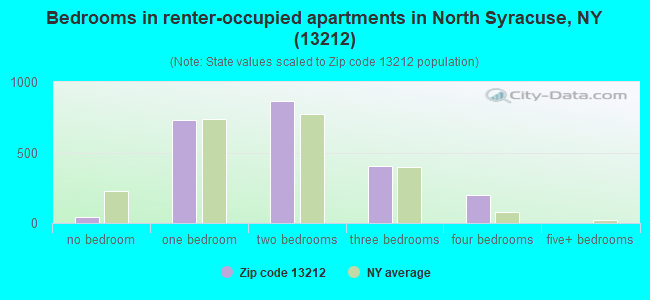
Median number of rooms in apartments:
Here:
4.3
State:
3.8
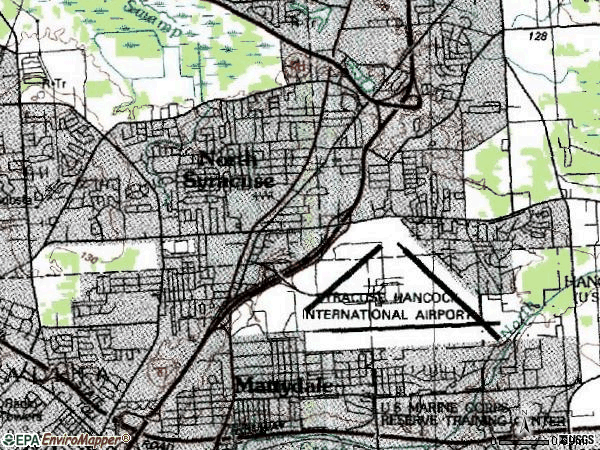
Notable locations in this zip code not listed on our city pages
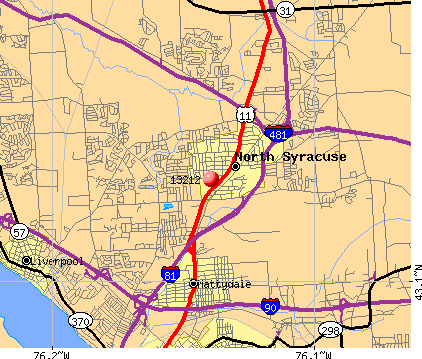
Notable locations in zip code 13212: Mattydale Toll Plaza (A), Buckley Landing Assisted Living Facility (B), Northern Onondaga Public Library at North Syracuse (C), North Syracuse Village Hall (D), North Syracuse Fire Department (E). Display/hide their locations on the map
Churches in zip code 13212 include: Andrews Memorial United Methodist Church (A), Bellewood Baptist Church (B), Church of God (C), North Syracuse Christian Church (D), Pitcher Hill Community Church (E), Trinity Evangelical Presbyterian Church (F), Kingdom Hall of Jehovahs Witnesses (G), Luther Memorial Lutheran Church (H), Nazarene Community Church (I). Display/hide their locations on the map
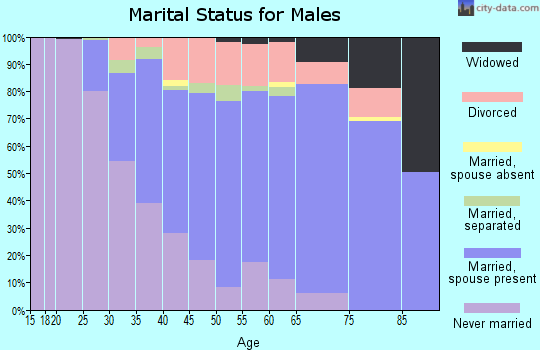
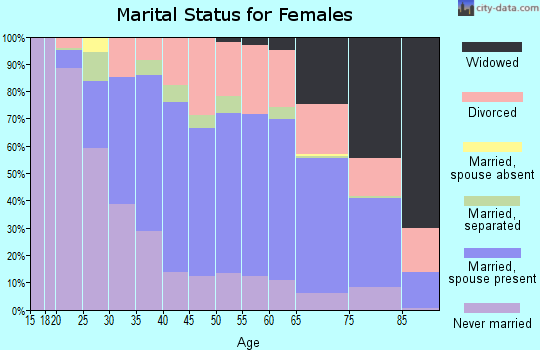
1,933 married couples with children.
1,345 single-parent households (629 men, 716 women).
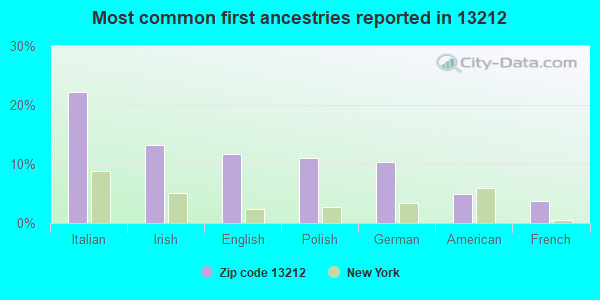
95.1% of residents of 13212 zip code speak English at home.
2.1% of residents speak Spanish at home (81% very well, 12% well, 4% not well, 3% not at all).
2.6% of residents speak other Indo-European language at home (76% very well, 13% well, 12% not well).
0.4% of residents speak Asian or Pacific Island language at home (46% very well, 54% well).
0.1% of residents speak other language at home (100% well).
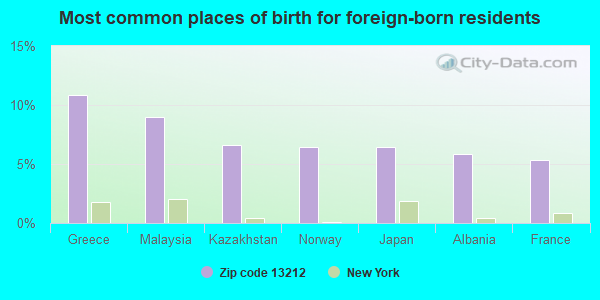
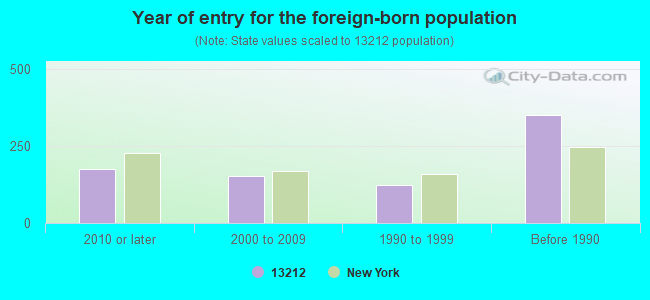
Foreign born population: 640 (3.2%) (68.9% of them are naturalized citizens)
Major facilities with environmental interests located in this zip code:
AMERICAN ADVANCED ORGANICS (1 DUPLI PARK DR in SYRACUSE, NY)
STATE MASTER (New York facility tracking) - AIR PROGRAM HAZARDOUS WASTE BIENNIAL REPORTER (Resource Conservation and Recovery Act (tracking hazardous waste)) Large Quantity Generators, more that 1000 kg of hazardous waste/month (Resource Conservation and Recovery Act (tracking hazardous waste)) Business SIC classification: MEDICINAL CHEMICALS AND BOTANICAL PRODUCTS Business NAICS classification: MEDICINAL AND BOTANICAL MANUFACTURING.; MEDICINAL AND BOTANICAL MANUFACTURING. Organizations: ALBANY MOLECULAR RESEARCH INC (AIR PERMITTING FACILITY OWNER CONTACT)
, AMERICAN ADVANCED ORGANICS INC (LEGALLY RESPONSIBLE PARTY)
Alternative names: ALBANY MOLECULAR RESEARCH
HASKINS OLDS-GMC TRUCK (3812 BREWERTON RD in NORTH SYRACUSE, NY)
STATE MASTER (New York facility tracking) - AIR PROGRAM Small Quantity Generators, between 100 kg and 1000 kg of hazardous waste/month (Resource Conservation and Recovery Act (tracking hazardous waste)) Alternative names: DICK HASKINS OLDS GMC TRUCK
ALLEN ROAD ES ( in NORTH SYRACUSE, NY)
(National Center for Education Statistics) - STATE ID-420303060001 Organizations: NORTH SYRACUSE CSD (SCHOOL DISTRICT)
ALBANY MOLECULAR RESEARCH INC (PERFORMANCE DR in N SYRACUSE, NY)
Large Quantity Generators, more that 1000 kg of hazardous waste/month (Resource Conservation and Recovery Act (tracking hazardous waste)) - notification Organizations: JAYACHANDRA REDDY PHD (CONTACT/OWNER)
Alternative names: ALBANY MOLECULAR RESEARCH SRC
AMERICAN EAGLE AT HANCOCK INTL AIRPORT (HANCOCK INTERNATIONAL AIRPORT in SYRACUSE, NY)
Conditionally Exempt Small Quantity Generators, less than 100 kg/month of hazardous waste (Resource Conservation and Recovery Act (tracking hazardous waste)) Business NAICS classification: SCHEDULED PASSENGER AIR TRANSPORTATION. Organizations: AMERICAN EAGLE AIRLINES (CONTACT/OPERATOR)
, CITY OF SYRACUSE (CONTACT/OWNER)
Alternative names: AMERICAN AIRLINES
ASPEN DENTAL (124 NORTHERN LIGHTS DR in NORTH SYRACUSE, NY)
Conditionally Exempt Small Quantity Generators, less than 100 kg/month of hazardous waste (Resource Conservation and Recovery Act (tracking hazardous waste)) Organizations: ASPEN DENTAL ASSOC OF NY PC (CONTACT/OPERATOR)
Conditionally Exempt Small Quantity Generators, less than 100 kg/month of hazardous waste (Resource Conservation and Recovery Act (tracking hazardous waste)) - notification TRANSPORTER (Resource Conservation and Recovery Act (tracking hazardous waste)) - notification Organizations: CITY OF SYRACUSE (CONTACT/OWNER)
HANCOCK INTL ASSOC (4050 S SERVICE RD in SYRACUSE, NY)
(Resource Conservation and Recovery Act (tracking hazardous waste))
HERKIMER PETROLEUM (760 S BAY RD in SYRACUSE, NY)
(Resource Conservation and Recovery Act (tracking hazardous waste))
HERTZ CORPORATION (HANCOCK AIRPORT in SYRACUSE, NY)
(Resource Conservation and Recovery Act (tracking hazardous waste))
HFDC - HANCOCK AIRPARK (7268 CASWELL PL in NORTH SYRACUSE, NY)
(Resource Conservation and Recovery Act (tracking hazardous waste))
HIGHWAY OIL INC 155 (407 N MAIN ST in NORTH SYRACUSE, NY)
(Resource Conservation and Recovery Act (tracking hazardous waste))
CLESTRA CLEANROOM INC (7000 PERFORMANCE DR in NORTH SYRACUSE, NY)
(Resource Conservation and Recovery Act (tracking hazardous waste))
Housing units lacking complete plumbing facilities: 0.8% Housing units lacking complete kitchen facilities: 1.0%
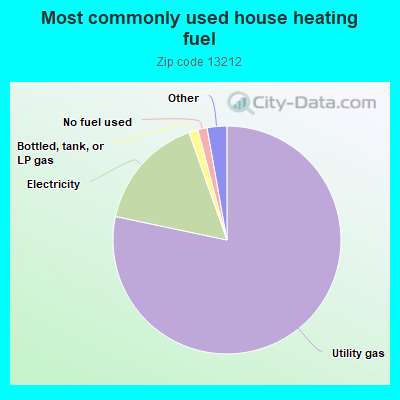
78.4%Utility gas
16.3%Electricity
1.3%Bottled, tank, or LP gas
1.3%No fuel used
0.9%Wood
0.8%Other fuel
0.8%Fuel oil, kerosene, etc.
Population in 1990: 22,829.
Place of birth for U.S.-born residents:
This state: 16,564
Northeast: 1,067
Midwest: 555
South: 944
West: 312
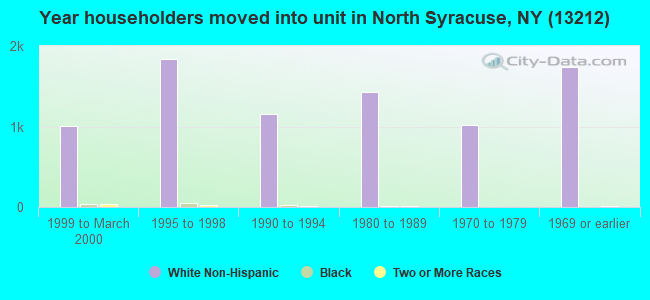
68% of the 13212 zip code residents lived in the same house 5 years ago. Out of people who lived in different houses, 78% lived in this county. Out of people who lived in different counties, 50% lived in New York.
93% of the 13212 zip code residents lived in the same house 1 year ago. Out of people who lived in different houses, 60% moved from this county. Out of people who lived in different houses, 26% moved from different county within same state. Out of people who lived in different houses, 12% moved from different state. Out of people who lived in different houses, 1% moved from abroad.
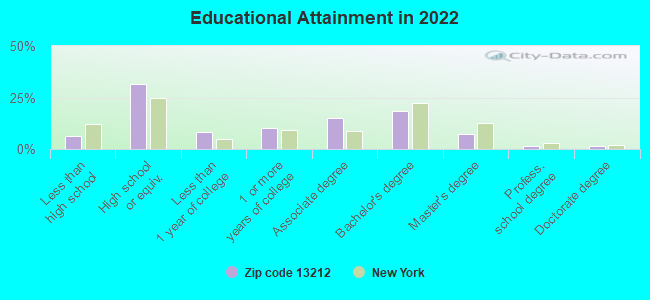
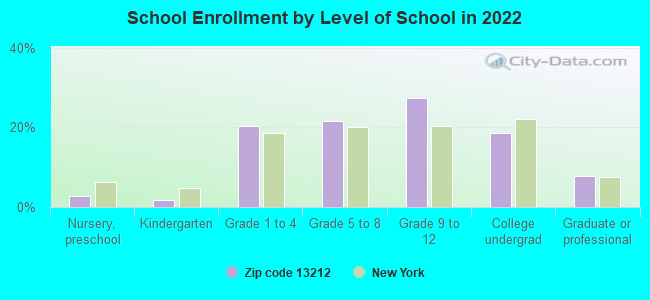
Private vs. public school enrollment:
Students in private schools in grades 1 to 8 (elementary and middle school): 123
Here:
7.1%
New York:
15.6%
Students in private schools in grades 9 to 12 (high school): 71
Here:
6.3%
New York:
15.0%
Students in private undergraduate colleges: 365
Here:
47.4%
New York:
39.2%
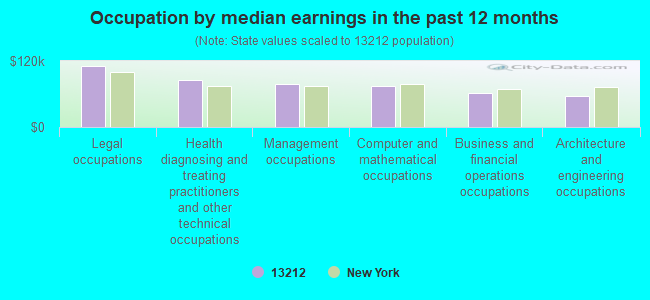
Occupation by median earnings in the past 12 months ($)
111,779Legal occupations
85,795Health diagnosing and treating practitioners and other technical occupations
78,797Management occupations
73,772Computer and mathematical occupations
62,055Business and financial operations occupations
56,706Architecture and engineering occupations
Companies with biggest federal contracts located in this zip code:
SYRACUSE RESEARCH CORPORATION (6225 RUNNING RIDGE ROAD in NORTH SYRACUSE, NY) : $767,184,005 in 1111 contractsfrom 1999 to 2006
Contracts for Electronic Countermeasures, Counter-Countermeasures and Quick Reaction Capability Equipment, Guns, through 30 mm, Defense Electronics and Communication Equipment -- Basic Research (R&D), Defense Electronics and Communication Equipment -- Advanced Development (R&D), and moreby Army, Air Force, Office of Policy, Management and Budget/Chief Financial Officer, EPA, and others Signed by year:2000: $9,480,228; 2001: $17,601,315; 2002: $23,450,558; 2003: $41,646,236; 2004: $66,857,896; 2005: $329,794,102; 2006: $276,843,607.
Biggest contracts:
$114,761,820 with Army for Electronic Countermeasures, Counter-Countermeasures and Quick Reaction Capability Equipment. Signed on 2006-03-31. Completion date: 2009-06-30.
$92,269,540, same as above.Signed on 2005-09-15. Completion date: 2006-05-20.
$82,983,600, same as above.Signed on 2005-12-15. Completion date: 2006-07-31.
$45,454,029, same as above.Signed on 2006-02-27. Completion date: 2009-06-30.
SDD HOLDING INC (7401 ROUND POND RD in NORTH SYRACUSE, NY; small business) : $934,471 in 42 contractsfrom 2005 to 2006
Contracts for ADPE System Configuration, ADP Central Processing Unit (CPU, Computer), Analog, ADP Central Processing Unit (CPU, Computer), Digital, ADP Input/Output and Storage Devices, and moreby Army, Air Force, Bureau of Land Management, Department of Veterans Affairs, and others Signed by year:2000: $0; 2001: $0; 2002: $0; 2003: $0; 2004: $0; 2005: $843,366; 2006: $91,105.
Biggest contracts:
$99,996 with Army for ADPE System Configuration. Signed on 2005-06-17. Completion date: 2005-07-29.
$93,269 with Army for ADP Central Processing Unit (CPU, Computer), Analog. Signed on 2005-05-06. Completion date: 2005-06-10.
$74,240 with Army for ADP Central Processing Unit (CPU, Computer), Digital. Signed on 2005-09-28. Completion date: 2005-11-04.
$54,094 with Army for ADPE System Configuration. Signed on 2006-04-20. Completion date: 2006-05-05.
SONNET SOFTWARE INC (100 ELWOOD DAVIS RD in NORTH SYRACUSE, NY; small business) : $512,931 in 24 contractsfrom 2002 to 2006
Contracts for ADP Software, Other Defense -- Applied Research and Exploratory Development (R&D), Computer Aided Design/Computer Aided Manufacturing (CAD/CAM) Services, Other Management Support Services, and moreby Navy, NASA, National Institute of Standards and Technology, Air Force, and others Signed by year:2000: $0; 2001: $0; 2002: $36,000; 2003: $47,690; 2004: $96,737; 2005: $236,395; 2006: $96,109.
Biggest contracts:
$71,260 with Navy for ADP Software. Signed on 2005-06-21. Completion date: 2006-09-30.
$42,660 with Navy for Other Defense -- Applied Research and Exploratory Development (R&D). Signed on 2003-05-23. Completion date: 2003-06-06.
$38,610 with Navy for ADP Software. Signed on 2006-03-31. Completion date: 2006-04-14.
$37,620 with NASA for ADP Software. Signed on 2005-01-06. Completion date: 2005-02-06.
ENVIRONMENTAL TECHNICAL GROUP, (7280 CASWELL STREET in NORTH SYRACUSE, NY) : $332,363 in 18 contractsfrom 2000 to 2004
Contracts for Trash/Garbage Collection Services - Including Portable Sanitation Services, Hazardous Substance Removal, Cleanup, and Disposal Services and Operational Support, Maintenance, Repair and Rebuilding of Equipment -- Materials Handling Equipment, Oil Spill Response including Cleanup, Removal, Disposal and Operational Support by Army, United States Coast Guard (disused code: now 7008), U.S. Coast Guard Signed by year:2000: $154,984; 2001: $5,000; 2002: $169,659; 2003: $23,730; 2004: -$21,010; 2005: $0; 2006: $0.
Biggest contracts:
$164,297 with Army for Trash/Garbage Collection Services - Including Portable Sanitation Services. Signed on 2002-08-28. Completion date: 2002-07-15.
$154,984 with Army for Hazardous Substance Removal, Cleanup, and Disposal Services and Operational Support. Signed on 2000-09-25. Completion date: 2001-02-16.
$23,730 with Army for Maintenance, Repair and Rebuilding of Equipment -- Materials Handling Equipment. Signed on 2003-10-28. Completion date: 2003-09-30.
$20,000 with United States Coast Guard (disused code: now 7008) for Oil Spill Response including Cleanup, Removal, Disposal and Operational Support. Signed on 2001-01-15. Completion date: 2002-01-15.
R A C HOLDING IND (5400 SOUTH BAY ROAD in NORTH SYRACUSE, NY; small business) : $279,669 in 36 contractsfrom 2002 to 2006
Contracts for Lease or Rental of Equipment -- Ground Effect Vehicles, Motor Vehicles, Trailers, and Cycles, Passenger Motor Vehicles, Motor Vehicle Maintenance and Repair Shop Specialized Equipment by Army Signed by year:2000: $0; 2001: $0; 2002: $31,349; 2003: $154,768; 2004: $87,702; 2005: $0; 2006: $5,850.
Biggest contracts:
$74,281 with Army for Lease or Rental of Equipment -- Ground Effect Vehicles, Motor Vehicles, Trailers, and Cycles. Signed on 2004-08-18. Completion date: 2004-09-20.
$66,944, same as above.Signed on 2003-01-21. Completion date: 2003-03-15.
$28,740, same as above.Signed on 2002-10-23. Completion date: 2003-09-30.
$18,399, same as above.Signed on 2003-03-26. Completion date: 2003-10-31.
MATERIAL HANDLING TECHNOLOGIES (7488 ROUND POND RD in NORTH SYRACUSE, NY; small business) : $182,991 in 4 contractsfrom 2004 to 2005
$81,615 with U.S. Army Corps of Engineers - civil program financing only for Maintenance, Repair and Rebuilding of Equipment -- Miscellaneous. Signed on 2004-03-18. Completion date: 2004-04-06.
$81,615 with Army for Maintenance, Repair and Rebuilding of Equipment -- Miscellaneous. Signed on 2004-03-18. Completion date: 2004-04-06.
$13,596 with Defense Logistics Agency for Winches, Hoists, Cranes, and Derricks. Signed on 2005-01-21. Completion date: 2005-03-07.
$6,165 with Army for Winches, Hoists, Cranes, and Derricks. Signed on 2004-04-27. Completion date: 2004-04-30.
SYRACUSE EQUIPMENT LEASING CO (6131 TAFT ROAD in NORTH SYRACUSE, NY; small business) : $123,600 in 3 contractsfrom 2002 to 2003
$61,800 with Navy for Lease or Rental of Equipment -- Ground Effect Vehicles, Motor Vehicles, Trailers, and Cycles. Taking place in ME. Signed on 2002-12-20. Completion date: 2003-03-19.
$61,800, same as above.Signed on 2003-03-17. Completion date: 2004-03-19.
$0, same as above.Signed on 2003-03-17. Completion date: 2004-03-19.
CRITICAL LINK LLC (251 SALINA MEADOWS PARKWAY in SYRACUSE, NY; small business) : $99,950 in 2 contractsfrom 2002 to 2003
$50,000 with Air Force for Other Professional Services. Signed on 2003-04-22. Completion date: 2003-09-19.
$49,950, same as above.Signed on 2002-09-19. Completion date: 2002-12-20.
CLEANROOM SYSTEMS INC (7000 PERFORMANCE DR in NORTH SYRACUSE, NY; small business)
$84,500 with Air Force for Air Conditioning Equipment. Signed on 2002-08-30. Completion date: 2002-11-29.
CARNEGIE CAFE & CATERING CO (1308 BUCKLEY RD in NORTH SYRACUSE, NY; small business) : $70,241 in 2 contractsfrom 2003 to 2004
$36,127 with Army for Meat, Poultry, and Fish. Signed on 2004-06-04. Completion date: 2004-06-05.
$34,114, same as above.Signed on 2003-06-26. Completion date: 2003-06-07.
Top industries in this zip code by the number of employees in 2005:
2002 - 2018 National Fire Incident Reporting System (NFIRS) incidents
Based on the data from the years 2002 - 2018 the average number of fires per year is 74. The highest number of fire incidents - 140 took place in 2007, and the least - 2 in 2005. The data has a rising trend.
When looking into fire subcategories, the most incidents belonged to: Structure Fires (53.2%), and Outside Fires (26.1%).
Fire incident types reported to NFIRS in Zip Code 13212
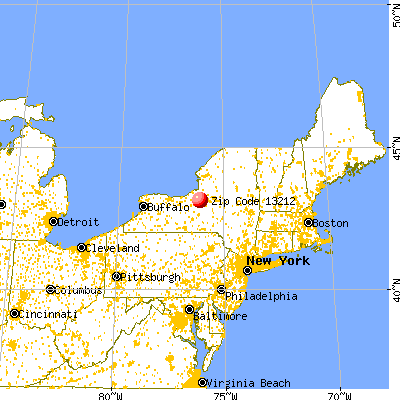


 Nearest zip codes: 13211, 13208, 13206, 13088, 13203, 13290.
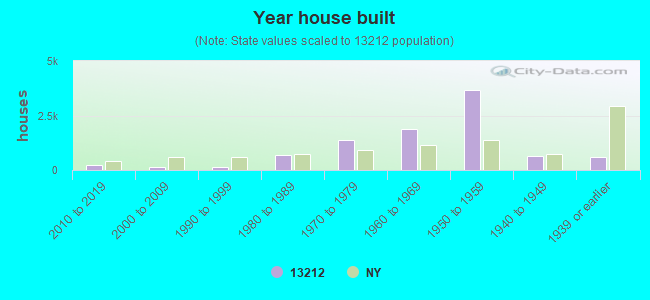


 Based on the data from the years 2002 - 2018 the average number of fires per year is 74. The highest number of fire incidents - 140 took place in 2007, and the least - 2 in 2005. The data has a rising trend.
 When looking into fire subcategories, the most incidents belonged to: Structure Fires (53.2%), and Outside Fires (26.1%).