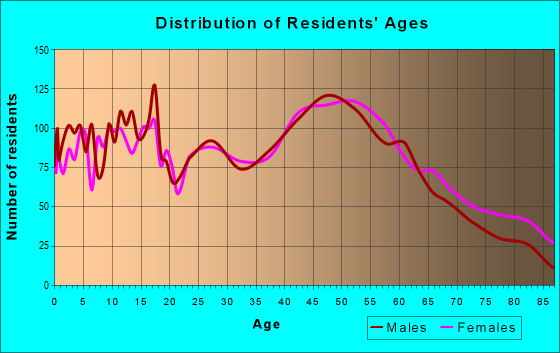
Estimated zip code population in 2022: 12,653 Zip code population in 2010: 14,125 Zip code population in 2000: 13,192
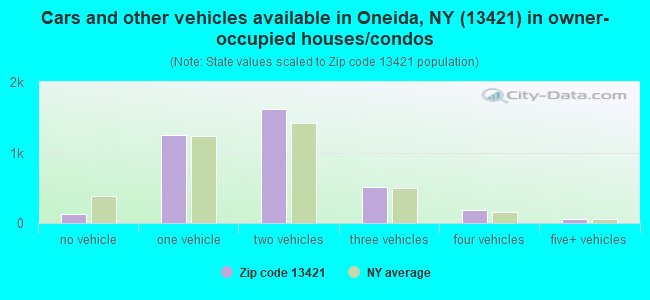
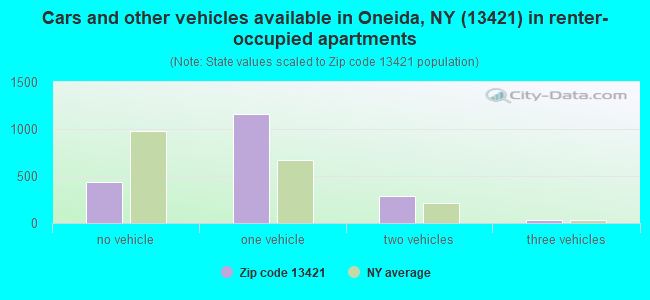
Houses and condos: 5,910 Renter-occupied apartments: 1,903
% of renters here:
34%
State:
46%
March 2022 cost of living index in zip code 13421: 101.2 (near average, U.S. average is 100)
Land area: 42.0 sq. mi. Water area: 0.1 sq. mi.
Population density: 301 people per square mile
(very low).
OSM Map
General Map
Google Map
MSN Map
OSM Map
General Map
Google Map
MSN Map
OSM Map
General Map
Google Map
MSN Map
OSM Map
General Map
Google Map
MSN Map
Please wait while loading the map...
Real estate property taxes paid for housing units in 2022:
This zip code:
2.3% ($3,279)
New York:
1.5% ($6,180)
Median real estate property taxes paid for housing units with mortgages in 2022: $3,632 (2.4%) Median real estate property taxes paid for housing units with no mortgage in 2022: $2,688 (2.1%)
Averages for the 2020 tax year for zip code 13421, filed in 2021:
Average Adjusted Gross Income (AGI) in 2020: $56,173 (Individual Income Tax Returns)
Here:
$56,173
State:
$90,930
Salary/wage: $47,141 (reported on 82.3% of returns)
Here:
$47,141
State:
$72,104
(% of AGI for various income ranges: 1140.9% for AGIs below $25k, 3243.4% for AGIs $25k-50k, 5904.7% for AGIs $50k-75k, 8710.5% for AGIs $75k-100k, 15928.0% for AGIs $100k-200k, 62770.0% for AGIs over 200k)
Taxable interest for individuals: $988 (reported on 34.2% of returns)
This zip code:
$988
New York:
$3,075
(% of AGI for various income ranges: 11.9% for AGIs below $25k, 15.3% for AGIs $25k-50k, 33.3% for AGIs $50k-75k, 97.1% for AGIs $75k-100k, 107.3% for AGIs $100k-200k, 1246.0% for AGIs over 200k)
Ordinary dividends: $3,703 (reported on 16.3% of returns)
Here:
$3,703
State:
$11,095
(% of AGI for various income ranges: 19.1% for AGIs below $25k, 27.4% for AGIs $25k-50k, 68.9% for AGIs $50k-75k, 126.3% for AGIs $75k-100k, 230.5% for AGIs $100k-200k, 2212.0% for AGIs over 200k)
Net capital gain/loss in AGI: +$7,078 (reported on 11.9% of returns)
Here:
+$7,078
State:
+$44,925
(% of AGI for various income ranges: 8.3% for AGIs below $25k, 18.3% for AGIs $25k-50k, 56.8% for AGIs $50k-75k, 100.0% for AGIs $75k-100k, 394.8% for AGIs $100k-200k, 4828.0% for AGIs over 200k)
Profit/loss from business: +$12,861 (reported on 9.6% of returns)
Here:
+$12,861
State:
+$14,940
(% of AGI for various income ranges: 58.5% for AGIs below $25k, 63.1% for AGIs $25k-50k, 146.2% for AGIs $50k-75k, 200.2% for AGIs $75k-100k, 472.5% for AGIs $100k-200k, 4018.0% for AGIs over 200k)
Taxable individual retirement arrangement distribution: $13,166 (reported on 9.6% of returns)
13421:
$13,166
New York:
$19,609
(% of AGI for various income ranges: 48.4% for AGIs below $25k, 73.2% for AGIs $25k-50k, 177.1% for AGIs $50k-75k, 377.3% for AGIs $75k-100k, 589.3% for AGIs $100k-200k, 1480.0% for AGIs over 200k)
Total itemized deductions: $33,410 (reported on 3.1% of returns)
Here:
$33,410
State:
$39,326
(% of AGI for various income ranges: 94.9% for AGIs $25k-50k, 125.3% for AGIs $50k-75k, 205.9% for AGIs $75k-100k, 304.5% for AGIs $100k-200k, 4306.0% for AGIs over 200k)
Charity contributions: $5,727 (reported on 2.4% of returns)
Here:
$5,727
State:
$15,420
(% of AGI for various income ranges: 7.0% for AGIs below $25k, 14.3% for AGIs $50k-75k, 42.0% for AGIs $75k-100k, 51.6% for AGIs $100k-200k, 492.0% for AGIs over 200k)
Taxes paid: $8,610 (reported on 3.1% of returns)
13421:
$8,610
State:
$9,183
(% of AGI for various income ranges: 15.0% for AGIs $25k-50k, 46.2% for AGIs $50k-75k, 82.0% for AGIs $75k-100k, 115.0% for AGIs $100k-200k, 638.0% for AGIs over 200k)
Earned income credit: $2,077 (reported on 16.5% of returns)
Here:
$2,077
State:
$2,138
(% of AGI for various income ranges: 80.6% for AGIs below $25k, 59.7% for AGIs $25k-50k)
Percentage of individuals using paid preparers for their 2020 taxes: 96.4%
Here:
96%
State:
95%
(% for various income ranges: 95.3% for AGIs below $25k, 96.7% for AGIs $25k-50k, 96.8% for AGIs $50k-75k, 96.6% for AGIs $75k-100k, 97.2% for AGIs $100k-200k, 100.0% for AGIs over 200k)
Averages for the 2012 tax year for zip code 13421, filed in 2013:
Average Adjusted Gross Income (AGI) in 2012: $46,830 (Individual Income Tax Returns)
Here:
$46,830
State:
$77,088
Salary/wage: $39,838 (reported on 84.6% of returns)
Here:
$39,838
State:
$60,593
(% of AGI for various income ranges: 75.2% for AGIs below $25k, 78.3% for AGIs $25k-50k, 74.3% for AGIs $50k-75k, 76.0% for AGIs $75k-100k, 76.6% for AGIs $100k-200k, 45.7% for AGIs over 200k)
Taxable interest for individuals: $816 (reported on 40.2% of returns)
This zip code:
$816
New York:
$3,125
(% of AGI for various income ranges: 0.9% for AGIs below $25k, 0.6% for AGIs $25k-50k, 0.8% for AGIs $50k-75k, 0.5% for AGIs $75k-100k, 0.5% for AGIs $100k-200k, 1.0% for AGIs over 200k)
Ordinary dividends: $2,855 (reported on 19.2% of returns)
Here:
$2,855
State:
$10,299
(% of AGI for various income ranges: 1.1% for AGIs below $25k, 0.8% for AGIs $25k-50k, 1.0% for AGIs $50k-75k, 1.1% for AGIs $75k-100k, 1.0% for AGIs $100k-200k, 2.2% for AGIs over 200k)
Net capital gain/loss in AGI: +$7,984 (reported on 9.9% of returns)
Here:
+$7,984
State:
+$42,474
(% of AGI for various income ranges: 0.3% for AGIs $50k-75k, 0.5% for AGIs $75k-100k, 1.3% for AGIs $100k-200k, 9.2% for AGIs over 200k)
Profit/loss from business: +$12,984 (reported on 9.9% of returns)
Here:
+$12,984
State:
+$16,168
(% of AGI for various income ranges: 4.0% for AGIs below $25k, 2.1% for AGIs $25k-50k, 1.7% for AGIs $50k-75k, 1.1% for AGIs $75k-100k, 3.3% for AGIs $100k-200k, 4.8% for AGIs over 200k)
Taxable individual retirement arrangement distribution: $11,243 (reported on 10.5% of returns)
13421:
$11,243
New York:
$17,621
(% of AGI for various income ranges: 3.2% for AGIs below $25k, 2.1% for AGIs $25k-50k, 2.2% for AGIs $50k-75k, 2.9% for AGIs $75k-100k, 3.0% for AGIs $100k-200k, 1.9% for AGIs over 200k)
Self-employment retirement plans: $18,575 (reported on 0.6% of returns)
13421:
$18,575
New York:
$27,330
Total itemized deductions: $20,026 (20% of AGI, reported on 23.7% of returns)
Here:
$20,026
State:
$34,985
Here:
19.6% of AGI
State:
21.3% of AGI
(% of AGI for various income ranges: 5.6% for AGIs below $25k, 6.6% for AGIs $25k-50k, 8.5% for AGIs $50k-75k, 10.4% for AGIs $75k-100k, 14.0% for AGIs $100k-200k, 14.0% for AGIs over 200k)
Charity contributions: $2,684 (reported on 18.7% of returns)
Here:
$2,684
State:
$5,572
(% of AGI for various income ranges: 0.4% for AGIs below $25k, 0.6% for AGIs $25k-50k, 0.9% for AGIs $50k-75k, 1.1% for AGIs $75k-100k, 1.4% for AGIs $100k-200k, 1.9% for AGIs over 200k)
Taxes paid: $9,882 (reported on 23.7% of returns)
13421:
$9,882
State:
$18,656
(% of AGI for various income ranges: 1.2% for AGIs below $25k, 2.2% for AGIs $25k-50k, 3.7% for AGIs $50k-75k, 5.0% for AGIs $75k-100k, 7.7% for AGIs $100k-200k, 9.3% for AGIs over 200k)
Earned income credit: $2,120 (reported on 19.2% of returns)
Here:
$2,120
State:
$2,230
(% of AGI for various income ranges: 5.9% for AGIs below $25k, 1.1% for AGIs $25k-50k)
Percentage of individuals using paid preparers for their 2012 taxes: 54.0%
Here:
54%
State:
66%
(% for various income ranges: 48.6% for AGIs below $25k, 53.8% for AGIs $25k-50k, 59.1% for AGIs $50k-75k, 60.0% for AGIs $75k-100k, 64.2% for AGIs $100k-200k, 80.0% for AGIs over 200k)
Averages for the 2004 tax year for zip code 13421, filed in 2005:
Average Adjusted Gross Income (AGI) in 2004: $37,831 (Individual Income Tax Returns)
Here:
$37,831
State:
$59,519
Salary/wage: $34,322 (reported on 85.1% of returns)
Here:
$34,322
State:
$50,673
(% of AGI for various income ranges: 111.3% for AGIs below $10k, 76.4% for AGIs $10k-25k, 81.6% for AGIs $25k-50k, 80.0% for AGIs $50k-75k, 84.0% for AGIs $75k-100k, 64.7% for AGIs over 100k)
Taxable interest for individuals: $1,170 (reported on 47.8% of returns)
This zip code:
$1,170
New York:
$2,377
(% of AGI for various income ranges: 5.3% for AGIs below $10k, 2.1% for AGIs $10k-25k, 1.5% for AGIs $25k-50k, 1.0% for AGIs $50k-75k, 0.8% for AGIs $75k-100k, 1.7% for AGIs over 100k)
Taxable dividends: $2,376 (reported on 22.9% of returns)
Here:
$2,376
State:
$5,394
(% of AGI for various income ranges: 3.3% for AGIs below $10k, 1.1% for AGIs $10k-25k, 0.9% for AGIs $25k-50k, 1.1% for AGIs $50k-75k, 0.9% for AGIs $75k-100k, 2.5% for AGIs over 100k)
Net capital gain/loss: +$3,869 (reported on 15.6% of returns)
Here:
+$3,869
State:
+$23,581
(% of AGI for various income ranges: -1.4% for AGIs below $10k, 0.2% for AGIs $10k-25k, 0.5% for AGIs $25k-50k, 1.1% for AGIs $50k-75k, 1.3% for AGIs $75k-100k, 4.1% for AGIs over 100k)
Profit/loss from business: +$14,540 (reported on 11.0% of returns)
Here:
+$14,540
State:
+$13,809
(% of AGI for various income ranges: 5.0% for AGIs below $10k, 2.3% for AGIs $10k-25k, 2.8% for AGIs $25k-50k, 2.0% for AGIs $50k-75k, 1.6% for AGIs $75k-100k, 9.8% for AGIs over 100k)
IRA payment deduction: $2,537 (reported on 2.4% of returns)
13421:
$2,537
New York:
$3,115
(% of AGI for various income ranges: 0.3% for AGIs $10k-25k, 0.2% for AGIs $25k-50k, 0.2% for AGIs $50k-75k, 0.1% for AGIs over 100k)
Self-employed pension: $13,140 (reported on 0.7% of returns)
Here:
$13,140
New York:
$19,016
Total itemized deductions: $16,732 (21% of AGI, reported on 24.3% of returns)
Here:
$16,732
State:
$25,864
Here:
20.7% of AGI
State:
21.9% of AGI
(% of AGI for various income ranges: 9.9% for AGIs below $10k, 3.9% for AGIs $10k-25k, 8.0% for AGIs $25k-50k, 10.5% for AGIs $50k-75k, 14.7% for AGIs $75k-100k, 15.0% for AGIs over 100k)
Charity contributions deductions: $2,409 (3% of AGI, reported on 21.7% of returns)
Here:
$2,409
State:
$4,439
Here:
2.9% of AGI
State:
3.6% of AGI
(% of AGI for various income ranges: 0.6% for AGIs below $10k, 0.4% for AGIs $10k-25k, 0.8% for AGIs $25k-50k, 1.4% for AGIs $50k-75k, 1.7% for AGIs $75k-100k, 2.3% for AGIs over 100k)
Total tax: $5,190 (reported on 73.3% of returns)
13421:
$5,190
State:
$11,730
(% of AGI for various income ranges: 2.3% for AGIs below $10k, 4.0% for AGIs $10k-25k, 7.0% for AGIs $25k-50k, 8.7% for AGIs $50k-75k, 10.0% for AGIs $75k-100k, 17.9% for AGIs over 100k)
Earned income credit: $1,562 (reported on 17.5% of returns)
Here:
$1,562
State:
$1,757
Percentage of individuals using paid preparers for their 2004 taxes: 59.5%
Here:
59%
State:
67%
(% for various income ranges: 51.2% for AGIs below $10k, 60.3% for AGIs $10k-25k, 60.5% for AGIs $25k-50k, 64.7% for AGIs $50k-75k, 61.0% for AGIs $75k-100k, 69.0% for AGIs over 100k)
Likely homosexual households (counted as self-reported same-sex unmarried-partner households)
Lesbian couples: 0.3% of all households
Gay men: 0.0% of all households
Household received Food Stamps/SNAP in the past 12 months: 945 Household did not receive Food Stamps/SNAP in the past 12 months: 4,720
Women who had a birth in the past 12 months: 154 (105 now married, 48 unmarried) Women who did not have a birth in the past 12 months: 2,383 (956 now married, 1,423 unmarried)
Housing units in zip code 13421 with a mortgage: 2,152 (214 second mortgage, 15 home equity loan, 151 both second mortgage and home equity loan) Houses without a mortgage: 57
Median monthly owner costs for units with a mortgage: $1,291 Median monthly owner costs for units without a mortgage: $557
Residents with income below the poverty level in 2022:
This zip code:
11.4%
Whole state:
14.3%
Residents with income below 50% of the poverty level in 2022:
This zip code:
6.1%
Whole state:
6.8%
Median number of rooms in houses and condos:
Here:
6.7
State:
6.3
Median number of rooms in apartments:
Here:
4.2
State:
3.8
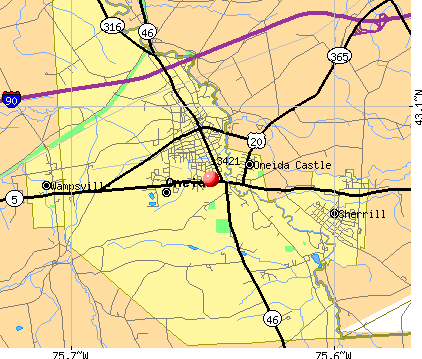
Notable locations in this zip code not listed on our city pages
Notable locations in zip code 13421: Oneida Community Golf Club (A), Oneida City Sewage Treatment Plant (B), Oneida Castle Village Hall (C), Old Ladies Home of Madison County (D), Oneida Engine Company Number 2 (E), Saint Joseph's Parish Hall (F), Hand Barker Memorial Library (G), Oneida Nursing Home (H), Oneida City Hall (I), Hazel L Carpenter Home Assisted Living Center (J), Oneida Community Mansion House (K), Oneida Public Library (L). Display/hide their locations on the map
Churches in zip code 13421 include: Kingdom Hall of Jehovahs Witnesses (A), New Hope Christian Community (B), Saint Pauls United Methodist Church of Oneida (C), The Church of Jesus Christ of Latter Day Saints (D), Indian Church (E), Cochran Memorial Presbyterian Church (F), First United Methodist Church (G), Redeemer Lutheran Church (H), First Church of Christ Scientist (I). Display/hide their locations on the map
Cemeteries: Saint Patricks Cemetery (1), Oneida Community Cemetery (2), Glenwood Cemetery (3), Valley View Cemetery (4), Sunny Side Cemetery (5). Display/hide their locations on the map
In group quarters: 163 (-1 institutionalized population)
Size of family households: 1,446 2-persons, 702 3-persons, 490 4-persons, 332 5-persons, 68 6-persons, 27 7-or-more-persons
Size of nonfamily households: 2,103 1-person, 516 2-persons, 8 3-persons
1,478 married couples with children.
840 single-parent households (188 men, 652 women).
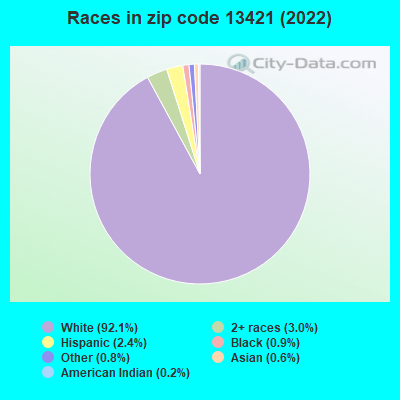
97.2% of residents of 13421 zip code speak English at home.
0.7% of residents speak Spanish at home (79% very well, 21% not well).
1.4% of residents speak other Indo-European language at home (86% very well, 14% well, 1% not well).
0.5% of residents speak Asian or Pacific Island language at home (70% very well, 20% well, 10% not well).
0.3% of residents speak other language at home (69% very well, 31% well).
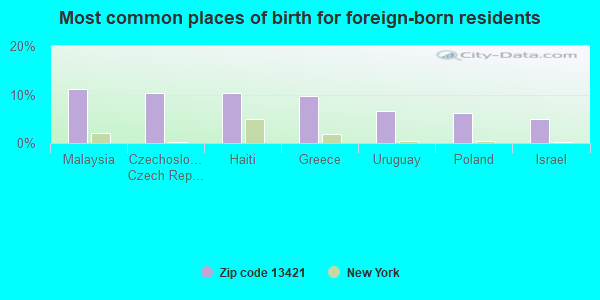
Foreign born population: 229 (1.8%) (91.6% of them are naturalized citizens)
This zip code:
1.8%
Whole state:
22.7%
11%Malaysia
10%Czechoslovakia (includes Czech Republic and Slovakia)
10%Haiti
10%Greece
7%Uruguay
6%Poland
5%Israel
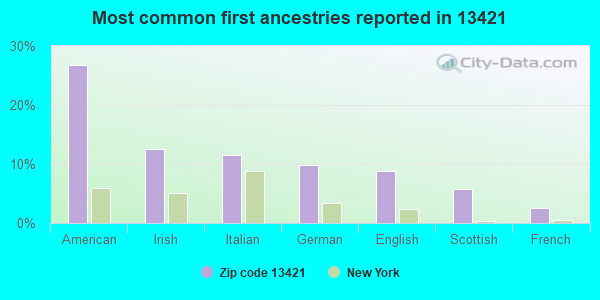
27%American
13%Irish
12%Italian
10%German
9%English
6%Scottish
3%French
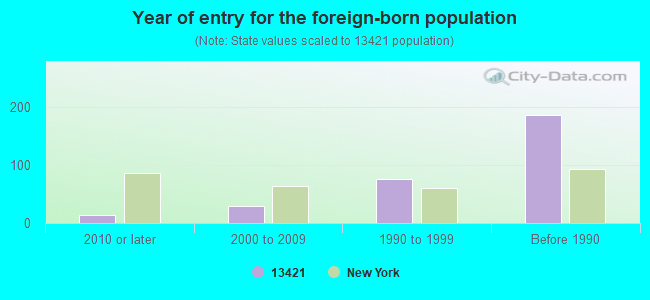
Year of entry for the foreign-born population
142010 or later
292000 to 2009
761990 to 1999
187Before 1990
Facilities with environmental interests located in this zip code:
H P HOOD INC (ROUTE 5 252 GENESEE STREET in ONEIDA, NY)
AIR SYNTHETIC MINOR (AIRS/AFS) STATE MASTER (New York facility tracking) - AIR PROGRAM, National Pollutant Discharge Elimination System Permit ENFORCEMENT/COMPLIANCE ACTIVITY (Integrated Compliance Information System) - ICIS-HQ-2001-6030, FORMAL ENFORCEMENT ACTION (Integrated Compliance Information System) - ICIS-HQ-2001-6030, FORMAL ENFORCEMENT ACTION TRI REPORTER (Tracking of toxic chemicals releasing facilities) Business SIC classification: NATURAL, PROCESSED, AND IMITATION CHEESE; DRY, CONDENSED, AND EVAPORATED DAIRY PRODUCTS; FLUID MILK Organizations: HP HOOD INC (AIR FEE BILLING CONTACT)
, HP HOOD LLC (LEGALLY RESPONSIBLE PARTY)
HARDEN FURNITURE INC (368 LENOX AVE in ONEIDA, NY)
AIR SYNTHETIC MINOR (AIRS/AFS) STATE MASTER (New York facility tracking) - AIR PROGRAM, HAZARDOUS WASTE PROGRAM (Resource Conservation and Recovery Act (tracking hazardous waste)) Business SIC classification: WOOD HOUSEHOLD FURNITURE, UPHOLSTERED; WOOD OFFICE FURNITURE Alternative names: HARDEN FURNITURE, ONEIDA DIV., ONEIDA FURNITURE
HAROLD NYE FORD INC (RTE 5 - FIVE CORNERS in ONEIDA, NY)
STATE MASTER (New York facility tracking) - AIR PROGRAM, (Resource Conservation and Recovery Act (tracking hazardous waste)) Business SIC classification: TOP, BODY, AND UPHOLSTERY REPAIR SHOPS AND PAINT SHOPS Business NAICS classification: AUTOMOTIVE BODY, PAINT, AND INTERIOR REPAIR AND MAINTENANCE.
AGWAY INC WAREHOUSE (623 FITCH ST in ONEIDA, NY)
(Resource Conservation and Recovery Act (tracking hazardous waste))
HARTMAN ENTERPRISES INC (455 ELIZABETH ST in ONEIDA, NY)
Large Quantity Generators, more that 1000 kg of hazardous waste/month (Resource Conservation and Recovery Act (tracking hazardous waste)) - notification Organizations: ADELINE M SWEET (CONTACT/OWNER)
Housing units lacking complete plumbing facilities: 1.7% Housing units lacking complete kitchen facilities: 1.6%
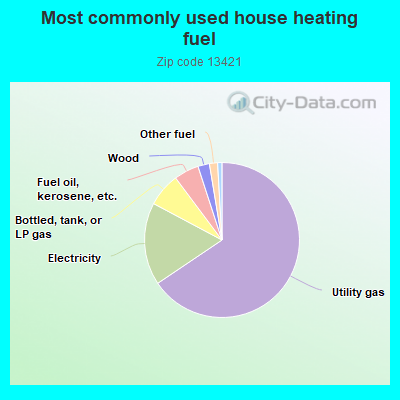
65.5%Utility gas
17.2%Electricity
7.0%Bottled, tank, or LP gas
5.2%Fuel oil, kerosene, etc.
2.4%Wood
1.7%Other fuel
0.9%No fuel used
Population in 1990: 11,876. Population change in the 1990s: +1,316 (+11.1%).
Place of birth for U.S.-born residents:
This state: 11,095
Northeast: 485
Midwest: 187
South: 312
West: 214
61% of the 13421 zip code residents lived in the same house 5 years ago. Out of people who lived in different houses, 55% lived in this county. Out of people who lived in different counties, 50% lived in New York.
90% of the 13421 zip code residents lived in the same house 1 year ago. Out of people who lived in different houses, 55% moved from this county. Out of people who lived in different houses, 41% moved from different county within same state. Out of people who lived in different houses, 2% moved from different state. Out of people who lived in different houses, 0% moved from abroad.
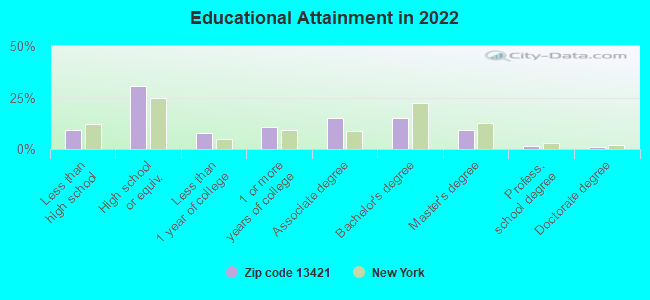
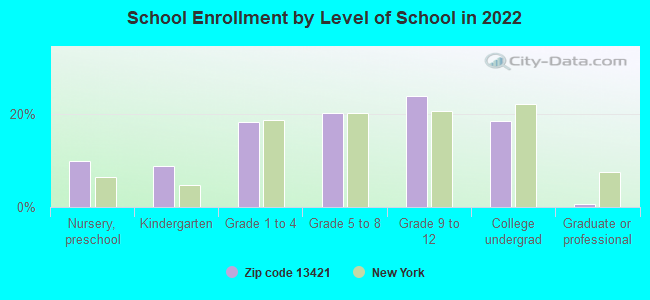
Private vs. public school enrollment:
Students in private schools in grades 1 to 8 (elementary and middle school): 74
Here:
7.5%
New York:
15.6%
Students in private schools in grades 9 to 12 (high school): 100
Here:
16.0%
New York:
15.0%
Students in private undergraduate colleges: 109
Here:
23.1%
New York:
39.2%
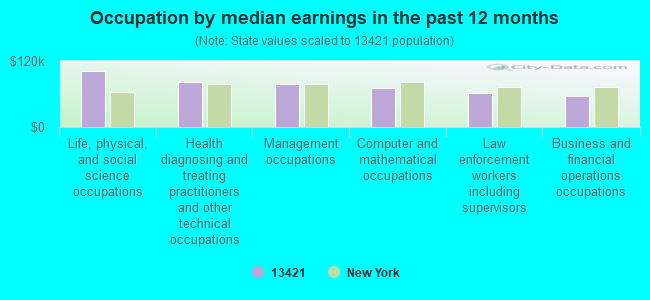
Occupation by median earnings in the past 12 months ($)
101,242Life, physical, and social science occupations
81,836Health diagnosing and treating practitioners and other technical occupations
77,723Management occupations
70,569Computer and mathematical occupations
61,166Law enforcement workers including supervisors
56,516Business and financial operations occupations
Companies with federal contracts located in this zip code (ONEIDA, NY):
JOHN BEYERLE C3I ASSOCIATES (110 WILLOW ST; small business) : $12,857,815 in 62 contractsfrom 2001 to 2006
Contracts for Other Defense -- Applied Research and Exploratory Development (R&D), Other Defense -- Basic Research (R&D), Miscellaneous Defense Hard Goods -- Applied Research and Exploratory Development (R&D), Other Defense -- Advanced Development (R&D) by Air Force, Army Signed by year:2000: $0; 2001: $310,963; 2002: $1,076,136; 2003: $1,782,357; 2004: $5,088,426; 2005: $3,204,732; 2006: $1,395,201.
Biggest contracts:
$1,182,009 with Air Force for Other Defense -- Applied Research and Exploratory Development (R&D). Signed on 2004-03-31. Completion date: 2008-06-15.
$919,007, same as above.Signed on 2004-11-17. Completion date: 2008-06-15.
$904,543, same as above.Signed on 2004-04-30. Completion date: 2008-06-15.
$652,364, same as above.Signed on 2006-01-18. Completion date: 2008-03-12.
VISIBLE SYSTEMS CORPORATION (248 N MAIN ST; small business) : $163,170 in 18 contractsfrom 2004 to 2006
Contracts for ADP Components, Other ADP and Telecommunications Services (includes data storage on tapes, compact disks, etc.), ADP Support Equipment, ADP Software, and moreby Navy, National Oceanic and Atmospheric Administration/Under Secretary for Oceans and Atmosphere, NASA, Department of Defense, and others Signed by year:2000: $0; 2001: $0; 2002: $0; 2003: $0; 2004: $67,025; 2005: $42,915; 2006: $53,230.
Biggest contracts:
$51,040 with Navy for ADP Components. Signed on 2004-05-28. Completion date: 2004-09-24.
$24,895 with Navy for Other ADP and Telecommunications Services (includes data storage on tapes, compact disks, etc.). Taking place in MA. Signed on 2005-09-27. Completion date: 2005-09-30.
$22,020 with National Oceanic and Atmospheric Administration/Under Secretary for Oceans and Atmosphere for ADP Support Equipment. Taking place in MS. Signed on 2006-07-27. Effective on 2006-08-01. Completion date: 2007-07-31.
$15,985 with Navy for ADP Components. Signed on 2006-01-23. Completion date: 2006-02-10.
KINNEY, MICHAEL (4848 STATE ROUTE 365; small business) : $18,233 in 2 contractsin 2003
$22,341 with Army for Trailers. Signed on 2003-09-20. Completion date: 2003-09-30.
-$4,108, same as above.Signed on 2003-09-26. Completion date: 2003-09-30.
THOMAS BOYLAN (110 WILLOW STREET; small business) : $3,060 in 2 contractsin 2001
$3,060 with Army for Custodial Janitorial Services. Signed on 2001-10-01. Completion date: 2002-09-30.
$0, same as above.Signed on 2001-10-01. Completion date: 2002-09-30.
ONEIDA LTD (163-181 KENWOOD AVENUE)
$930 with Army for Cutlery and Flatware. Taking place in IL. Signed on 2004-05-06. Completion date: 2004-06-04.
Top industries in this zip code by the number of employees in 2005:
Health Care and Social Assistance: General Medical and Surgical Hospitals (500-999 employees: 1 establishment)
2002 - 2018 National Fire Incident Reporting System (NFIRS) incidents
Based on the data from the years 2002 - 2018 the average number of fires per year is 37. The highest number of reported fires - 74 took place in 2006, and the least - 2 in 2011. The data has a dropping trend.
When looking into fire subcategories, the most incidents belonged to: Structure Fires (40.5%), and Outside Fires (38.6%).
Fire incident types reported to NFIRS in Zip Code 13421


 Nearest zip codes: 13163, 13461, 13134, 13409, 13054, 13032.


 Based on the data from the years 2002 - 2018 the average number of fires per year is 37. The highest number of reported fires - 74 took place in 2006, and the least - 2 in 2011. The data has a dropping trend.
 When looking into fire subcategories, the most incidents belonged to: Structure Fires (40.5%), and Outside Fires (38.6%).